Community hub
Renewable resource
View on Wikipedia
_-_panoramio.jpg)

A renewable resource (also known as a flow resource[note 1][1]) is a natural resource which will replenish to replace the portion depleted by usage and consumption, either through natural reproduction or other recurring processes in a finite amount of time in a human time scale. It is also known as non conventional energy resources. When the recovery rate of resources is unlikely to ever exceed a human time scale, these are called perpetual resources.[1] Renewable resources are a part of Earth's natural environment and the largest components of its ecosphere. A positive life-cycle assessment is a key indicator of a resource's sustainability.
Definitions of renewable resources may also include agricultural production, as in agricultural products and to an extent water resources.[2] In 1962, Paul Alfred Weiss defined renewable resources as: "The total range of living organisms providing man with life, fibres, etc...".[3] Another type of renewable resources is renewable energy resources. Common sources of renewable energy include solar, geothermal and wind power, which are all categorized as renewable resources. Fresh water is an example of a renewable resource.
Air, food and water
[edit]Water resources
[edit]Water can be considered a renewable material when carefully controlled usage and temperature, treatment, and release are followed. If not, it would become a non-renewable resource at that location. For example, as groundwater is usually removed from an aquifer at a rate much greater than its very slow natural recharge, it is a considered non-renewable resource. Removal of water from the pore spaces in aquifers may cause permanent compaction (subsidence) that cannot be renewed. 97.5% of the water on the Earth is salt water, and 3% is fresh water; slightly over two thirds of this is frozen in glaciers and polar ice caps.[4] The remaining unfrozen freshwater is found mainly as groundwater, with only a small fraction (0.008%) present above ground or in the air.[5]
Water pollution is one of the main concerns regarding water resources. It is estimated that 22% of worldwide water is used in industry.[6] Major industrial users include hydroelectric dams, thermoelectric power plants (which use water for cooling), ore and oil refineries (which use water in chemical processes) and manufacturing plants (which use water as a solvent), it is also used for dumping garbage.
Desalination of seawater is considered a renewable source of water, although reducing its dependence on fossil fuel energy is needed for it to be fully renewable.[7]
-
 Panorama of a natural wetland (Sinclair Wetlands, New Zealand)

Non agricultural food
[edit]
Food is any substance consumed to provide nutritional support for the body.[8] Most food has its origin in renewable resources. Food is obtained directly from plants and animals.
Hunting may not be the first source of meat in the modernised world, but it is still an important and essential source for many rural and remote groups. It is also the sole source of feeding for wild carnivores.[9]
Sustainable agriculture
[edit]The phrase sustainable agriculture was coined by Australian agricultural scientist Gordon McClymont.[10] It has been defined as "an integrated system of plant and animal production practices having a site-specific application that will last over the long term".[11] Expansion of agricultural land reduces biodiversity and contributes to deforestation. The Food and Agriculture Organization of the United Nations estimates that in coming decades, cropland will continue to be lost to industrial and urban development, along with reclamation of wetlands, and conversion of forest to cultivation, resulting in the loss of biodiversity and increased soil erosion.[12]

Although air and sunlight are available everywhere on Earth, crops also depend on soil nutrients and the availability of water. Monoculture is a method of growing only one crop at a time in a given field, which can damage land and cause it to become either unusable or suffer from reduced yields. Monoculture can also cause the build-up of pathogens and pests that target one specific species. The Great Irish Famine (1845–1849) is a well-known example of the dangers of monoculture.
Crop rotation and long-term crop rotations confer the replenishment of nitrogen through the use of green manure in sequence with cereals and other crops, and can improve soil structure and fertility by alternating deep-rooted and shallow-rooted plants. Other methods to combat lost soil nutrients are returning to natural cycles that annually flood cultivated lands (returning lost nutrients indefinitely) such as the Flooding of the Nile, the long-term use of biochar, and use of crop and livestock landraces that are adapted to less than ideal conditions such as pests, drought, or lack of nutrients.
Agricultural practices are one of the single greatest contributor to the global increase in soil erosion rates.[13] It is estimated that "more than a thousand million tonnes of southern Africa's soil are eroded every year. Experts predict that crop yields will be halved within thirty to fifty years if erosion continues at present rates."[14] The Dust Bowl phenomenon in the 1930s was caused by severe drought combined with farming methods that did not include crop rotation, fallow fields, cover crops, soil terracing and wind-breaking trees to prevent wind erosion.[15]
The tillage of agricultural lands is one of the primary contributing factors to erosion, due to mechanised agricultural equipment that allows for deep plowing, which severely increases the amount of soil that is available for transport by water erosion.[16][17] The phenomenon called peak soil describes how large-scale factory farming techniques are affecting humanity's ability to grow food in the future.[18] Without efforts to improve soil management practices, the availability of arable soil may become increasingly problematic.[19][unreliable source?]

Methods to combat erosion include no-till farming, using a keyline design, growing wind breaks to hold the soil, and widespread use of compost. Fertilizers and pesticides can also have an effect of soil erosion,[20] which can contribute to soil salinity and prevent other species from growing. Phosphate is a primary component in the chemical fertiliser applied most commonly in modern agricultural production. However, scientists estimate that rock phosphate reserves will be depleted in 50–100 years and that Peak Phosphate will occur in about 2030.[21]
Industrial processing and logistics also have an effect on agriculture's sustainability. The way and locations crops are sold requires energy for transportation, as well as the energy cost for materials, labour, and transport. Food sold at a local location, such a farmers' market, have reduced energy overheads.
Air
[edit]Air is a renewable resource. All living organisms need oxygen, nitrogen (directly or indirectly), carbon (directly or indirectly) and many other gases in small quantities for their survival.
Non-food resources
[edit]
An important renewable resource is wood provided by means of forestry, which has been used for construction, housing and firewood since ancient times. [22][23][24] Plants provide the main sources for renewable resources, the main distinction is between energy crops and non-food crops. A large variety of lubricants, industrially used vegetable oils, textiles and fibre made e.g. of cotton, copra or hemp, paper derived from wood, rags or grasses, bioplastic are based on plant renewable resources. A large variety of chemical based products like latex, ethanol, resin, sugar and starch can be provided with plant renewables. Animal based renewables include fur, leather, technical fat and lubricants and further derived products, as e.g. animal glue, tendons, casings or in historical times ambra and baleen provided by whaling.
With regard to pharmacy ingredients and legal and illegal drugs, plants are important sources, however e.g. venom of snakes, frogs and insects has been a valuable renewable source of pharmacological ingredients. Before GMO production set in, insulin and important hormones were based on animal sources. Feathers, an important byproduct of poultry farming for food, is still being used as filler and as base for keratin in general. Same applies for the chitin produced in farming Crustaceans which may be used as base of chitosan. The most important part of the human body used for non-medical purposes is human hair as for artificial hair integrations, which is being traded worldwide.
Historical role
[edit]

Historically, renewable resources like firewood, latex, guano, charcoal, wood ash, plant colors as indigo, and whale products have been crucial for human needs but failed to supply demand in the beginning of the industrial era.[25] Early modern times faced large problems with overuse of renewable resources as in deforestation, overgrazing or overfishing.[25]
In addition to fresh meat and milk, which as food items are not the topic of this section, livestock farmers and artisans used further animal ingredients as tendons, horn, bones, bladders. Complex technical constructions as the composite bow were based on combination of animal and plant based materials. The current distribution conflict between biofuel and food production is being described as Food vs. fuel. Conflicts between food needs and usage, as supposed by fief obligations were in so far common in historical times as well.[26] However, a significant percentage of (middle European) farmers yields went into livestock, which provides as well organic fertiliser.[27] Oxen and horses were important for transportation purposes, drove engines as e.g. in treadmills.
Other regions solved the transportation problem with terracing, urban and garden agriculture.[25] Further conflicts as between forestry and herding, or (sheep) herders and cattle farmers led to various solutions. Some confined wool production and sheep to large state and nobility domains or outsourced to professional shepherds with larger wandering herds.[28]
The British Agricultural Revolution was mainly based on a new system of crop rotation, the four-field rotation. British agriculturist Charles Townshend recognised the invention in Dutch Waasland and popularised it in the 18th century UK, George Washington Carver in the USA. The system used wheat, turnips and barley and introduced as well clover. Clover is able to fix nitrogen from air, a practically non exhaustive renewable resource, into fertilizing compounds to the soil and allowed to increase yields by large. Farmers opened up a fodder crop and grazing crop. Thus livestock could to be bred year-round and winter culling was avoided. The amount of manure rose and allowed more crops but to refrain from wood pasture.[25]
Early modern times and the 19th century saw the previous resource base partially replaced respectively supplemented by large scale chemical synthesis and by the use of fossil and mineral resources respectively.[29] Besides the still central role of wood, there is a sort of renaissance of renewable products based on modern agriculture, genetic research and extraction technology. Besides fears about an upcoming global shortage of fossil fuels, local shortages due to boycotts, war and blockades or just transportation problems in remote regions have contributed to different methods of replacing or substituting fossil resources based on renewables.
Challenges
[edit]The use of certain basically renewable products as in TCM endangers various species. Just the black market in rhinoceros horn reduced the world's rhino population by more than 90 percent over the past 40 years.[30][31]
Renewables used for self sufficiency
[edit]
The success of the German chemical industry till World War I was based on the replacement of colonial products. The predecessors of IG Farben dominated the world market for synthetic dyes at the beginning of the 20th century[32][33] and had an important role in artificial pharmaceuticals, photographic film, agricultural chemicals and electrochemicals.[29]
However the former Plant breeding research institutes took a different approach. After the loss of the German colonial empire, important players in the field as Erwin Baur and Konrad Meyer switched to using local crops as base for economic autarky.[34][35] Meyer as a key agricultural scientist and spatial planner of the Nazi era managed and lead Deutsche Forschungsgemeinschaft resources and focused about a third of the complete research grants in Nazi Germany on agricultural and genetic research and especially on resources needed in case of a further German war effort.[34] A wide array of agrarian research institutes still existing today and having importance in the field was founded or enlarged in the time.
There were some major failures as trying to e.g. grow frost resistant olive species, but some success in the case of hemp, flax, rapeseed, which are still of current importance.[34] During World War 2, German scientists tried to use Russian Taraxacum (dandelion) species to manufacture natural rubber.[34] Rubber dandelions are still of interest, as scientists in the Fraunhofer Institute for Molecular Biology and Applied Ecology (IME) announced 2013 to have developed a cultivar that is suitable for commercial production of natural rubber.[36]
Legal situation and subsidies
[edit]Several legal and economic means have been used to enhance the market share of renewables. The UK uses Non-Fossil Fuel Obligations (NFFO), a collection of orders requiring the electricity distribution network operators in England and Wales to purchase electricity from the nuclear power and renewable energy sectors. Similar mechanisms operate in Scotland (the Scottish Renewable Orders under the Scottish Renewables Obligation) and Northern Ireland (the Northern Ireland Non-Fossil Fuel Obligation). In the US, Renewable Energy Certificates (RECs), use a similar approach. German Energiewende is using feed-in tariffs. An unexpected outcome of the subsidies was the quick increase of pellet byfiring in conventional fossil fuel plants (compare Tilbury power stations) and cement works, making wood respectively biomass accounting for about half of Europe's renewable-energy consumption.[24]
Examples of industrial use
[edit]Biorenewable chemicals
[edit]
Biorenewable chemicals are chemicals created by biological organisms that provide feedstocks for the chemical industry.[37] Biorenewable chemicals can provide solar-energy-powered substitutes for the petroleum-based carbon feedstocks that currently supply the chemical industry. The tremendous diversity of enzymes in biological organisms, and the potential for synthetic biology to alter these enzymes to create yet new chemical functionalities, can drive the chemical industry. A major platform for creation of new chemicals is the polyketide biosynthetic pathway, which generates chemicals containing repeated alkyl chain units with potential for a wide variety of functional groups at the different carbon atoms.[37][38][39] Polyurethane research is ongoing that specifically uses renewable resources.[40]
Bioplastics
[edit]
Bioplastics are a form of plastics derived from renewable biomass sources, such as vegetable fats and oils, lignin, corn starch, pea starch[41] or microbiota.[42] The most common form of bioplastic is thermoplastic starch. Other forms include Cellulose bioplastics, biopolyester, Polylactic acid, and bio-derived polyethylene.
The production and use of bioplastics is generally regarded as a more sustainable activity when compared to plastic production from petroleum (petroplastic); however, manufacturing of bioplastic materials is often still reliant upon petroleum as an energy and materials source. Because of the fragmentation in the market and ambiguous definitions it is difficult to describe the total market size for bioplastics, but the global production capacity is estimated at 327,000 tonnes.[43] In contrast, global consumption of all flexible packaging is estimated at 12.3 million tonnes.[44]
Bioasphalt
[edit]Bioasphalt is an asphalt alternative made from non-petroleum based renewable resources. Manufacturing sources of bioasphalt include sugar, molasses and rice, corn and potato starches, and vegetable oil based waste. Asphalt made with vegetable oil based binders was patented by Colas SA in France in 2004.[45][46]
Renewable energy
[edit]Renewable energy refers to the provision of energy via renewable resources which are naturally replenished as fast as they are being used. Examples are sunlight, wind, biomass, rain, tides, waves and geothermal heat.[47] Renewable energy may replace conventional fuels in four distinct markets, namely electricity generation, hot water/space heating, motor fuels, and rural (off-grid) energy services.[48] Manufacturing of renewable energy devices uses non-renewable resources such as mined metals and land surface.
Biomass
[edit]
Biomass is referring to biological material from living, or recently living organisms, most often referring to plants or plant-derived materials.
Sustainable harvesting and use of renewable resources (i.e., maintaining a positive renewal rate) can reduce air pollution, soil contamination, habitat destruction and land degradation.[49] Biomass energy is derived from six distinct energy sources: garbage, wood, plants, waste, landfill gases, and alcohol fuels. Historically, humans have harnessed biomass-derived energy since the advent of burning wood to make fire, and wood remains the largest biomass energy source today.[50][51]
However, low tech use of biomass, which still amounts for more than 10% of world energy needs may induce indoor air pollution in developing nations[52] and results in between 1.5 million and 2 million deaths in 2000.[53]
The biomass used for electricity generation varies by region.[54] Forest by-products, such as wood residues, are common in the United States.[54] Agricultural waste is common in Mauritius (sugar cane residue) and Southeast Asia (rice husks).[54] Animal husbandry residues, such as poultry litter, are common in the UK.[54] The biomass power generating industry in the United States, which consists of approximately 11,000 MW of summer operating capacity actively supplying power to the grid, produces about 1.4 percent of the U.S. electricity supply.[55]
Biofuel
[edit]
A biofuel is a type of fuel whose energy is derived from biological carbon fixation. Biofuels include fuels derived from biomass conversion, as well as solid biomass, liquid fuels and various biogases.[56]
Bioethanol is an alcohol made by fermentation, mostly from carbohydrates produced in sugar or starch crops such as corn, sugarcane or switchgrass.
Biodiesel is made from vegetable oils and animal fats. Biodiesel is produced from oils or fats using transesterification and is the most common biofuel in Europe.
Biogas is methane produced by the process of anaerobic digestion of organic material by anaerobes.,[57] etc. is also a renewable source of energy.
Biogas
[edit]Biogas typically refers to a mixture of gases produced by the breakdown of organic matter in the absence of oxygen. Biogas is produced by anaerobic digestion with anaerobic bacteria or fermentation of biodegradable materials such as manure, sewage, municipal waste, green waste, plant material, and crops.[58] It is primarily methane (CH
4) and carbon dioxide (CO2) and may have small amounts of hydrogen sulphide (H
2S), moisture and siloxanes.
Natural fibre
[edit]Natural fibres are a class of hair-like materials that are continuous filaments or are in discrete elongated pieces, similar to pieces of thread. They can be used as a component of composite materials. They can also be matted into sheets to make products such as paper or felt. Fibres are of two types: natural fibre which consists of animal and plant fibres, and man made fibre which consists of synthetic fibres and regenerated fibres.
Threats to renewable resources
[edit]Renewable resources are endangered by non-regulated industrial developments and growth.[59] They must be carefully managed to avoid exceeding the natural world's capacity to replenish them.[60] A life cycle assessment provides a systematic means of evaluating renewability. This is a matter of sustainability in the natural environment.[61]
Overfishing
[edit]
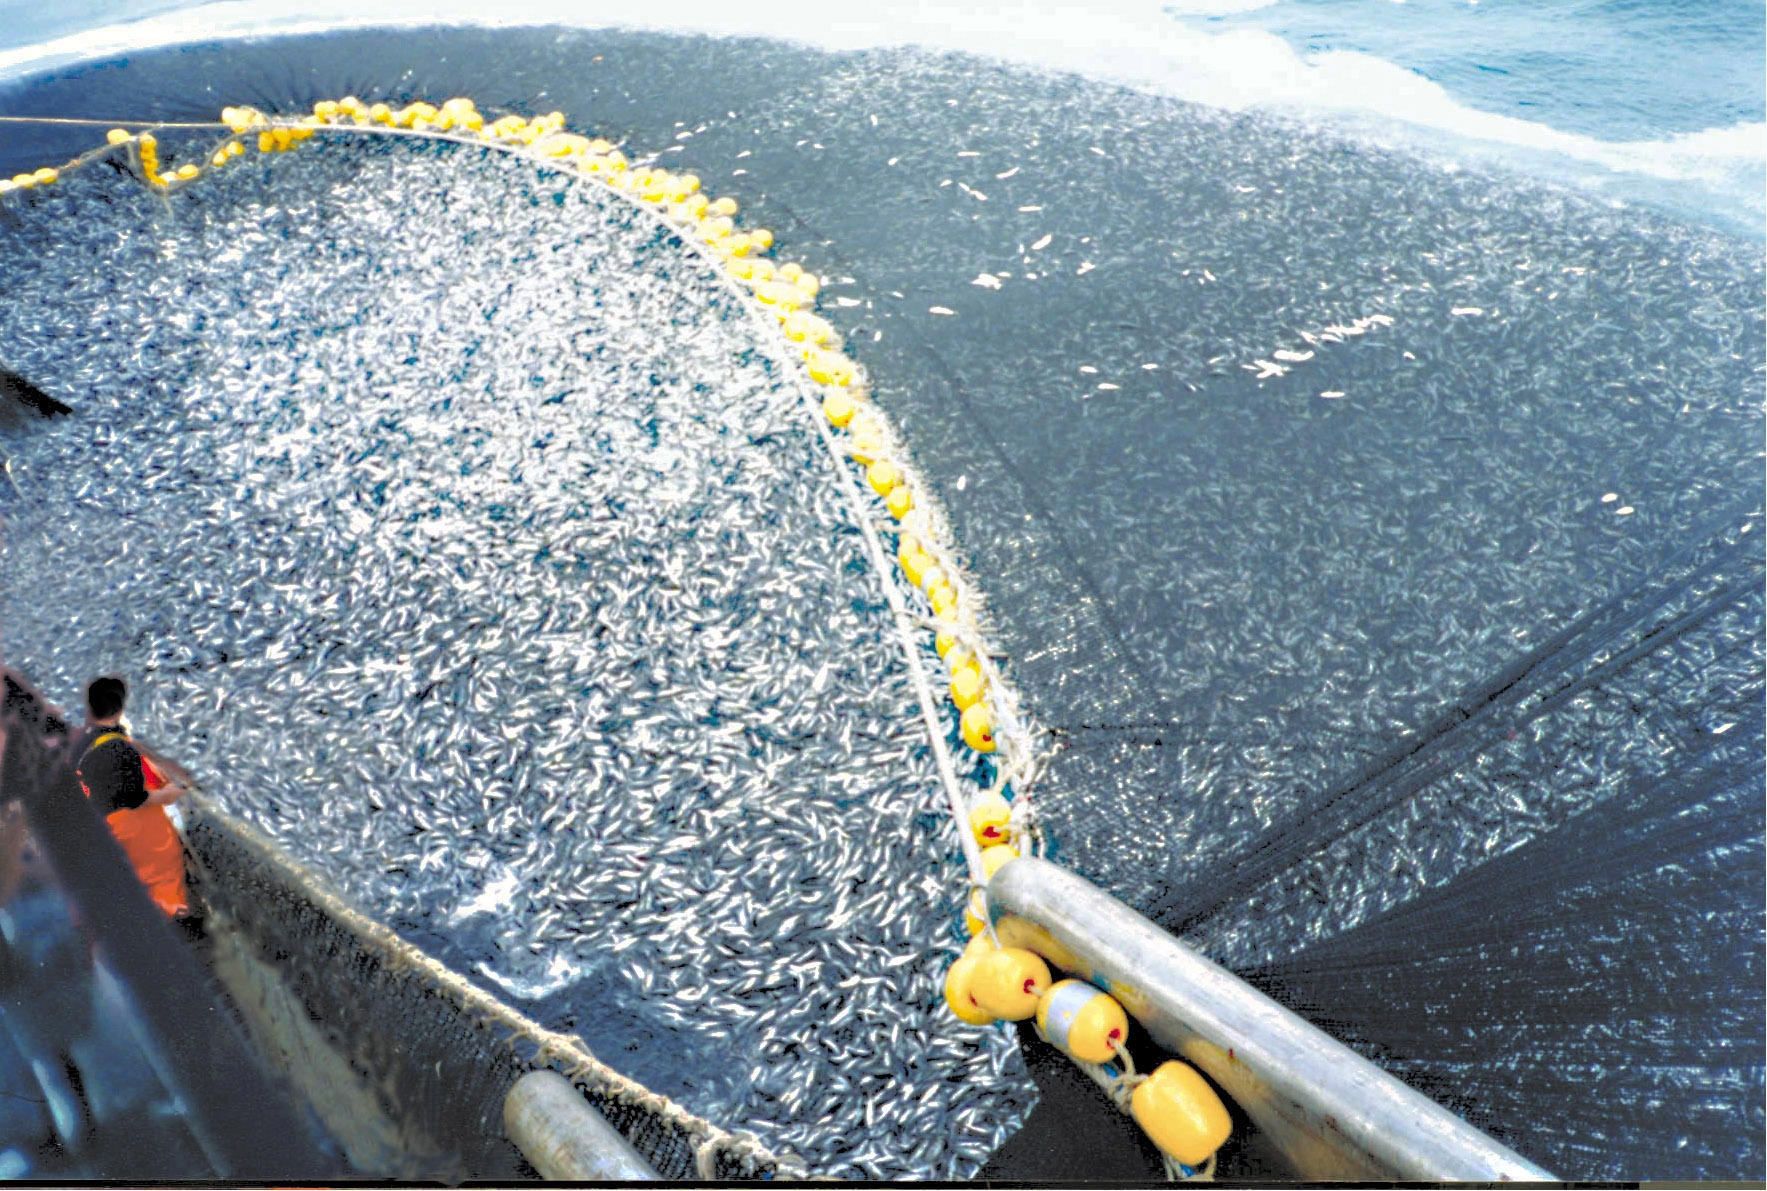
National Geographic has described ocean over fishing as "simply the taking of wildlife from the sea at rates too high for fished species to replace themselves."[62]
Tuna meat is driving overfishing as to endanger some species like the bluefin tuna. The European Community and other organisations are trying to regulate fishery as to protect species and to prevent their extinctions.[63] The United Nations Convention on the Law of the Sea treaty deals with aspects of overfishing in articles 61, 62, and 65.[64]
Examples of overfishing exist in areas such as the North Sea of Europe, the Grand Banks of North America and the East China Sea of Asia.[65]
The decline of penguin population is caused in part by overfishing, caused by human competition over the same renewable resources[66]

Deforestation
[edit]Besides their role as a resource for fuel and building material, trees protect the environment by absorbing carbon dioxide and by creating oxygen.[67] The destruction of rain forests is one of the critical causes of climate change. Deforestation causes carbon dioxide to linger in the atmosphere. As carbon dioxide accrues, it produces a layer in the atmosphere that traps radiation from the sun. The radiation converts to heat which causes global warming, which is better known as the greenhouse effect.[68]
Deforestation also affects the water cycle. It reduces the content of water in the soil and groundwater as well as atmospheric moisture.[69] Deforestation reduces soil cohesion, so that erosion, flooding and landslides ensue.[70][71]
Rain forests house many species and organisms providing people with food and other commodities. In this way biofuels may well be unsustainable if their production contributes to deforestation.[72]

Endangered species
[edit]Some renewable resources, species and organisms are facing a very high risk of extinction caused by growing human population and over-consumption. It has been estimated that over 40% of all living species on Earth are at risk of going extinct.[73] Many nations have laws to protect hunted species and to restrict the practice of hunting. Other conservation methods include restricting land development or creating preserves. The IUCN Red List of Threatened Species is the best-known worldwide conservation status listing and ranking system.[74] Internationally, 199 countries have signed an accord agreeing to create Biodiversity Action Plans to protect endangered and other threatened species.
See also
[edit]Notes
[edit]- ^ especially when emphasizing perpetual resources as well.
References
[edit]- ^ a b Park, Chris; Allaby, Michael (2017). A Dictionary of Environment and Conservation. Oxford University Press. doi:10.1093/acref/9780191826320.001.0001. ISBN 978-0-19-182632-0.
- ^ What are "Renewable Resources"?, by A. John Armstrong, Esq. & Dr. Jan Hamrin, Chapter 1, The Renewable Energy Policy Manual, Organization of American States, undated. Retrieved 2013-01-05.
- ^ Paul Weiss (1962). Renewable Resources, a report to the committee on natural resources. Washington D.C.: National Academy of Science. Archived from the original on November 5, 2013. Retrieved 2013-01-04.
- ^ "Earth's water distribution". United States Geological Survey. Retrieved 2009-05-13.
- ^ "Scientific Facts on Water: State of the Resource". GreenFacts Website. Archived from the original on 2018-07-24. Retrieved 2008-01-31.
- ^ "WBCSD Water Facts & Trends". Archived from the original on 2012-03-01. Retrieved 2009-03-12.
- ^ Lienhard, John H.; Thiel, Gregory P.; Warsinger, David M.; Banchik, Leonardo D. (2016-12-08). "Low Carbon Desalination: Status and Research, Development, and Demonstration Needs, Report of a workshop conducted at the Massachusetts Institute of Technology in association with the Global Clean Water Desalination Alliance". Prof. Lienhard Via Angie Locknar. hdl:1721.1/105755.
- ^ "food | Definition & Nutri ion". Encyclopedia Britannica.
- ^ Mammals: Carnivores. Duane E. Ullrey. Encyclopedia of Animal Science.
- ^ Rural Science Graduates Association (2002). "In Memorium — Former Staff and Students of Rural Science at UNE". University of New England. Archived from the original on 6 June 2013. Retrieved 21 October 2012.
- ^ Gold, M. (July 2009). What is Sustainable Agriculture?. United States Department of Agriculture, Alternative Farming Systems Information Center.
- ^ "FAO World Agriculture towards 2015/2030". Food and Agriculture Organization. 2003. Retrieved 2013-01-06.
- ^ Committee on 21st Century Systems Agriculture (2010). Toward Sustainable Agricultural Systems in the 21st Century. National Academies Press. ISBN 978-0-309-14896-2.
{{cite book}}: CS1 maint: numeric names: authors list (link) - ^ "Musokotwane Environment Resource Centre for Southern Africa CEP Factsheet". Archived from the original on 2013-02-13. Retrieved 2013-01-06.
- ^ "Drought: A Paleo Perspective – 20th Century Drought". National Climatic Data Center. Retrieved 2009-04-05.
- ^ Blanco, Humberto; Lal, Rattan (2010). "Tillage erosion". Principles of Soil Conservation and Management. Springer. ISBN 978-90-481-8529-0.
- ^ Lobb, D.A. (2009). "Soil movement by tillage and other agricultural activities". In Jorgenson, Sven E. (ed.). Applications in Ecological Engineering. Academic Press. ISBN 978-0-444-53448-4.
- ^ "Peak Soil: Why cellulosic ethanol, biofuels are unsustainable and a threat to America". Retrieved 2013-01-05.
- ^ "CopperWiki Soil erosion". Archived from the original on 2013-02-17. Retrieved 2013-01-05.
- ^ Vaidya, Shrijana; Hoffmann, Mathias; Holz, Maire; Macagga, Reena; Monzon, Oscar; Thalmann, Mogens; Jurisch, Nicole; Pehle, Natalia; Verch, Gernot; Sommer, Michael; Augustin, Jürgen (2023-01-01). "Similar strong impact of N fertilizer form and soil erosion state on N2O emissions from croplands". Geoderma. 429 116243. Bibcode:2023Geode.42916243V. doi:10.1016/j.geoderma.2022.116243. ISSN 0016-7061.
- ^ Cordell; et al. (2009-02-11). "The story of phosphorus: Global food security and food for thought". Global Environmental Change. 19 (2): 292–305. Bibcode:2009GEC....19..292C. doi:10.1016/j.gloenvcha.2008.10.009.
- ^ "UNECE Homepage". www.unece.org.
- ^ "FAO Factsheet" (PDF).
- ^ a b Wood The fuel of the future Environmental lunacy in Europe, Economist title story Apr 6th 2013
- ^ a b c d Nature and Power: A Global History of the Environment. By Joachim Radkau. Publications of the German Historical Institute Series. New York: Cambridge University Press, 2008
- ^ A short history of livestock production, J. Hartung, in Livestock housing, Modern management to ensure optimal health and welfare of farm animals, edited by: Andres Aland and Thomas Banhazi, © 2013 ISBN 978-90-8686-217-7
- ^ Gustav Comberg, Die deutsche Tierzucht im 19. und 20. Jahrhundert, Ulmer, 1984, ISBN 3-8001-3061-0, (History of livestock breeding in Germany)
- ^ Veröffentlichungen des Max-Planck-Instituts für Geschichte. 2, Band 0, Max-Planck-Institut für Geschichte, Reiner Prass, Vandenhoeck & Ruprecht, 1958, p. 58
- ^ a b Lesch, John E. (2000). The German Chemical Industry in the Twentieth Century. Springer Science & Business Media. p. 219.
- ^ "Rhino horn: All myth, no medicine", National Geographic, Rhishja Larson
- ^ Facts about traditional Chinese medicine (TCM): rhinoceros horn, Encyclopædia Britannica, Facts about traditional Chinese medicine (TCM): rhinoceros horn, as discussed in rhinoceros (mammal): – Britannica Online Encyclopedia
- ^ Aftalion, Fred; Benfey, Otto Theodor (1991). A History of the International Chemical Industry. Philadelphia: University of Pennsylvania Press. p. 104. ISBN 978-0-8122-8207-8.
- ^ Chandler, Alfred DuPont (2004). Scale and Scope: The Dynamics of Industrial Capitalism. Belknap Press of Harvard University Press. p. 475. ISBN 978-0-674-78995-1.
- ^ a b c d Autarkie und Ostexpansion: Pflanzenzucht und Agrarforschung im Nationalsozialismus, (agrarian research during the NS regime) Susanne Heim, Wallstein, 2002, ISBN 3-89244-496-X
- ^ Heim, Susanne (2002). Autarkie und Ostexpansion: Pflanzenzucht und Agrarforschung im Nationalsozialismus, (agrarian research during the NS regime). Wallstein. ISBN 978-3-89244-496-1.
- ^ "Making Rubber from Dandelion Juice". sciencedaily.com. Retrieved 22 November 2013.
- ^ a b Nikolau, Basil J.; Perera, M. Ann D.N.; Brachova, Libuse; Shanks, Brent (2008-05-01). "Platform biochemicals for a biorenewable chemical industry". The Plant Journal. 54 (4): 536–545. doi:10.1111/j.1365-313X.2008.03484.x. ISSN 1365-313X. PMID 18476861.
- ^ Garg, Shivani; Rizhsky, Ludmila; Jin, Huanan; Yu, Xiaochen; Jing, Fuyuan; Yandeau-Nelson, Marna D.; Nikolau, Basil J. (2016). "Microbial production of bi-functional molecules by diversification of the fatty acid pathway". Metabolic Engineering. 35: 9–20. doi:10.1016/j.ymben.2016.01.003. PMID 26827988.
- ^ Leber, Christopher; Da Silva, Nancy A. (2014-02-01). "Engineering of Saccharomyces cerevisiae for the synthesis of short chain fatty acids". Biotechnology and Bioengineering. 111 (2): 347–358. doi:10.1002/bit.25021. ISSN 1097-0290. PMID 23928901. S2CID 8117248.
- ^ Malani, Ritesh S.; Malshe, Vinod C.; Thorat, Bhaskar Narayan (2022-01-01). "Polyols and polyurethanes from renewable sources: past, present and future—part 1: vegetable oils and lignocellulosic biomass". Journal of Coatings Technology and Research. 19 (1): 201–222. doi:10.1007/s11998-021-00490-0. ISSN 1935-3804. S2CID 235442129.
- ^ "Development of a pea starch film with trigger biodegradation properties for agricultural applications". CORDIS services. 2008-11-30. Retrieved 2009-11-24.
- ^ Hong Chua; Peter H. F. Yu; Chee K. Ma (March 1999). "Accumulation of biopolymers in activated sludge biomass". Applied Biochemistry and Biotechnology. 78 (1–3): 389–399. doi:10.1385/ABAB:78:1-3:389. ISSN 0273-2289. PMID 15304709. S2CID 189905491.
- ^ NNFCC Renewable Polymers Factsheet: Bioplastics — NNFCC Archived 2019-05-22 at the Wayback Machine. Nnfcc.co.uk (2010-02-19). Retrieved on 2011-08-14.
- ^ "FYI charts". Plastics News. Archived from the original on 2008-05-13. Retrieved 2011-08-14.
- ^ "Colas S.A.: Information and Much More from". Answers.com. Retrieved 2010-06-07.
- ^ COLAS CST - Végécol Archived October 12, 2007, at the Wayback Machine
- ^ "The myth of renewable energy | Bulletin of the Atomic Scientists". Thebulletin.org. 2011-11-22. Archived from the original on 2013-10-07. Retrieved 2013-10-03.
- ^ REN21 (2010). Renewables Global Status Report Archived 2017-05-25 at the Wayback Machine p. 15.
- ^ "Benefits of Renewable Energy Use". Union of Concerned Scientists. 1999. Archived from the original on 2012-03-25. Retrieved 2013-01-04.
- ^ Scheck, Justin; Dugan, Ianthe Jeanne. "Wood-Fired Plants Generate Violations". WSJ. Retrieved 2012-04-12.
- ^ Global biomass fuel resources, Matti Parikka, in Biomass and Bioenergy, Volume 27, Issue 6, December 2004, Pages 613–620, Pellets 2002. The first world conference on pellets
- ^ Duflo E, Greenstone M, Hanna R (2008). "Indoor air pollution, health and economic well-being". S.A.P.I.EN.S. 1 (1).
- ^ Ezzati M, Kammen DM (November 2002). "The health impacts of exposure to indoor air pollution from solid fuels in developing countries: knowledge, gaps, and data needs". Environ. Health Perspect. 110 (11): 1057–68. Bibcode:2002EnvHP.110.1057E. doi:10.1289/ehp.021101057. PMC 1241060. PMID 12417475.
- ^ a b c d Frauke Urban and Tom Mitchell 2011. Climate change, disasters and electricity generation Archived 2012-09-20 at the Wayback Machine. London: Overseas Development Institute and Institute of Development Studies
- ^ "U.S. Electric Net Summer Capacity". U.S. Energy Information Administration. July 2009. Archived from the original on 2010-01-10. Retrieved 2010-01-25.
- ^ B.N. Divakara; H.D. Upadhyaya; S.P. Wani; C.L. Laxmipathi Gowda (2010). "Biology and genetic improvement of Jatropha curcas L.: A review" (PDF). Applied Energy. 87 (3): 732–742. Bibcode:2010ApEn...87..732D. doi:10.1016/j.apenergy.2009.07.013.
- ^ Redman, G., The Andersons Centre. "Assessment of on-farm AD in the UK" Archived 2010-11-13 at the Wayback Machine, National Non-Food Crops Centre, 2008-06-09. Retrieved on 2009-05-11.
- ^ National Non-Food Crops Centre. "NNFCC Renewable Fuels and Energy Factsheet: Anaerobic Digestion" Archived 2018-07-10 at the Wayback Machine, Retrieved on 2011-02-16
- ^ "Capitalizing on Environmental Injustice: The Polluter-Industrial Complex in the Age of Globalization", by Daniel Faber, Rowman & Littlefield Publishers, 17 Jul 2008
- ^ "Management for a Small Planet" by Jean Garner Stead and W. Edward Stead, M.E. Sharpe 2009
- ^ "Environmental Science: Creating a Sustainable Future" by Daniel D. Chiras, Jones & Bartlett Learning, 21 Dec 2004
- ^ "Overfishing". National Geographic. Retrieved 2013-01-06.
- ^ COUNCIL REGULATION (EC) No 2371/2002 of 20 December 2002 on the conservation and sustainable exploitation of fisheries resources under the Common Fisheries Policy. Retrieved 2013-01-05.
- ^ "Text of the United Nations Convention on the Law of the Sea: Part V". Retrieved 2012-05-01.
- ^ Lu Hui, ed. (16 August 2006). "Pollution, overfishing destroy East China Sea fishery". Xinhua on GOV.cn. Archived from the original on 2012-02-24. Retrieved 2012-05-01.
- ^ "Most Penguin Populations Continue to Decline, Biologists Warn". Science News. Science Daily. Sep 9, 2010. Retrieved 2013-01-05.
- ^ How Much Oxygen Does One Tree Produce? Archived 2012-11-15 at the Wayback Machine By Anne Marie Helmenstine, Ph.D., About.com Guide
- ^ Mumoki, Fiona. "The Effects of Deforestation on our Environment Today." Panorama. TakingITGlobal. 18 July 2006. Web. 24 March 2012.
- ^ "Underlying Causes of Deforestation". UN Secretary-General's Report. Archived from the original on 2001-04-11.
- ^ Daniel Rogge. "Deforestation and Landslides in Southwestern Washington". University of Wisconsin-Eau Claire. Archived from the original on 2012-08-05.
- ^ "China's floods: Is deforestation to blame?". BBC News. August 6, 1999. Retrieved 2013-01-05.
- ^ Assessing biofuels: towards sustainable production and use of resources, International Resource Panel, United Nations Environment Programme, 2009, retrieved 2013-01-05
- ^ "Threatened Species". Conservation and Wildlife. Archived from the original on 25 May 2017. Retrieved 2 June 2012.
- ^ "Red List Overview". IUCN. February 2011. Archived from the original on 27 May 2012. Retrieved 2 June 2012.
Further reading
[edit]- Krzeminska, Joanna, Are Support Schemes for Renewable Energies Compatible with Competition Objectives? An Assessment of National and Community Rules, Yearbook of European Environmental Law (Oxford University Press), Volume VII, Nov. 2007, p. 125
- Masters, G. M. (2004). Renewable and Efficient Electric Power Systems. Hoboken, NJ:John Wiley & Sons.
- Panwar, N. L., Kaushik, S. C., & Kothari, S. (2011, April). Role of renewable energy sources in environmental protection: A review. Renewable & Sustainable Energy Reviews, 15(3), 1513–1524.
- Sawin, Janet. "Charting a New Energy Future." State of the World 2003. By Lester R. Brown. Boston & Company, Incorporated, 2003.
| Air |
| ||||||
|---|---|---|---|---|---|---|---|
| Energy | |||||||
| Land | |||||||
| Life | |||||||
| Water |
| ||||||
| Related |
| ||||||
| Major topics | |
|---|---|
| Society and population | |
| Publications | |
| Lists | |
Events and organizations |
|
| Related topics | |
| International | |
|---|---|
| National | |
| Other | |
Renewable resource
View on GrokipediaDefinition and Principles
Core Definition and First-Principles Basis
A renewable resource is a natural resource that replenishes itself through inherent biological, physical, or chemical processes at a rate that can match or exceed human consumption under appropriate management, thereby permitting indefinite utilization without exhausting the underlying stock.[1][4] This replenishment occurs on timescales relevant to human economies and societies, typically years to decades for biological materials or continuously for energy flows such as sunlight and wind, distinguishing it from geological processes spanning millions of years.[15][16] Examples encompass timber from forests regenerating via seed dispersal and growth, freshwater from hydrological cycles, and fish stocks from population reproduction, all contingent on extraction volumes aligning with regenerative capacities.[17] The first-principles foundation of renewability rests on causal mechanisms rooted in Earth's persistent energy inputs and material cycles, where solar radiation—delivering approximately 173,000 terawatts continuously to the planet's surface—powers photosynthesis, evaporation, and atmospheric circulation, thereby sustaining biomass accumulation, water renewal, and kinetic energy in winds and tides.[4] For biological renewables, the basis lies in evolutionary adaptations favoring reproduction rates that restore populations post-harvest, as observed in managed forests where annual wood yields stabilize at 2-4% of standing volume without net loss.[17] Non-biological flows, like geothermal heat from radioactive decay and tidal forces from lunar gravitation, derive from inexhaustible planetary dynamics, with output rates fixed by physical laws rather than depletable reservoirs.[18] This inherent regenerativity contrasts with non-renewables, whose formation relies on one-time accumulations from ancient, non-recurring events, lacking viable short-term compensatory fluxes.[19] Empirical measurement of renewability hinges on comparing replenishment rates to harvest rates; for instance, sustainable forestry models equate allowable cuts to net primary productivity, typically 5-10 cubic meters per hectare annually in temperate zones, ensuring stock equilibrium.[17] Overexploitation disrupts this balance, as evidenced by cod fisheries collapsing when catches exceeded recruitment by factors of 10:1 in the North Atlantic by the 1990s, temporarily rendering the resource non-viable despite its biological renewal potential.[20] Thus, while renewability is an intrinsic property enabled by causal natural drivers, its practical endurance demands alignment with these dynamics, underscoring that infinite supply presumes finite, controlled demand.[6][9]Replenishment Dynamics and Measurement
Replenishment dynamics for renewable resources encompass the biological, ecological, and physical processes that restore depleted stocks to levels permitting sustained utilization, primarily through mechanisms like organismal reproduction, vegetative propagation, and environmental cycling. In biological systems such as fish populations and timber stands, these dynamics exhibit density-dependent growth, where replenishment accelerates at low stock levels due to reduced competition for resources but slows as stocks approach ecological carrying capacity, reflecting causal limits imposed by food availability, habitat constraints, and predation pressures. The logistic growth equation, dS/dt = rS(1 - S/K) - H, formalizes this for many renewable stocks S, with r denoting the intrinsic growth rate, K the carrying capacity, and H the harvest rate; equilibrium replenishment occurs when harvest equals natural growth, preventing depletion.[21][22] For fisheries, replenishment relies on recruitment from spawning stocks, modulated by factors including water temperature, nutrient inflows, and larval survival, with overharvesting often shifting dynamics toward collapse if extraction exceeds reproductive output. Forest replenishment, by contrast, involves radial increment in standing trees and regeneration via seeds or sprouts post-harvest, influenced by soil fertility, precipitation, and disturbance regimes like fire; managed systems may accelerate dynamics through silvicultural practices, though natural rates vary widely, e.g., temperate conifers achieving 5-10 m³/ha/year mean annual increment under optimal conditions. Hydrological renewables like groundwater aquifers replenish via infiltration from precipitation, with rates determined by aquifer permeability and recharge zones, typically measured in cubic meters per year per unit area.[23][24] Measurement of replenishment centers on estimating sustainable yield—the maximum extraction rate matching average regeneration without eroding stock viability—often via the maximum sustainable yield (MSY) concept, defined as the highest harvest maintaining constant stock indefinitely under steady environmental conditions. In logistic models, MSY equals rK/4, attained at stock levels of K/2, though empirical adjustments account for variability; for fisheries, stock assessments integrate catch-per-unit-effort data, acoustic surveys, and tagging to parameterize r and K, enabling projections of yield curves. Forest metrics derive from plot-based inventories tracking basal area growth and yield tables, with models like Faustmann's optimizing harvest rotations by discounting future timber values against growth trajectories. Challenges include parameter uncertainty and external shocks, prompting precautionary buffers below MSY to mitigate risks of overestimation, as assessments can inflate perceived sustainability by underweighting recruitment failures.[25][26][27][28]Distinction from Non-Renewable Resources
Renewable resources are characterized by their capacity to be replenished through natural processes at rates that can match or exceed human consumption under sustainable management, enabling indefinite use without exhaustion. In contrast, non-renewable resources exist in fixed, finite stocks formed over geological timescales, with replenishment rates so negligible on human timescales that extraction leads to progressive depletion and eventual scarcity.[29][30] The fundamental distinction hinges on replenishment dynamics: for renewables, ongoing geophysical or biological cycles—such as solar radiation influx at approximately 173,000 terawatts continuously to Earth or biomass regrowth via photosynthesis—provide perpetual inflows, whereas non-renewables like fossil fuels derive from ancient organic matter compressed over millions of years, with no viable natural regeneration within centuries or millennia.[16][31] Examples of renewables include wind, hydropower from precipitation cycles, and timber from forest regrowth, which can sustain yields if harvesting rates do not exceed annual increments; non-renewables encompass petroleum reserves, estimated at 1.7 trillion barrels globally as of 2023, and metallic ores like copper, whose formation requires tectonic processes spanning eons.[4][32] Even renewables risk localized depletion if extraction outpaces replenishment, as seen in overfished stocks where annual catches exceeded reproduction rates by factors of 2-3 in some fisheries during the 20th century, mimicking non-renewable exhaustion but reversible through reduced pressure. Non-renewables, however, exhibit irreversible drawdown, with global proven coal reserves projected to last 130 years at 2022 consumption rates, after which alternative sources must fully substitute. This rate-based criterion underscores causal realism: sustainability for renewables demands empirical monitoring of inflows versus outflows, while non-renewables compel substitution strategies due to zero-sum extraction.[20][33][34]Historical Evolution
Pre-Industrial Reliance on Renewables
Prior to the Industrial Revolution, human societies derived nearly all their energy from renewable sources, primarily biomass such as wood, crop residues, and animal dung for thermal applications like cooking and heating, supplemented by human and animal muscle power for mechanical labor, and limited use of wind and water for specific tasks. Traditional biomass accounted for the dominant share of primary energy supply until the mid-19th century, with per capita consumption estimated at around 6.2 gigajoules per year from wood-burning and muscle power in pre-industrial contexts spanning 1670–1850.[35][36] This reliance stemmed from the agrarian sociometabolic regime, where energy availability was constrained by land for biomass production and fodder, enabling modest societal scales but vulnerable to overuse.[37] Biomass combustion provided the bulk of thermal energy, with wood as the principal fuel in regions like Europe, where it supported household needs and early proto-industrial processes such as charcoal production for smelting. In England, for instance, heavy dependence on wood for fuel, heating, and charcoal led to widespread deforestation by the 16th and 17th centuries, prompting royal proclamations in 1558 and 1585 to conserve timber and accelerating the transition to coal as alternatives dwindled. Across Europe, anthropogenic deforestation over three millennia cleared vast areas for fuelwood alongside agriculture and pasture, reducing forest cover from over two-thirds in the Neolithic to significantly lower levels by the early modern period, highlighting the finite replenishment rates of even renewable biomass under growing demand.[38] Mechanical power came chiefly from human and draft animal labor, powered indirectly by biomass-converted food and fodder, which sustained agriculture, transport, and crafting but limited output to biological constraints. Wind and water provided supplementary kinetic energy, with watermills emerging as a key technology in medieval Europe for grinding grain, fulling cloth, and operating forges or sawmills; the Domesday survey of 1086 documented approximately 5,624 mills in England, underscoring their role in boosting productivity near rivers.[39] Windmills, originating in 9th-century Persia and proliferating in 12th-century Europe, particularly in the Netherlands for drainage and milling, contributed a minor fraction—typically a few percent—of total primary energy but enabled localized industrial precursors like factories for processing dyes, spices, and timber.[40][37] Sail power harnessed wind for maritime trade since antiquity, facilitating resource flows without depleting local stocks. These systems maintained ecological balance at low population levels but faltered with expansion, as evidenced by regional wood shortages that presaged fossil fuel adoption.[41]Fossil Fuel Displacement in the Industrial Era
Prior to the Industrial Revolution, European economies, particularly in Britain, relied heavily on biomass such as wood for heating, cooking, and early industrial processes like iron smelting and glassmaking, supplemented by animal muscle, water wheels, and windmills for mechanical power.[42] Deforestation and rising demand led to wood shortages by the 16th century, prompting an initial shift toward coal as a substitute fuel; in England, coal consumption surpassed firewood by the early 17th century, well before widespread mechanization.[43] This transition was driven by coal's greater availability in subterranean deposits, avoiding the land-use constraints of biomass regeneration, though its adoption remained limited to heating and small-scale industry until technological advancements enabled broader displacement.[37] The Industrial Revolution, commencing around 1760 in Britain, accelerated fossil fuel dominance through innovations like Abraham Darby's 1709 use of coke (derived from coal) for iron smelting and James Watt's improved steam engine in 1765-1775, which provided reliable, scalable power independent of weather-dependent renewables like water and wind. Coal-powered steam engines enabled factories, railways, and shipping to expand beyond the geographic and seasonal limits of traditional renewables, with Britain's per capita energy consumption tripling to approximately 3.5 MWh by 1860 as coal displaced wood and muscle power.[42] By 1900, coal supplied about 90% of Britain's energy needs, reflecting a causal shift toward higher energy-density fuels that supported denser urban populations and continuous production unattainable with replenishable sources constrained by solar energy inflows and land availability.[44] Globally, the displacement spread from Europe, with coal's share of world primary energy rising from negligible levels in 1800—when biomass dominated over 90% of supply—to around 73% by the early 20th century, coinciding with industrialization in North America and parts of Asia.[45] This era marked a fundamental energy regime change from organic, solar-captured renewables to mineral-based fossils, enabling unprecedented economic growth but introducing dependencies on extraction rates rather than biological replenishment cycles.[46] Water and wind power persisted in niches like milling but were marginalized as steam and later internal combustion engines, fueled by coal and emerging oil, powered expanding infrastructures.[47]Modern Revival and Policy-Driven Expansion
The 1973 Arab oil embargo and subsequent 1979 energy crisis prompted a resurgence in interest for renewable resources, primarily as alternatives to imported fossil fuels for energy security. In the United States, these events led to the establishment of the Department of Energy in 1977, which allocated funding for research into solar, wind, and biomass technologies, marking an initial policy push toward diversification beyond coal and oil dominance.[48][49] Globally, governments initiated programs to harness hydropower expansions and early photovoltaic pilots, though deployment remained limited due to high costs and technological immaturity.[47] By the 1990s and early 2000s, policy frameworks formalized the revival through mandates and incentives, accelerating renewable energy capacity beyond historical baselines. The U.S. Public Utility Regulatory Policies Act of 1978, expanded in subsequent decades, required utilities to purchase power from qualifying renewable facilities, while states like California enacted the nation's first Renewable Portfolio Standard (RPS) in 1990, mandating a percentage of electricity from renewables.[50] In Europe, the 1997 Kyoto Protocol spurred national feed-in tariffs, notably Germany's 2000 Renewable Energy Sources Act, which guaranteed above-market prices for solar and wind output, driving rapid installations despite subsidized fossil alternatives.[51] These measures extended to biological resources, with policies promoting sustainable forestry certifications under the Forest Stewardship Council (founded 1993) and biofuel mandates, such as the U.S. Renewable Fuel Standard in 2005, which required blending ethanol from biomass into gasoline.[52] The 2010s onward saw policy-driven expansion intensify, with international commitments and subsidies propelling renewables to record shares in global energy mixes. The 2015 Paris Agreement influenced national targets, leading to China's Five-Year Plans that subsidized solar manufacturing and deployment, resulting in over 50% of global capacity additions by 2020.[51] In the U.S., the 2022 Inflation Reduction Act extended and expanded production tax credits (PTC) and investment tax credits (ITC) for wind, solar, and battery storage, allocating hundreds of billions in incentives that correlated with a tripling of clean energy investments post-enactment.[53][54] For non-energy renewables, EU Common Agricultural Policy reforms since 2013 emphasized bio-based materials, while global fisheries policies under the UN's 1995 Straddling Fish Stocks Agreement aimed to rebuild overexploited stocks through quotas, though enforcement varied. This era's growth, while supported by cost declines in photovoltaics (from $4/W in 2010 to under $0.30/W by 2023), relied heavily on government interventions exceeding market signals alone, as intermittent supply necessitated grid-scale storage subsidies.[55][51]Classification and Types
Renewable Energy Sources
Renewable energy sources encompass forms of energy derived from natural processes that replenish themselves over short timescales relative to human consumption, including solar radiation, wind kinetic energy, gravitational water flow, geothermal heat, biomass combustion or conversion, and ocean currents or tides.[34] These sources differ from fossil fuels in their potential for indefinite utilization without depletion, though their output often depends on environmental conditions, leading to variability in supply.[51] In 2023, renewables generated approximately 8,200 terawatt-hours (TWh) of electricity worldwide, representing about 30% of global electricity production, with hydropower dominating at 4,275 TWh, followed by wind at 1,838 TWh and solar at 1,034 TWh.[56] Solar energy is captured primarily through photovoltaic (PV) panels that convert sunlight directly into electricity or via concentrated solar power (CSP) systems that use mirrors to focus heat for steam-driven turbines. Global solar PV capacity exceeded 1 terawatt (TW) by the end of 2023, driven by rapid cost declines of over 80% since 2010, enabling deployment in diverse climates.[57] However, solar generation is inherently intermittent, ceasing at night and varying with weather, necessitating backup systems or storage to maintain grid reliability.[34] [58] Wind energy harnesses kinetic energy from atmospheric winds using turbines onshore or offshore, with global installed capacity reaching around 900 gigawatts (GW) by 2023. Offshore wind offers higher and more consistent speeds but incurs elevated installation costs due to marine foundations.[51] Like solar, wind is variable, with output fluctuating based on wind patterns that can span days or seasons, contributing to grid integration challenges without compensatory measures such as overbuild or fossil fuel peakers.[34] [59] Hydropower utilizes the potential energy of water stored in reservoirs or flowing rivers, converted via turbines in dams or run-of-river facilities, accounting for the largest share of renewable capacity at over 1,300 GW globally in 2023. It provides dispatchable power, allowing operators to adjust output for demand, but is vulnerable to droughts and seasonal variations exacerbated by climate change.[34] [60] Large-scale projects often involve ecological trade-offs, including habitat disruption and methane emissions from reservoirs.[51] Geothermal energy extracts heat from the Earth's subsurface through wells, typically in tectonically active regions, generating steam to drive turbines with a global capacity of about 15 GW as of 2023. It offers baseload reliability, operating continuously at high capacity factors exceeding 70%, independent of weather.[34] [61] Limitations include geographic constraints and potential for induced seismicity from fluid injection.[51] Bioenergy derives from organic materials such as wood, agricultural residues, or dedicated crops, combusted directly or converted to biofuels, with installed capacity around 150 GW worldwide in 2023 and generation of 615 TWh. When sourced from sustainable forestry or waste, it can be low-carbon, but inefficient harvesting risks net emissions if it drives deforestation or competes with food production.[34] [56] Ocean energy, encompassing tidal barrages, wave converters, and ocean thermal gradients, remains nascent with under 1 GW installed globally, constrained by high upfront costs and corrosive marine environments. Tidal systems provide predictable cycles, mitigating some intermittency, but scalability is limited by suitable coastal sites.[34] [62] Overall, while renewable sources expanded by 15% in capacity during 2024 to address climate goals, their intermittency—particularly for solar and wind—demands substantial grid upgrades and storage to ensure reliable energy supply without increased fossil fuel reliance during lulls.[63] [59]Renewable Material and Biological Resources
Renewable material and biological resources comprise organic materials and living populations sourced from plants, animals, and microorganisms that regenerate through natural biological processes such as growth, reproduction, and ecological succession, enabling sustained harvesting without exhaustion. These resources contrast with non-renewable alternatives by relying on replenishment rates that, when managed appropriately, match or exceed extraction. Primary examples include timber and wood fibers from forests, natural plant fibers like hemp and cotton for textiles, and aquatic or terrestrial animal populations for proteins and byproducts.[6][3][64] Forests represent a cornerstone of renewable biological resources for materials, yielding wood for construction, paper, and furniture through cycles of planting, growth, and selective harvest. In the United States, forest inventories indicate that net annual growth surpasses removals by roughly double, with total timber volume increasing from 2.6 trillion cubic feet in 1953 to over 3.7 trillion cubic feet by 2020, reflecting effective management practices including reforestation and reduced clear-cutting. Sustainable forestry principles, such as maintaining biodiversity and soil health, underpin this renewability, though deforestation pressures in regions like the tropics—where net forest loss reached 4.7 million hectares annually from 2010-2020—highlight risks of mismanagement leading to irreversible degradation. Certification programs like those from the Forest Stewardship Council verify adherence to standards that balance yield with ecological integrity, with over 200 million hectares certified globally as of 2023.[65][66] Fisheries exemplify renewable biological resources from marine and freshwater ecosystems, where fish stocks can theoretically support perpetual harvests at levels below their reproductive capacity. The maximum sustainable yield (MSY) quantifies this threshold as the highest catch rate maintaining stock equilibrium under prevailing conditions, a concept formalized in fisheries science since the mid-20th century and incorporated into policies like the European Union's Common Fisheries Policy by 2013. In practice, achieving MSY requires precise stock assessments, quotas, and enforcement; successes include the rebound of U.S. Atlantic sea scallops, where biomass exceeded MSY targets by 2022 after restrictive measures implemented in the 1990s. Challenges persist, as overfishing has depleted 35% of assessed global stocks beyond sustainable levels per 2022 FAO data, often due to underreporting and bycatch, necessitating adaptive strategies like marine protected areas to restore productivity.[67][68] Agricultural and other plant-based biological resources provide rapidly renewing materials such as fibers, oils, and resins from crops like flax, jute, and bamboo, which exhibit growth cycles from months to years. Bamboo, for instance, regenerates from rhizomes post-harvest, supporting applications in construction and textiles with global production exceeding 30 million tons annually by 2020. These resources depend on soil fertility, water availability, and pest management for sustained yields, with polyculture systems enhancing resilience over monocultures, though intensification has caused issues like soil depletion in some regions without rotation practices. Biorenewable feedstocks from such sources enable biobased materials substituting petroleum-derived plastics, with research emphasizing closed-loop systems to minimize waste.[64][69]Extraction, Harvesting, and Conversion Processes
Methods for Energy Renewables
Solar photovoltaic (PV) systems convert sunlight directly into electricity through the photovoltaic effect, where photons excite electrons in semiconductor materials like silicon, generating direct current that is inverted to alternating current for grid use.[70] Photovoltaic modules are arranged in arrays, with efficiencies typically ranging from 15-22% for commercial panels as of 2023.[71] Concentrated solar power (CSP) methods, by contrast, use mirrors or lenses to focus sunlight onto a receiver, heating a fluid to produce steam that drives a turbine-generator, achieving thermal-to-electric efficiencies up to 20-25% in operational plants.[51] Wind energy conversion relies on horizontal-axis turbines, where aerodynamic lift on rotor blades converts wind's kinetic energy into mechanical rotation, spinning a generator via a gearbox to produce electricity; onshore turbines commonly operate at hub heights of 80-120 meters, with capacities exceeding 3 MW per unit.[72] Offshore variants employ larger rotors and floating foundations in deeper waters, capturing stronger, more consistent winds, though they require specialized installation methods like jack-up barges or tension-leg platforms.[51] Vertical-axis designs exist but are less prevalent due to lower efficiency in mainstream applications. Hydropower generation methods primarily involve impoundment systems, where dams store water in reservoirs to release flow through penstocks, impelling turbine blades—such as Francis or Kaplan types—to rotate a generator; this converts gravitational potential energy into electricity with overall efficiencies of 85-90%.[73] Run-of-river facilities divert stream flow without large reservoirs, using similar turbine-generator setups for continuous but variable output tied to natural hydrology.[74] Pumped storage hydropower acts as grid-scale energy storage, pumping water uphill during low demand and releasing it for generation during peaks, with round-trip efficiencies around 70-80%.[74] Geothermal energy extraction techniques draw on subsurface heat reservoirs, classified by plant type: dry steam plants pipe high-temperature steam directly to turbines, flash steam plants reduce pressurized hot water to vapor via pressure drops, and binary cycle plants transfer heat from geothermal fluids to a secondary working fluid with a lower boiling point for vaporization and turbine drive, enabling use of lower-temperature resources (as low as 100°C).[75] Enhanced geothermal systems (EGS) fracture hot dry rock with hydraulic stimulation to create artificial reservoirs, circulating water for heat exchange, though scalability remains limited by seismicity risks and drilling costs.[76] Biomass conversion for energy employs thermochemical processes like direct combustion, where organic matter is burned in boilers to produce steam for turbines, yielding electricity with plant efficiencies of 20-35%; gasification converts biomass to syngas via partial oxidation at high temperatures (800-1000°C), which fuels gas turbines or engines.[77] Pyrolysis heats biomass in oxygen-free environments to yield bio-oil, char, and gas for subsequent combustion or refining. Biochemical methods, such as anaerobic digestion, use microbes to break down wet biomass into biogas (primarily methane) for combustion in engines, while fermentation produces ethanol from sugars or starches via yeast, followed by distillation.[78] Co-firing biomass with coal in existing plants blends feedstocks to reduce fossil fuel dependence without full infrastructure overhaul.[79]Sustainable Harvesting for Materials
Sustainable harvesting of renewable materials involves extracting resources such as timber, cork, bamboo, and natural fibers at rates that do not exceed their natural regeneration capacity, ensuring long-term availability while preserving ecosystem functions. This approach adheres to the principle of maximum sustainable yield, defined as the highest harvest level that maintains population stability over time through balancing growth, reproduction, and removal. Empirical models demonstrate that exceeding this yield leads to resource depletion, as observed in historical overexploitation cases, whereas adherence supports perpetual supply. In forestry, sustainable practices emphasize selective logging, where only mature or defective trees are removed to promote natural regeneration and biodiversity, contrasting with clear-cutting that disrupts habitats. Forest Stewardship Council (FSC) certification, covering over 200 million hectares globally as of recent assessments, mandates monitoring of harvest yields, growth rates, and forest composition to verify regeneration. Studies confirm that FSC-certified areas maintain or increase forest cover across varied climates, with sustainable methods enhancing carbon storage by up to 30% compared to conventional logging. Reforestation and afforestation post-harvest further bolster yields, with rotation cycles tailored to species—such as 60-100 years for Douglas fir—to align with growth rates.[80][81][82] For non-timber materials, cork harvesting from Quercus suber trees exemplifies sustainability, as bark is stripped every 9-12 years without felling the tree, which can produce for over 200 years. This method yields approximately 100-200 kg of cork per tree per cycle and supports Mediterranean ecosystems by preserving habitat for species like the Iberian lynx. Bamboo, a rapidly renewable grass, is harvested at 3-5 years maturity from culms, regrowing from underground rhizomes, enabling annual yields up to 20-30 tons per hectare in managed plantations without soil depletion. Natural fibers like hemp follow annual cropping cycles, with sustainable cultivation avoiding chemical overuse to maintain soil fertility and biodiversity.[83] Challenges in implementation include enforcement of harvesting plans and verification of regeneration, particularly in regions with weak governance, where certification schemes like FSC provide third-party audits to mitigate risks of overharvesting. Data from certified operations indicate reduced deforestation rates, but global empirical evidence underscores the need for site-specific assessments to account for local ecological variables.[84][85]Applications and Industrial Utilization
Energy Production and Grid Integration
Renewable energy production primarily involves harnessing solar, wind, kinetic water flow, geothermal heat, and biomass combustion or gasification. Solar photovoltaic (PV) systems generate direct current (DC) electricity through the photovoltaic effect in semiconductor materials, which is then inverted to alternating current (AC) for use. Wind turbines capture kinetic energy from air movement via rotating blades connected to generators, producing AC electricity at variable speeds that require power conditioning. Hydropower facilities convert the potential and kinetic energy of flowing or falling water through turbines linked to generators, offering more consistent output dependent on water availability. Geothermal plants extract heat from subsurface reservoirs to drive steam turbines, while biomass systems combust organic matter or process it into syngas for electricity generation.[34][51] Capacity factors, defined as the ratio of actual output to maximum possible output over a year, vary significantly among these sources, reflecting their inherent limitations. Utility-scale solar PV achieves capacity factors of 21.4% to 34.0% based on solar resource class and location, while onshore wind typically ranges from 30% to 45%, influenced by wind speed distributions modeled via Weibull statistics. Hydropower averages 40-50% globally but can exceed 60% in run-of-river or reservoir systems with regulated flow, and geothermal often reaches 70-90% due to steady subsurface heat. These figures contrast with dispatchable fossil or nuclear plants exceeding 80-90%, underscoring renewables' lower energy density and weather dependence.[86][87] Grid integration necessitates synchronizing renewable output with the alternating current grid's frequency (typically 50 or 60 Hz) and voltage standards, often via inverters and transformers for inverter-based resources like solar and wind. These devices provide grid-forming capabilities to maintain stability, but high penetrations introduce variability, requiring advanced forecasting, demand response, and flexible reserves. Empirical data show that without sufficient dispatchable backups or storage, systems experience ramping challenges; for instance, California's "duck curve" illustrates midday solar oversupply depressing net load, followed by evening peaks demanding rapid fossil gas ramp-up. Internationally, variable renewable energy curtailment—intentional reduction of output to avoid overload—remained below 3% in many regions in early 2024, though it surged 97% year-on-year for solar in Germany due to transmission constraints and excess generation.[88][89][90] Addressing intermittency demands grid-scale battery storage, expanded transmission (e.g., high-voltage direct current lines), and overbuild strategies, yet these add costs and land use without eliminating reliance on conventional generators for baseload reliability. Studies indicate that achieving over 50% variable renewable penetration often necessitates system-wide flexibility investments equivalent to 10-20% of generation capacity, as variability scales sub-linearly but induces frequency control issues and reserve margins. In practice, regions like Texas and Europe have mitigated risks through hybrid plants combining renewables with storage or gas peakers, but full decarbonization claims overlook the causal need for overcapacity and backups, as evidenced by blackouts during low-renewable weather events (e.g., Texas 2021 freeze).[91][92][88]Bio-Based Materials and Fuels
Bio-based fuels, known as biofuels, are liquid or gaseous energy carriers produced from biomass feedstocks such as crops, agricultural residues, and forestry byproducts through biochemical or thermochemical conversion processes.[93] Primary types include bioethanol, generated via yeast fermentation of sugars from sugarcane or starchy crops like corn, and biodiesel, obtained through transesterification of vegetable oils or animal fats with methanol.[94] [95] Bioethanol yields vary by feedstock; sugarcane fermentation achieves higher efficiency due to direct sugar extraction, producing up to 8,000 liters per hectare annually in Brazil, compared to corn's 3,800 liters per hectare in the United States.[96] Biodiesel conversion typically yields 90-98% from refined oils, though feedstock variability affects output.[97] In industrial applications, biofuels serve primarily in transportation, blended with conventional gasoline (e.g., E10 or E85 ethanol mixes) or diesel to reduce emissions in internal combustion engines, and increasingly in aviation via sustainable aviation fuels (SAF).[93] Global biofuel production exceeded 160 billion liters in 2021, with demand projected to rise by 38 billion liters from 2023 to 2028, driven by policy mandates in regions like the European Union and United States.[98] [93] United States biofuel production capacity reached 24 billion gallons per year by early 2024, predominantly ethanol and biodiesel.[99] However, biofuels exhibit low energy return on investment (EROI), averaging 3.92 across feedstocks, with corn ethanol at approximately 1.04 and sugarcane ethanol at 1.80, indicating marginal net energy gains that limit scalability without subsidies.[100] [101] Bio-based materials encompass polymers, chemicals, and composites synthesized from renewable biomass, substituting petroleum-derived equivalents in packaging, textiles, and construction.[102] Bioplastics, a key subset, include starch-based polymers and polylactic acid (PLA) derived from fermented corn or sugarcane, with global production capacity at 2 million metric tons in 2023, representing under 1% of annual plastic output exceeding 390 million tons.[103] [104] These materials find industrial use in single-use packaging, agricultural films, and 3D printing filaments, leveraging biodegradability under industrial composting conditions, though performance often lags fossil plastics in durability and cost.[105] In the European Union, bio-based chemicals production hit 43 million tons in recent years, comprising 14% of organic chemical output, applied in adhesives, lubricants, and surfactants.[106] Lifecycle assessments reveal bio-based materials can lower fossil carbon dependence but require arable land diversion, potentially competing with food production and yielding higher water use than alternatives.[102]Agricultural and Non-Energy Uses
Renewable resources underpin sustainable agricultural practices, particularly through crop rotation and cover cropping, which utilize plant biomass to enhance soil health, reduce erosion, and improve nutrient cycling. Cover crops, such as legumes and grasses, are planted between main crop seasons to protect soil from wind and water erosion, increase organic matter content by up to 1-2% annually in some systems, and suppress weeds without synthetic herbicides.[107] These practices rely on the regenerative capacity of plant materials, allowing soil fertility—a key renewable resource—to be maintained over time when managed properly, as evidenced by long-term studies showing yield stability in rotated systems compared to monocultures.[108] In agricultural applications, renewable biomass-derived products include biodegradable polymers used as mulch films to conserve soil moisture, control weeds, and decompose naturally, addressing the environmental persistence of conventional polyethylene mulches. These polymers, often sourced from starch or polylactic acid from crops like corn, can degrade in soil within 3-6 months under field conditions, potentially reducing plastic waste accumulation while maintaining crop yields equivalent to non-biodegradable alternatives in vegetable production.[109] However, their adoption is limited by higher costs—up to 2-3 times that of petroleum-based films—and variable degradation rates influenced by soil microbes and climate.[110][111] Beyond direct farming inputs, renewable resources from agriculture supply non-energy materials such as natural fibers for textiles and industrial products. Cotton, a perennial shrub cultivated annually for fiber, constitutes approximately 20% of global fiber production, with over 25 million tons harvested yearly as of 2023, primarily for apparel and home textiles.[112] Hemp, another bast fiber crop, requires about one-third the land and significantly less water—around 500-1,000 mm per hectare versus 7,000-10,000 mm for cotton—while providing comparable fiber yields, positioning it as a more resource-efficient alternative in sustainable material supply chains.[113] Non-energy uses extend to forestry-derived timber and latex products, where managed renewable forests yield sawnwood and panels for construction and furniture, with global production exceeding 500 million cubic meters annually for softwood sawn timber alone in recent years. Natural rubber, harvested from Hevea brasiliensis trees on plantations that regenerate latex through tapping, supports non-energy applications like tires and seals, comprising up to 40% of tire mass by weight and drawing from an annual global output of about 13-14 million tons as of 2023.[114][115] These materials exemplify the circular potential of biological renewables, though overharvesting risks, as seen in historical fishery collapses, underscore the need for empirically validated management to ensure long-term viability.[116]Economic Realities
Cost Components and Levelized Analysis
Renewable energy resources are characterized by substantial upfront capital expenditures (CAPEX), encompassing equipment procurement, site preparation, installation, and interconnection, which can account for 70-90% of total lifetime costs, contrasted with minimal operational expenditures (OPEX) due to the absence of fuel inputs and lower maintenance needs relative to fossil fuel plants.[117] [118] For utility-scale solar photovoltaic (PV) systems, CAPEX averages approximately $1,502 per kW, including panels, inverters, and tracking structures, while onshore wind installations range from $1,489 per kW, dominated by turbine and foundation costs.[117] Offshore wind incurs higher CAPEX at $3,689 per kW owing to specialized foundations and marine logistics, and geothermal projects reach $3,963 per kW due to drilling and exploration expenses.[117] Fixed OPEX for these technologies typically spans $20-154 per kW-year, covering inspections, repairs, and insurance, with variable OPEX near zero absent fuel variability.[117] For renewable material resources such as sustainably managed forests or fisheries, cost components similarly emphasize upfront investments in propagation (e.g., planting or stocking) and ongoing management to ensure regeneration exceeds harvest rates, followed by harvesting and transport expenditures that can exceed revenues for low-volume operations.[119] In forestry, harvesting costs include labor, equipment depreciation, and logistics, often comprising 40-60% of delivered wood prices, with sustainability requiring reinvestment in replanting to maintain yield over rotation cycles of 20-80 years depending on species.[120] Fisheries analogously involve vessel operations, gear maintenance, and quota management, where overexploitation risks elevate long-term costs through stock depletion, though verifiable sustainable yields minimize this via maximum sustainable yield modeling.[121] Levelized cost analysis standardizes these components by computing the constant cost per unit output that recovers all expenses over the asset's lifetime, discounted to present value; for energy, this yields the levelized cost of energy (LCOE) as total discounted CAPEX, OPEX, and financing divided by discounted energy output, assuming fixed capacity factors and discount rates around 7-8%.[118] Unsubsidized LCOE for renewables in 2025 reflects declining CAPEX from scale and learning effects, with utility-scale solar PV at $38-78 per MWh (capacity factor 15-30%, 35-year life), onshore wind at $37-86 per MWh (30-55% capacity factor, 30-year life), and geothermal at $66-109 per MWh (80-90% capacity factor, 25-year life).[118]| Technology | Unsubsidized LCOE ($/MWh) | Key Assumptions |
|---|---|---|
| Utility-Scale Solar PV | 38–78 | 15–30% capacity factor, 35-year life |
| Onshore Wind | 37–86 | 30–55% capacity factor, 30-year life |
| Offshore Wind | 70–157 | 45–55% capacity factor, 30-year life |
| Geothermal | 66–109 | 80–90% capacity factor, 25-year life |
| Gas Combined Cycle | 48–109 | 30–90% capacity factor, 30-year life |
Subsidies, Incentives, and Market Interventions
Governments worldwide implement subsidies and incentives for renewable resources to accelerate adoption, often through tax credits, direct payments, and guaranteed purchase prices, aiming to offset higher upfront costs and risks associated with intermittency in energy sources or sustainability challenges in biological harvesting. In the energy sector, G20 countries provided at least USD 168 billion in public financial support for renewable power generation in 2023, including feed-in tariffs and renewable portfolio standards that mandate utility purchases.[125] In the United States, production tax credits and investment tax credits for wind, solar, and other renewables disbursed over USD 31 billion in 2024, with projections estimating a total taxpayer cost of USD 421 billion over the subsidy lifetimes.[126] For biological renewables like fisheries and forestry, incentives focus on sustainable practices, such as payments for ecosystem services in reforestation or gear upgrades in fishing, though global fisheries subsidies totaled USD 22-35 billion annually as of 2023, many exacerbating overcapacity rather than promoting renewal.[127] Empirical analyses indicate these measures boost short-term investment and deployment, with panel studies across European Union countries from 2000-2018 showing positive correlations between subsidy intensity and renewable capacity additions.[128] However, threshold effects emerge, where excessive subsidies beyond optimal levels diminish marginal returns on investment, as evidenced in models of renewable firm behavior in China and Europe.[129] [130] For fisheries, the World Trade Organization's 2023 Agreement on Fisheries Subsidies prohibits support for overfished stocks to curb depletion, reflecting recognition that prior incentives often fueled unsustainable harvests.[131] Market interventions via subsidies introduce distortions, favoring intermittent energy sources and leading to inefficient grid flexibility selections, such as prioritizing subsidized storage over dispatchable alternatives during congestion.[132] In Texas, federal renewable incentives have contributed to price volatility and infrastructure strain by displacing reliable baseload capacity, amplifying system costs without proportional reliability gains.[133] Long-term dependency arises, as subsidies mask underlying economic inviability; for instance, while initial EU feed-in tariffs spurred growth, phase-outs revealed sustained high levelized costs compared to unsubsidized fossils, underscoring causal links between interventions and suppressed price signals for innovation in storage or efficiency.[134] Reforms targeting harmful biological subsidies, like those in fisheries, could redirect funds toward verifiable sustainability metrics, but empirical evidence from developing contexts highlights risks of elite capture and minimal environmental uplift without rigorous monitoring.[135]Comparative Economics with Fossil Fuels
The levelized cost of electricity (LCOE) metric, which calculates the average net present cost of electricity generation over a plant's lifetime including capital, operations, maintenance, and fuel expenses divided by total energy output, indicates that unsubsidized new-build utility-scale solar photovoltaic systems had an LCOE range of $24–$96 per megawatt-hour (MWh) in 2024, while onshore wind ranged from $24–$75/MWh.[136] In comparison, unsubsidized combined-cycle natural gas plants ranged from $39–$101/MWh, and coal plants from $68–$166/MWh over the same period.[136] These figures reflect sharp declines in renewable capital costs driven by technological learning and scale, with solar LCOE falling 89% and onshore wind 70% since 2009, outpacing fossil fuel cost reductions which have been more modest due to stable combustion technologies.[136] Despite favorable generation-only LCOE for renewables in optimal conditions, the metric overlooks critical system-level differences in reliability and integration. Fossil fuel plants offer dispatchable power with capacity factors often exceeding 50–80% (e.g., natural gas at 56% and coal at 49% in U.S. projections for 2025–2030), enabling on-demand operation without weather dependence, whereas solar achieves ~25% and wind ~35–40% capacity factors, necessitating overbuilding by 2–4 times to match output.[137] Empirical analyses of high-renewable grids, such as California's, reveal elevated system costs from intermittency, including curtailment losses (e.g., 2–5% of generated solar energy wasted in 2023) and the need for fossil backups during low-renewable periods, which can comprise 20–30% of peak demand.[137] Value-adjusted LCOE (VALCOE), which incorporates generation timing against market value, further widens the gap: solar VALCOE rises to $50–$120/MWh in evening-peak scenarios due to misalignment with demand, compared to gas's flatter profile.[136]| Technology | Unsubsidized LCOE ($/MWh, 2024) | Capacity Factor (Typical) | Key Integration Challenge |
|---|---|---|---|
| Utility Solar PV | 24–96 | ~25% | Storage for non-sun hours; transmission to load centers[136][137] |
| Onshore Wind | 24–75 | ~35% | Geographic variability; backup for calm periods[136][137] |
| Gas Combined Cycle | 39–101 | ~56% | Fuel price volatility, but high dispatchability[136][137] |
| Coal | 68–166 | ~49% | High fuel and emissions compliance costs[136][137] |
Environmental Considerations
Empirical Benefits and Lifecycle Assessments
Lifecycle assessments of renewable resources, which evaluate environmental impacts from extraction or cultivation through use and disposal, consistently show net benefits in greenhouse gas emissions and resource renewal when managed sustainably, compared to non-renewable extraction. For biological renewables like forests and fisheries, empirical data indicate that harvest rates limited to annual growth increments maintain or enhance biomass stocks and ecosystem services, such as carbon sequestration and biodiversity support. In energy applications, such as biomass and solar-derived biofuels, cradle-to-grave analyses reveal emissions reductions of 80-95% relative to fossil equivalents, accounting for regrowth and manufacturing inputs.[140][141][142] Sustainable forestry practices exemplify these benefits: in North America, certified even- and uneven-aged management has resulted in rising timber inventories and carbon stocks, with net sequestration exceeding harvest removals by 10-20% annually in many regions since the 1990s, as forests absorb approximately 12-15% of U.S. anthropogenic CO₂ emissions.[143] Uneven-aged systems, which mimic natural disturbances, yield higher long-term carbon storage than clear-cutting, with lifecycle models showing reduced soil erosion and habitat fragmentation.[144] For fisheries, studies of maximum sustainable yield models confirm that extracting only surplus production stabilizes biomass at levels supporting 50-70% of unexploited stocks, as demonstrated in managed stocks like Northeast U.S. groundfish, where compliance with quotas has reversed declines and boosted yields by 20-30% over decades.[145][146] Biomass utilization from renewables further underscores lifecycle advantages: dedicated energy crops and forest residues, when harvested below growth rates, achieve carbon neutrality or negativity, with empirical assessments reporting global warming potentials 50-90% lower than coal over full cycles, including transport and combustion.[147] Marine protected areas adjacent to harvested zones amplify benefits, increasing fish biomass by 20-50% via spillover, thereby enhancing overall fishery productivity without expanding total extraction.[148] These outcomes hinge on verifiable monitoring, as overestimation in stock models can inflate perceived sustainability by 2-3 times, necessitating empirical biomass surveys for accurate assessments.[27]| Resource Type | Key Lifecycle Benefit | Empirical Metric |
|---|---|---|
| Forests | Carbon sequestration | +10-20% net stock growth in managed U.S. forests (1990s-2010s)[143] |
| Fisheries | Biomass stability | Surplus harvest maintains 50-70% of virgin biomass[145] |
| Biomass Energy | GHG reduction | 80-95% lower than fossils[141] |
Adverse Impacts and Unintended Consequences
Wind turbines have been documented to cause significant avian and bat mortality through collisions, with estimates indicating 200,000 to 1.2 million bird deaths annually in the United States, and potentially over 1 million bats killed across North America in 2023 alone.[149][150] These figures arise from direct blade strikes, particularly affecting raptors, songbirds, and migratory species, as well as bats during low-wind conditions when turbines continue operating.[151] Large-scale solar and wind installations demand substantially more land per unit of energy produced compared to fossil fuel plants, often 5 to 10 times greater, leading to habitat fragmentation and biodiversity displacement.[152] For instance, onshore wind requires dispersed spacing to capture airflow, effectively utilizing 0.3 to 1 square meter per megawatt-hour when accounting for full footprints, while utility-scale solar photovoltaic arrays occupy around 10 square meters per megawatt-hour, converting productive ecosystems into non-arable zones.[153] This expansion has prompted conflicts with agriculture and wildlife corridors, exacerbating erosion and altering local microclimates in sensitive areas. The mining of rare earth elements essential for permanent magnets in wind turbine generators and certain solar components generates substantial pollution, including toxic tailings and radioactive waste, with each ton of rare earth production yielding up to 2,000 tons of hazardous residue.[154] Operations, predominantly in China, have contaminated water sources and soils with heavy metals like neodymium and dysprosium byproducts, contributing to deforestation and ecosystem degradation in extraction regions.[155] Hydroelectric dams disrupt riverine ecosystems by impeding fish migration and promoting sediment trapping, which reduces downstream nutrient flows and alters habitats; migratory fish populations have declined by 81% since 1970, partly attributable to such fragmentation.[156] Dams like those on the Klamath River have devastated species such as Chinook salmon by blocking spawning routes and shifting river dynamics from lotic to lentic conditions.[157] Biomass energy production, when sourced from wood pellets, has accelerated deforestation in supplier regions like the southeastern United States, where exports to Europe for combustion have driven the harvest of over 6.6 million green tons of forest biomass in national forests in 2019 alone.[158] This practice undermines carbon sinks, as whole-tree harvesting for fuel releases stored carbon faster than regrowth can sequester it, contradicting sustainability claims.[159] End-of-life management of solar photovoltaic panels poses challenges, with global recycling rates estimated at only 5-10%, leaving much waste landfilled and leaching hazardous materials like cadmium and lead.[160] Projections indicate up to 88 million tons of photovoltaic waste by 2050, straining disposal systems due to economic disincentives, as recycling costs $15-45 per panel versus $1-5 for landfilling.[161][162]Technical Challenges and Limitations
Intermittency and Reliability Constraints
Renewable energy sources such as solar photovoltaic (PV) and wind power exhibit inherent intermittency due to their dependence on variable meteorological conditions, including diurnal cycles, weather patterns, and seasonal variations, which prevent consistent output matching demand.[163] This variability contrasts with dispatchable fossil fuel or nuclear plants, which can adjust production rapidly to maintain grid balance, leading to challenges in ensuring continuous supply without supplementary systems.[164] Empirical data from grid operations demonstrate that solar generation peaks midday but drops to zero at night, while wind output fluctuates unpredictably, often requiring overprovisioning of capacity to meet baseline needs—typically by factors of 2-3 times the nameplate rating for reliable equivalent firm power. Capacity factors, defined as the ratio of actual output to maximum possible output over a period, quantify this limitation: global averages for onshore wind hovered around 30-35% in recent years, while solar PV ranged from 15-25%, varying by location and technology, far below the 80-90% for natural gas combined-cycle plants.[165] [139] These low factors necessitate substantial land and material investments for equivalent energy delivery, exacerbating reliability constraints as penetration levels rise; for instance, systems with over 50% variable renewables often experience frequency and voltage instability due to reduced system inertia from displacing synchronous generators.[166] High renewable shares amplify ramping requirements, where grids must accommodate rapid changes in generation—up to 100% of peak load in hours—straining transmission and control systems.[167] Curtailment, the deliberate reduction of renewable output to prevent grid overload, underscores these issues: in California, solar curtailment affected approximately 5-10% of potential generation in 2024, declining slightly to under 8% in early 2025 due to battery integration but persisting amid overgeneration during sunny periods.[168] [169] Similarly, Germany's Energiewende policy led to wind and solar curtailment rates averaging 5-7% nationally in recent years, with peaks exceeding 10% in windy regions, often compensated via subsidies while revealing inefficiencies in matching supply to demand without expanded storage or backups.[170] These examples highlight causal linkages: intermittency drives economic waste through wasted infrastructure and reliance on fossil fuel peakers for evening ramps, as seen in the "duck curve" phenomenon where net load dips sharply midday before surging at dusk.[171] Mitigating intermittency demands grid-scale energy storage or hybrid systems, yet current lithium-ion batteries provide only hours of dispatchability at scales insufficient for seasonal gaps, with costs remaining prohibitive for full reliability—estimated at trillions globally for 100% renewable scenarios.[172] Studies indicate that without synchronous reserves, high-penetration grids (e.g., >70% renewables) face elevated blackout risks during low-resource periods, as evidenced by NERC assessments projecting adequacy shortfalls in regions like New England by 2030 absent firm capacity additions. [173] Thus, intermittency imposes fundamental constraints on renewables' role as primary sources, necessitating overbuilds, geographic diversification, or continued dependence on non-renewable balancing, which undermines claims of standalone grid reliability.[174]Scalability Barriers and Infrastructure Needs
Scaling renewable energy sources such as solar photovoltaic (PV) and wind power to meet ambitious global targets requires extensive upgrades to electrical transmission infrastructure, as renewable generation sites are often located remotely from load centers, leading to grid congestion and delays in project connections. For instance, in the United States, bulk-power grid connection queues reached over 2,000 gigawatts (GW) of proposed capacity by 2023, with renewables comprising the majority, exacerbated by insufficient high-voltage transmission lines capable of handling variable inputs.[91] The International Energy Agency (IEA) notes that grid congestion has emerged as a primary bottleneck to the energy transition, threatening energy security and affordability, with new lines needed to transport power from high-resource areas like offshore wind zones or southwestern U.S. solar deserts to urban demand hubs.[175] In Europe and North America, permitting and construction timelines for transmission projects average 5-10 years, far outpacing renewable deployment rates, resulting in curtailed generation where excess renewable output cannot be evacuated due to line limits.[176] Material supply chains present another critical scalability constraint, as transitioning to net-zero scenarios demands a multi-fold increase in mining for minerals essential to renewable technologies, including copper for wiring, rare earth elements (REEs) for wind turbine magnets, and lithium, cobalt, and nickel for batteries. The IEA projects that demand for REEs—primarily neodymium and praseodymium used in permanent magnets for offshore wind and electric vehicles—could rise sevenfold by 2040 under sustainable development pathways, straining global supplies dominated by China, which controls over 80% of processing capacity as of 2024.[177] Scaling to 80% renewable electricity globally by mid-century would require approximately 6.5 billion tonnes of materials like steel, copper, and aluminum for infrastructure alone, with supply bottlenecks already evident in 2024 delays for battery production due to lithium price volatility and geopolitical risks. These dependencies highlight causal vulnerabilities: without parallel expansion in ethical, domestic mining—currently lagging due to environmental regulations and capital costs—renewable scalability risks stalling, as evidenced by wind turbine shortages in 2023-2024 attributed to REE constraints.[178] Land acquisition poses a spatial barrier, with utility-scale solar requiring 5-7 acres per megawatt (MW) of capacity and wind-solar combinations demanding at least 10 times more land per unit of energy output than natural gas plants, including spacing for ecological buffers.[179][180] In the U.S., achieving 100% renewable electricity by 2035 under some policy scenarios would necessitate over 700,000 square kilometers of land—equivalent to 7% of the nation's total—for solar and wind alone, competing with agriculture, biodiversity, and local opposition that has delayed projects via zoning restrictions.[181] Empirical analyses of over 90% of U.S. utility-scale PV plants confirm power densities averaging 5-10 acres/MW when accounting for full footprints, underscoring the need for streamlined siting policies to avoid conversion of prime farmland or habitats, though such trade-offs remain underexplored in many net-zero models.[182] Overcoming these barriers demands coordinated investments estimated at trillions of dollars globally for grid hardening, mineral extraction infrastructure, and land-use planning, yet progress lags: the IEA's 2024 analysis shows renewable capacity growth projected at 2.7 times by 2030 still insufficient for tripling goals without accelerated transmission builds, which face regulatory and financing hurdles.[183] Reports from organizations like KPMG identify permitting delays, supply chain fragilities, and underinvestment in ancillary infrastructure—such as substations and energy storage—as systemic impediments, with data center and electrification demands amplifying the urgency for reliable scaling pathways.[184] Failure to address these empirically grounded constraints risks unattainable targets, as modeled in studies showing economic and leadership breakdowns preventing full sustainability by 2050 without fossil fuel backups.[185]Resource Depletion Paradoxes
Renewable energy technologies, while designed to mitigate the depletion of fossil fuels, introduce paradoxes in resource extraction by intensifying demand for finite critical minerals essential to their production and operation. These materials, including lithium, cobalt, nickel, graphite, copper, and rare earth elements, are non-renewable and subject to geological limits, supply chain vulnerabilities, and environmental costs from mining that can rival or exceed those of conventional energy sources. The core paradox lies in the assumption of sustainability: scaling renewables to replace hydrocarbons requires exponentially higher volumes of these minerals, potentially accelerating their depletion rates and creating new bottlenecks that undermine the long-term viability of the transition.[186][187] Demand projections underscore this tension. According to the International Energy Agency (IEA), achieving net-zero emissions by 2050 under the Announced Pledges Scenario would necessitate lithium demand increasing over 40-fold from 2020 levels, cobalt by 20-fold, and nickel by 25-fold, driven primarily by electric vehicle batteries and grid storage. Rare earth elements, vital for permanent magnets in wind turbine generators and electric motors, face similar pressures, with global demand projected to rise 3-7 times by 2040. Supply responses lag due to the 10-16 year lead times for developing new mines, regulatory hurdles, and concentrated production—China controls over 60% of rare earth processing and 80% of refined output as of 2023—exposing the system to geopolitical disruptions and price volatility.[188][189][190] These dynamics manifest in empirical shortages and economic feedbacks. Lithium prices surged over 400% from 2021 to mid-2022 amid supply constraints, delaying battery production and inflating costs for renewables deployment. While known reserves—such as 98 million tons of lithium globally—appear sufficient for decades at current extraction rates, the required ramp-up to meet transition demands could strain ore grades and environmental carrying capacities, as lower-grade deposits demand more energy and water per ton extracted. Cobalt, largely sourced from the Democratic Republic of Congo (70% of supply), exemplifies depletion risks compounded by ethical concerns, with artisanal mining contributing to ecosystem degradation and child labor, yet alternatives like sodium-ion batteries remain unscaled as of 2025.[186][191][192] The paradox extends to lifecycle resource intensity: a single onshore wind turbine requires 300 tons of steel, 4.7 tons of copper, and hundreds of kilograms of rare earths, while solar photovoltaic panels demand silver and indium, materials facing their own scarcity trajectories. Recycling rates hover below 1% for most critical minerals due to technical and economic barriers, perpetuating virgin material dependence. This creates a causal loop where aggressive renewable expansion hastens mineral exhaustion, potentially necessitating fossil fuel backups during shortages or reverting to less efficient designs, thus questioning the net depletion avoidance of the shift. Empirical models indicate that without breakthroughs in substitution or extraction efficiency, supply deficits could raise clean energy costs by 50-100% in constrained scenarios by 2030.[188][193][187]Policy, Regulation, and Global Trade
Domestic Policies and Subsidy Effects
Domestic policies promoting renewable energy resources, such as solar, wind, and biomass, typically include tax credits, production incentives, feed-in tariffs, and renewable portfolio standards that mandate a minimum share of energy from renewables. In the United States, the Inflation Reduction Act of 2022 allocated approximately $369 billion over ten years for clean energy incentives, including investment and production tax credits that have supported over 272 renewable projects with $278 billion in investments as of 2023. These measures have accelerated deployment, projecting a tripling of U.S. clean energy production and raising the renewable share in the energy mix by about 19 percentage points by 2030.[194][195][196] However, these subsidies impose substantial fiscal burdens, with estimates for the Act's energy provisions ranging from $936 billion to $1.97 trillion over the decade, potentially escalating to $2.04 trillion to $4.67 trillion when accounting for dynamic revenue effects. Empirical analyses indicate that while subsidies reduce manufacturing costs for technologies like solar panels through scale effects, they also distort markets by favoring intermittent sources, leading to inefficient resource allocation and underinvestment in dispatchable generation. For instance, econometric models show subsidies can create threshold effects where excessive support beyond optimal levels crowds out private investment and inflates system costs due to integration challenges.[197][198][132] In the European Union, subsidies have expanded to €173 billion by 2020, primarily through feed-in tariffs and guarantees of origin, driving renewable capacity growth but contributing to elevated electricity prices, with renewables exerting a positive correlation to household costs amid grid balancing needs. Retraction or retroactive cuts to these supports have reduced investment rates by 45% for photovoltaics and 16% for onshore wind, underscoring dependency and risk of stranded assets. Critics, drawing from causal analyses, argue these interventions undermine reliability by displacing baseload sources like natural gas and nuclear, exacerbating price volatility during low-renewable output periods, as evidenced by post-2022 energy crises where subsidized intermittents failed to offset fossil import dependencies.[199][200][201]| Region | Key Policy Mechanism | Deployment Impact | Cost Impact |
|---|---|---|---|
| United States (IRA 2022) | Tax credits (e.g., Sections 45Y, 48E) | Tripled clean energy output projected; 19% renewables share increase by 2030 | $936B–$1.97T over 10 years |
| European Union | Feed-in tariffs; €173B subsidies by 2020 | Capacity growth but investment drops 16–45% on subsidy cuts | Higher electricity prices correlated with renewable penetration |