
Community hub
0 subscribers8 pages, 0 posts
Recent from talks
All channels
Be the first to start a discussion here.
Be the first to start a discussion here.
Be the first to start a discussion here.
Be the first to start a discussion here.
Contribute something
Welcome to the community hub built to collect knowledge and have discussions related to Crest and trough.
Nothing was collected or created yet.
Crest and trough
View on Wikipediafrom Wikipedia
This article relies largely or entirely on a single source. (March 2024) |

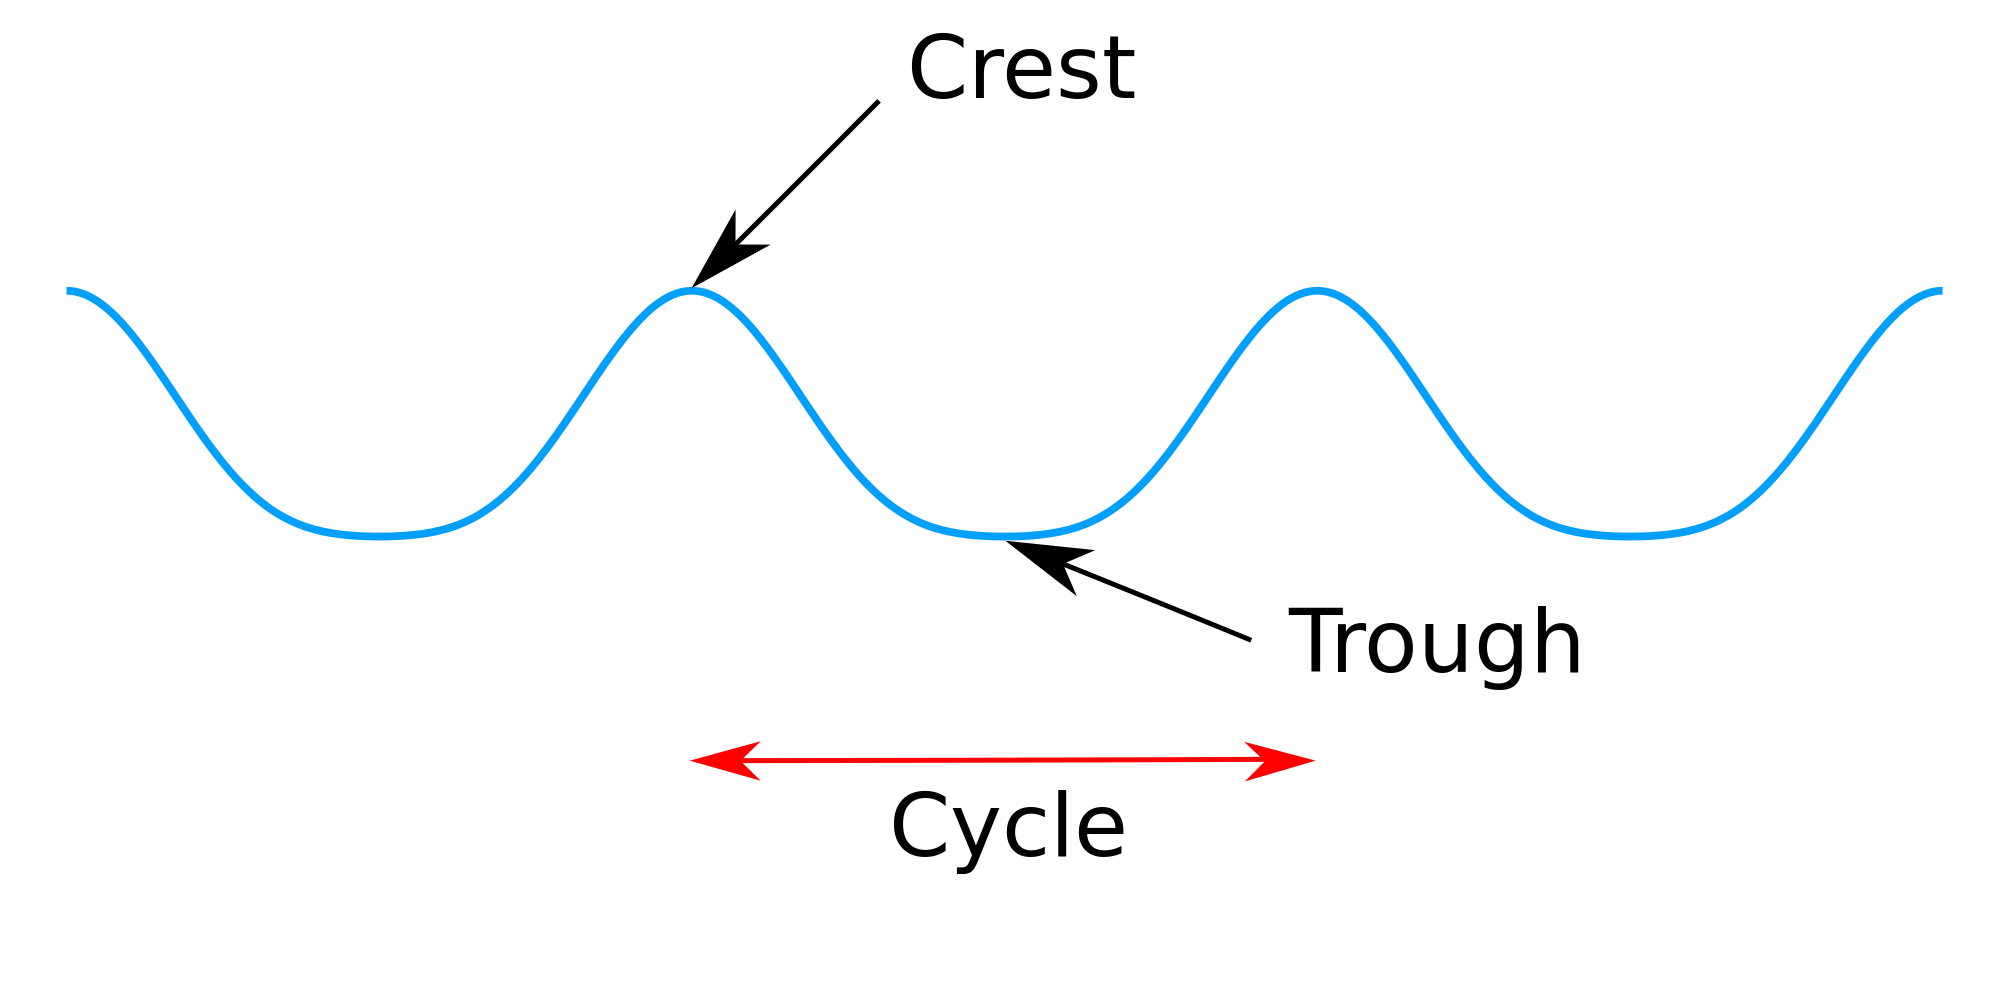
A crest point on a wave is the highest point of the wave. A crest is a point on a surface wave where the displacement of the medium is at a maximum. A trough is the opposite of a crest, so the minimum or lowest point of the wave.
When the crests and troughs of two sine waves of equal amplitude and frequency intersect or collide, while being in phase with each other, the result is called constructive interference and the magnitudes double (above and below the line). When in antiphase – 180° out of phase – the result is destructive interference: the resulting wave is the undisturbed line having zero amplitude.
See also
[edit]References
[edit]- Kinsman, Blair (1984), Wind Waves: Their Generation and Propagation on the Ocean Surface, Dover Publications, ISBN 0-486-49511-6, 704 pages.
This physics-related article is a stub. You can help Wikipedia by expanding it. |
Crest and trough
View on Grokipediafrom Grokipedia
Core definitions
Crest
In wave physics, the crest is defined as the point on a wave where the displacement of the medium from its equilibrium position reaches the maximum positive value.[5] This represents the peak of the oscillation in the wave's profile. Visually, in diagrams of transverse waves, the crest is depicted as the highest point above the equilibrium line, contrasting with the lower portions of the wave form. The crest is opposite to the trough, which marks the maximum negative displacement. For example, in a sinusoidal wave described by the equation , where is the amplitude and is the phase angle, the crest occurs at , yielding .[6]Trough
In wave physics, the trough represents the point of maximum negative displacement from the equilibrium position in a wave's oscillatory motion.[7] This occurs where the wave reaches its lowest extent relative to the rest position, contrasting with the crest, which is the corresponding point of maximum positive displacement.[8] Visually, in diagrams of transverse waves, the trough is depicted as the downward dip below the horizontal equilibrium line, forming the bottom of the wave profile.[8] This feature is evident in representations of periodic waves, where successive troughs mark the negative peaks in the oscillation pattern.[9] For a sinusoidal wave described by the equation , the trough occurs at a phase angle of , where the displacement evaluates to , achieving the negative amplitude extremum.[9]Wave applications
Transverse waves
In transverse waves, the medium's particles oscillate perpendicular to the direction of wave propagation, resulting in displacements that form alternating crests and troughs along the wave's path. A crest represents the point of maximum positive displacement, where particles reach their highest position relative to the equilibrium, while a trough is the point of maximum negative displacement, marking the lowest position. This perpendicular motion distinguishes transverse waves from other types, allowing for clear visualization of these peaks and valleys, such as in the vibration of a guitar string or the ripple of a whip.[1][10][11] A defining property of periodic transverse waves is that the distance from one crest to the adjacent crest—or equivalently, from one trough to the next—corresponds exactly to the wavelength, providing a direct measure of the spatial period of the oscillation. This crest-to-crest interval remains constant for a given wave in a uniform medium, reflecting the repetitive nature of the wave's structure as it propagates.[1][12] Water surface waves serve as a prominent example of transverse waves exhibiting crests and troughs, where the water particles move vertically while the wave advances horizontally, driven primarily by gravity for larger waves and surface tension for smaller capillary waves. In these waves, crests appear as elevated ridges where water accumulates due to the upward displacement, and troughs form as depressions where the surface dips below equilibrium, with the interplay of gravitational restoration and tensional forces maintaining the wave's form.[13][14][15] Mathematically, the displacement in a transverse wave propagating along the positive x-direction can be represented as where is the amplitude, is the wave number, and is the angular frequency. Crests occur at locations and times where the argument of the sine function equals for integer , yielding the maximum displacement of ./Book:University_Physics_I-Mechanics_Sound_Oscillations_and_Waves(OpenStax)/16:_Waves/16.03:_Mathematics_of_Waves)Longitudinal waves
In longitudinal waves, the analogous concepts to crests and troughs describe regions where the medium experiences maximum compression and maximum rarefaction, respectively; compressions represent high-density or high-pressure zones akin to crests, while rarefactions indicate low-density or low-pressure zones akin to troughs.[16][17] These features are visualized not as perpendicular displacements but as variations along the direction of wave propagation, with particle motion parallel to the travel path; they are commonly represented in graphs plotting longitudinal displacement of particles from their equilibrium positions, highlighting alternating compressed and expanded regions.[18][19] Sound waves in air provide a clear example, where propagating compressions function as crests by creating peaks in pressure and density, and rarefactions act as troughs by forming valleys of reduced pressure and density.[17][20] The pressure variation in a longitudinal sound wave is mathematically described by the equation where is the equilibrium pressure, is the pressure amplitude, is the wave number, and is the angular frequency; crests occur at points where , yielding maximum pressure.[21]Measurement and properties
Amplitude and displacement
In wave mechanics, the crest and trough represent the extrema of oscillatory displacement within a propagating medium. The crest denotes the maximum positive displacement from the equilibrium position, while the trough indicates the maximum negative displacement, marking the points of greatest deviation in the wave's oscillation.[16] This displacement refers to the temporary shift of particles or elements in the medium from their rest state, driven by the wave's energy transfer.[22] Amplitude quantifies the magnitude of this displacement and is defined as the maximum distance from the equilibrium position to either the crest or trough. Equivalently, it is half the vertical distance between the crest and trough, providing a measure of the wave's intensity or strength.[23] Mathematically, if the displacement at the crest is denoted as and at the trough as , the amplitude is given by For a sinusoidal wave, this simplifies to , where is the full wave height from trough to crest.[24] The physical significance of amplitude lies in its direct relation to the wave's energy content; a larger crest-to-trough distance corresponds to greater energy, as the total energy density in the wave is proportional to the square of the amplitude.[25] This quadratic dependence underscores how even modest increases in amplitude can substantially amplify the wave's capacity for work or disturbance in the medium, such as in sound waves or ocean swells.[26]Wavelength and period
In wave physics, the wavelength, denoted as , represents the spatial extent of one complete wave cycle and is defined as the distance between two consecutive crests or two consecutive troughs.[27][28] This measurement captures the repeating pattern of the wave's peaks and valleys along its direction of propagation.[29] The period, denoted as , is the temporal counterpart to wavelength, defined as the time required for a specific crest (or trough) to travel one full wavelength or for successive crests to pass a fixed point.[28][23] Since frequency is the number of cycles per unit time, the period relates inversely as .[30] These properties connect through the fundamental wave speed equation , where is the propagation speed, illustrating how the distance between crests scales with the rate of oscillation.[31][30] In experimental settings, wavelength is typically measured directly from crest to crest using a ruler along a line perpendicular to the wave crests, as in ripple tank or string wave demonstrations, or more precisely with interferometers for electromagnetic waves to resolve fine-scale spacing.[32][33][34] The period is determined by timing the passage of successive crests at a fixed point with a stopwatch, providing a straightforward way to quantify temporal repetition in oscillatory systems.[35] A related spatial parameter is the wave number , defined as , which quantifies the number of radians per unit distance based on the crest spacing and facilitates analysis of wave phase across space.[36][37]Broader contexts
Signal processing
In signal processing, crests and troughs denote the local maxima and minima in the amplitude-time or voltage-time plots of analog and digital signals, representing the peaks and valleys of the waveform that characterize signal variations. These features are fundamental to analyzing signal behavior, where a crest indicates the highest point of displacement from the baseline, and a trough the lowest, enabling engineers to assess dynamic range and potential distortions in applications ranging from telecommunications to biomedical monitoring.[38] Peak detection algorithms play a crucial role in identifying crests and troughs, facilitating subsequent processing steps such as Fourier transforms for frequency domain analysis or filtering to remove noise. For example, the Modified-Scholkmann algorithm, an optimized scalogram-based method, efficiently detects these extrema in periodic or quasi-periodic signals by analyzing wavelet coefficients across scales, achieving linear computational complexity and robust performance even in low signal-to-noise ratio environments like intracranial pressure waveforms. Similarly, simple time-series algorithms compute signed distances or entropy differences from neighboring points to isolate significant crests and troughs, outperforming basic thresholding in noisy data sets. These tools ensure accurate extraction of waveform features for real-time applications, with false detection rates near zero in validated physiological signals. In audio signals, crests correspond to the highest amplitude excursions, marking the loudest perceptual moments, while troughs represent the lowest amplitudes for the quietest segments, influencing overall loudness and clarity. These extrema are leveraged in compression techniques to balance dynamic range; for instance, crest factor—the ratio of peak to root-mean-square amplitude—guides adjustments to prevent clipping and optimize perceived volume, as utilized in perceptual coding schemes like MP3 encoding where peak levels inform bit allocation and masking thresholds. By quantifying the span from crests to troughs, such methods reduce file size while preserving audio fidelity, typically targeting crest factors of 10-20 dB for natural-sounding reproduction.[39][40] Mathematically, crests and troughs are located at zero-crossings of the signal's first derivative, where the slope transitions from positive to negative for a crest (local maximum) or negative to positive for a trough (local minimum), often after smoothing to mitigate noise. This derivative-based approach, implemented via finite differences or analytical computation, underpins automated detection in software like MATLAB's findpeaks function, ensuring precise identification for downstream analyses such as envelope extraction or harmonic decomposition.[38]Economic cycles
In economic contexts, crests and troughs serve as metaphors for the peaks and lows within business cycles, analogous to the periodic fluctuations observed in waves. A crest represents the peak of an economic expansion, characterized by high levels of gross domestic product (GDP) growth, low unemployment, and robust consumer and business activity, often signaling an approaching slowdown due to factors like inflationary pressures. Conversely, a trough denotes the bottom of a recessionary phase, marked by minimal economic output, elevated unemployment rates, and reduced investment, indicating the end of contraction and the onset of recovery.[41][42][43] A prominent historical example is the Great Recession triggered by the 2008 financial crisis, where the National Bureau of Economic Research (NBER) identified the business cycle peak (crest) in December 2007, followed by a severe contraction that bottomed out at a trough in June 2009. This trough reflected widespread economic distress, including a peak unemployment rate of 10% and a GDP contraction of approximately 4.3% from the prior crest. The subsequent recovery phase post-2009 led to a new expansionary crest in February 2020, followed by the brief COVID-19 recession with a trough in April 2020; as of November 2025, the expansion since April 2020 remains ongoing with no new peak announced. This demonstrates how these turning points delineate phases of boom and bust.[44][45][46][47] Business cycles are measured through turning points identified by authoritative bodies like the NBER's Business Cycle Dating Committee, which analyzes a broad array of monthly indicators such as real GDP, industrial production, employment, and real personal income, rather than relying solely on the popular two-quarter GDP decline rule. Crests are dated as the month of maximum economic activity, often associated with overheating indicators like rising inflation or capacity utilization exceeding 80%, while troughs mark the month of minimal activity, signaling the exhaustion of contractionary forces and the potential for renewed growth. This methodology ensures that cycles are captured holistically, with the average U.S. postwar expansion lasting approximately 64 months from trough to crest and contractions around 10 months from crest to trough.[48][49][50] In business cycle theory, crests and troughs are integral to models explaining economic fluctuations, including longer-term frameworks like Kondratiev waves, which describe 40- to 60-year supercycles driven by technological innovations and structural shifts. These waves feature alternating phases of prosperity (leading to crests with high growth and innovation) and depression (culminating in troughs amid stagnation), where crests often precipitate busts through mechanisms such as asset bubbles, overinvestment, and subsequent inflation-fueled corrections. Seminal work by economists like Wesley Mitchell and Arthur Burns formalized the identification of these phases, emphasizing that crests signal imbalances that resolve into troughs, perpetuating the cyclical nature of capitalist economies.[51][52]References
- https://www.coastalwiki.org/wiki/Waves