Recent from talks
Nothing was collected or created yet.
Nuclear magnetic resonance spectroscopy
View on Wikipedia
Nuclear magnetic resonance spectroscopy, most commonly known as NMR spectroscopy or magnetic resonance spectroscopy (MRS), is a spectroscopic technique based on re-orientation of atomic nuclei with non-zero nuclear spins in an external magnetic field. This re-orientation occurs with absorption of electromagnetic radiation in the radio frequency region from roughly 4 to 900 MHz, which depends on the isotopic nature of the nucleus and increases proportionally to the strength of the external magnetic field.[1] Notably, the resonance frequency of each NMR-active nucleus depends on its chemical environment. As a result, NMR spectra provide information about individual functional groups present in the sample, as well as about connections between nearby nuclei in the same molecule. As the NMR spectra are unique or highly characteristic to individual compounds and functional groups, NMR spectroscopy is one of the most important methods to identify molecular structures, particularly of organic compounds.
The principle of NMR usually involves three sequential steps:
- The alignment (polarization) of the magnetic nuclear spins in an applied, constant magnetic field B0.
- The perturbation of this alignment of the nuclear spins by a weak oscillating magnetic field, usually referred to as a radio-frequency (RF) pulse.
- Detection and analysis of the electromagnetic waves emitted by the nuclei of the sample as a result of this perturbation.
Similarly, biochemists use NMR to identify proteins and other complex molecules. Besides identification, NMR spectroscopy provides detailed information about the structure, dynamics, reaction state, and chemical environment of molecules. The most common types of NMR are proton and carbon-13 NMR spectroscopy, but it is applicable to any kind of sample that contains nuclei possessing spin.
NMR spectra are unique, well-resolved, analytically tractable and often highly predictable for small molecules. Different functional groups are obviously distinguishable, and identical functional groups with differing neighboring substituents still give distinguishable signals. NMR has largely replaced traditional wet chemistry tests such as color reagents or typical chromatography for identification.
The most significant drawback of NMR spectroscopy is its poor sensitivity (compared to other analytical methods, such as mass spectrometry). Typically 2–50 mg of a substance is required to record a decent-quality NMR spectrum. The NMR method is non-destructive, thus the substance may be recovered. To obtain high-resolution NMR spectra, solid substances are usually dissolved to make liquid solutions, although solid-state NMR spectroscopy is also possible.
The timescale of NMR is relatively long, and thus it is not suitable for observing fast phenomena, producing only an averaged spectrum. Although large amounts of impurities do show on an NMR spectrum, better methods exist for detecting impurities, as NMR is inherently not very sensitive – though at higher frequencies, sensitivity is higher.
Correlation spectroscopy is a development of ordinary NMR. In two-dimensional NMR, the emission is centered around a single frequency, and correlated resonances are observed. This allows identifying the neighboring substituents of the observed functional group, allowing unambiguous identification of the resonances. There are also more complex 3D and 4D methods and a variety of methods designed to suppress or amplify particular types of resonances. In nuclear Overhauser effect (NOE) spectroscopy, the relaxation of the resonances is observed. As NOE depends on the proximity of the nuclei, quantifying the NOE for each nucleus allows construction of a three-dimensional model of the molecule.

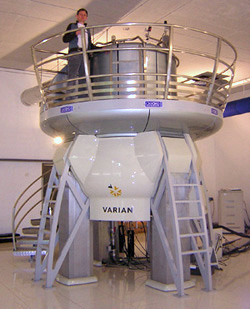
NMR spectrometers are relatively expensive; universities usually have them, but they are less common in private companies. Between 2000 and 2015, an NMR spectrometer cost around 0.5–5 million USD.[3][4] Modern NMR spectrometers have a very strong, large and expensive liquid-helium-cooled superconducting magnet, because resolution directly depends on magnetic field strength. Higher magnetic field also improves the sensitivity of the NMR spectroscopy, which depends on the population difference between the two nuclear levels, which increases exponentially with the magnetic field strength.
Less expensive machines using permanent magnets and lower resolution are also available, which still give sufficient performance for certain applications such as reaction monitoring and quick checking of samples. There are even benchtop nuclear magnetic resonance spectrometers. NMR spectra of protons (1H nuclei) can be observed even in Earth magnetic field. Low-resolution NMR produces broader peaks, which can easily overlap one another, causing issues in resolving complex structures. The use of higher-strength magnetic fields result in a better sensitivity and higher resolution of the peaks, and it is preferred for research purposes.[5]
History
[edit]Credit for the discovery of NMR goes to Isidor Isaac Rabi, who received the Nobel Prize in Physics in 1944.[6] The Purcell group at Harvard University and the Bloch group at Stanford University independently developed NMR spectroscopy in the late 1940s and early 1950s. Edward Mills Purcell and Felix Bloch shared the 1952 Nobel Prize in Physics for their inventions.[7]
NMR-active criteria
[edit]The key determinant of NMR activity in atomic nuclei is the nuclear spin quantum number (I). This intrinsic quantum property, similar to an atom's "spin", characterizes the angular momentum of the nucleus. To be NMR-active, a nucleus must have a non-zero nuclear spin (I ≠ 0).[8] It is this non-zero spin that enables nuclei to interact with external magnetic fields and show signals in NMR. Atoms with an odd sum of protons and neutrons exhibit half-integer values for the nuclear spin quantum number (I = 1/2, 3/2, 5/2, and so on). These atoms are NMR-active because they possess non-zero nuclear spin. Atoms with an even sum but both an odd number of protons and an odd number of neutrons exhibit integer nuclear spins (I = 1, 2, 3, and so on). Conversely, atoms with an even number of both protons and neutrons have a nuclear spin quantum number of zero (I = 0), and therefore are not NMR-active.[9] NMR-active nuclei, particularly those with a spin quantum number of 1/2, are of great significance in NMR spectroscopy. Examples include 1H, 13C, 15N, and 31P.[10] Some atoms with very high spin (as 9/2 for 99Tc atom) are also extensively studied with NMR spectroscopy.[11]
Main aspects of NMR techniques
[edit]Resonant frequency
[edit]When placed in a magnetic field, NMR active nuclei (such as 1H or 13C) absorb electromagnetic radiation at a frequency characteristic of the isotope.[12] The resonant frequency, energy of the radiation absorbed, and the intensity of the signal are proportional to the strength of the magnetic field. For example, in a 21-tesla magnetic field, hydrogen nuclei (protons) resonate at 900 MHz. It is common to refer to a 21 T magnet as a 900 MHz magnet, since hydrogen is the most common nucleus detected. However, different nuclei will resonate at different frequencies at this field strength in proportion to their nuclear magnetic moments.[citation needed]
Sample handling
[edit]An NMR spectrometer typically consists of a spinning sample-holder inside a very strong magnet, a radio-frequency emitter, and a receiver with a probe (an antenna assembly) that goes inside the magnet to surround the sample, optionally gradient coils for diffusion measurements, and electronics to control the system. Spinning the sample is usually necessary to average out diffusional motion, however, some experiments call for a stationary sample when solution movement is an important variable. For instance, measurements of diffusion constants (diffusion ordered spectroscopy or DOSY)[13][14] are done using a stationary sample with spinning off, and flow cells can be used for online analysis of process flows.
Deuterated solvents
[edit]The vast majority of molecules in a solution are solvent molecules, and most regular solvents are hydrocarbons and so contain NMR-active hydrogen-1 nuclei. In order to avoid having the signals from solvent hydrogen atoms overwhelm the experiment and interfere in analysis of the dissolved analyte, deuterated solvents are used where >99% of the protons are replaced with deuterium (hydrogen-2).[15] The most widely used deuterated solvent is deuterochloroform (CDCl3), although other solvents may be used for various reasons, such as solubility of a sample, desire to control hydrogen bonding, or melting or boiling points. The chemical shifts of a molecule change slightly between solvents, and therefore the solvent used is almost always reported with chemical shifts.[citation needed] Proton NMR spectra are often calibrated against the known solvent residual proton peak[16] as an internal standard instead of adding tetramethylsilane (TMS), which is conventionally defined as having a chemical shift of zero.[17]
Shim and lock
[edit]To detect the very small frequency shifts due to nuclear magnetic resonance, the applied magnetic field must be extremely uniform throughout the sample volume. High-resolution NMR spectrometers use shims to adjust the homogeneity of the magnetic field to parts per billion (ppb) in a volume of a few cubic centimeters. In order to detect and compensate for inhomogeneity and drift in the magnetic field, the spectrometer maintains a "lock" on the solvent deuterium frequency with a separate lock unit, which is essentially an additional transmitter and RF processor tuned to the lock nucleus (deuterium) rather than the nuclei of the sample of interest.[18] In modern NMR spectrometers shimming is adjusted automatically, though in some cases the operator has to optimize the shim parameters manually to obtain the best possible resolution.[18][19]
Acquisition of spectra
[edit]Upon excitation of the sample with a radio frequency (60–1000 MHz) pulse, a nuclear magnetic resonance response – a free induction decay (FID) – is obtained. It is a very weak signal and requires sensitive radio receivers to pick up. A Fourier transform is carried out to extract the frequency-domain spectrum from the raw time-domain FID. A spectrum from a single FID has a low signal-to-noise ratio, but it improves readily with averaging of repeated acquisitions. Good 1H NMR spectra can be acquired with 16 repeats, which takes only minutes. However, for elements heavier than hydrogen, the relaxation time is rather long, e.g. around 8 seconds for 13C. Thus, acquisition of quantitative heavy-element spectra can be time-consuming, taking tens of minutes to hours.[citation needed]
Following the pulse, the nuclei are, on average, excited to a certain angle vs. the spectrometer magnetic field. The extent of excitation can be controlled with the pulse width, typically about 3–8 μs for the optimal 90° pulse. The pulse width can be determined by plotting the (signed) intensity as a function of pulse width. It follows a sine curve and, accordingly, changes sign at pulse widths corresponding to 180° and 360° pulses.[citation needed]
Decay times of the excitation, typically measured in seconds, depend on the effectiveness of relaxation, which is faster for lighter nuclei and in solids, slower for heavier nuclei and in solutions, and can be very long in gases. If the second excitation pulse is sent prematurely before the relaxation is complete, the average magnetization vector has not decayed to ground state, which affects the strength of the signal in an unpredictable manner. In practice, the peak areas are then not proportional to the stoichiometry; only the presence, but not the amount of functional groups is possible to discern. An inversion recovery experiment can be done to determine the relaxation time and thus the required delay between pulses. A 180° pulse, an adjustable delay, and a 90° pulse is transmitted. When the 90° pulse exactly cancels out the signal, the delay corresponds to the time needed for 90° of relaxation.[20] Inversion recovery is worthwhile for quantitative 13C, 2D and other time-consuming experiments.
Spectral interpretation
[edit]NMR signals are ordinarily characterized by three variables: chemical shift, spin–spin coupling, and relaxation time.
Chemical shift
[edit]
The energy difference ΔE between nuclear spin states is proportional to the magnetic field (Zeeman effect). ΔE is also sensitive to the electronic environment of the nucleus, giving rise to what is known as the chemical shift, δ. The simplest types of NMR graphs are plots of the different chemical shifts of the nuclei being studied in the molecule. The value of δ is often expressed in terms of "shielding": shielded nuclei have higher ΔE. The range of δ values is called the dispersion. It is rather small for 1H signals, but much larger for other nuclei. NMR signals are reported relative to a reference signal, usually that of TMS (tetramethylsilane). Additionally, since the distribution of NMR signals is field-dependent, these frequencies are divided by the spectrometer frequency. However, since we are dividing Hz by MHz, the resulting number would be too small, and thus it is multiplied by a million. This operation therefore gives a locator number called the "chemical shift" with units of parts per million.[21] The chemical shift provides structural information.
The conversion of chemical shifts (and J's, see below) is called assigning the spectrum. For diamagnetic organic compounds, assignments of 1H and 13C NMR spectra are extremely sophisticated because of the large databases and easy computational tools. In general, chemical shifts for protons are highly predictable, since the shifts are primarily determined by shielding effects (electron density). The chemical shifts for many heavier nuclei are more strongly influenced by other factors, including excited states ("paramagnetic" contribution to shielding tensor). This paramagnetic contribution, which is unrelated to paramagnetism) not only disrupts trends in chemical shifts, which complicates assignments, but it also gives rise to very large chemical shift ranges. For example, most 1H NMR signals for most organic compounds are within 15 ppm. For 31P NMR, the range is hundreds of ppm.[22]
In paramagnetic NMR spectroscopy, the samples are paramagnetic, i.e. they contain unpaired electrons. The paramagnetism gives rise to very diverse chemical shifts. In 1H NMR spectroscopy, the chemical shift range can span up to thousands of ppm.[23]
J-coupling
[edit]| Multiplicity | Intensity ratio |
|---|---|
| Singlet (s) | 1 |
| Doublet (d) | 1:1 |
| Triplet (t) | 1:2:1 |
| Quartet (q) | 1:3:3:1 |
| Quintet | 1:4:6:4:1 |
| Sextet | 1:5:10:10:5:1 |
| Septet | 1:6:15:20:15:6:1 |
Some of the most useful information for structure determination in a one-dimensional NMR spectrum comes from J-coupling, or scalar coupling (a special case of spin–spin coupling), between NMR active nuclei. This coupling arises from the interaction of different spin states through the chemical bonds of a molecule and results in the splitting of NMR signals. For a proton, the local magnetic field is slightly different depending on whether an adjacent nucleus points towards or against the spectrometer magnetic field, which gives rise to two signals per proton instead of one. These splitting patterns can be complex or simple and, likewise, can be straightforwardly interpretable or deceptive. This coupling provides detailed insight into the connectivity of atoms in a molecule.[citation needed]
The multiplicity of the splitting is an effect of the spins of the nuclei that are coupled and the number of such nuclei involved in the coupling. Coupling to n equivalent spin-1/2 nuclei splits the signal into a n + 1 multiplet with intensity ratios following Pascal's triangle as described in the table. Coupling to additional spins leads to further splittings of each component of the multiplet, e.g. coupling to two different spin-1/2 nuclei with significantly different coupling constants leads to a doublet of doublets (abbreviation: dd). Note that coupling between nuclei that are chemically equivalent (that is, have the same chemical shift) has no effect on the NMR spectra, and couplings between nuclei that are distant (usually more than 3 bonds apart for protons in flexible molecules) are usually too small to cause observable splittings. Long-range couplings over more than three bonds can often be observed in cyclic and aromatic compounds, leading to more complex splitting patterns.[citation needed]

For example, in the proton spectrum for ethanol, the CH3 group is split into a triplet with an intensity ratio of 1:2:1 by the two neighboring CH2 protons. Similarly, the CH2 is split into a quartet with an intensity ratio of 1:3:3:1 by the three neighboring CH3 protons. In principle, the two CH2 protons would also be split again into a doublet to form a doublet of quartets by the hydroxyl proton, but intermolecular exchange of the acidic hydroxyl proton often results in a loss of coupling information.
Coupling to any spin-1/2 nuclei such as phosphorus-31 or fluorine-19 works in this fashion (although the magnitudes of the coupling constants may be very different). But the splitting patterns differ from those described above for nuclei with spin greater than 1/2 because the spin quantum number has more than two possible values. For instance, coupling to deuterium (a spin-1 nucleus) splits the signal into a 1:1:1 triplet because the spin 1 has three spin states. Similarly, a spin-3/2 nucleus such as 35Cl splits a signal into a 1:1:1:1 quartet and so on.
Coupling combined with the chemical shift (and the integration for protons) tells us not only about the chemical environment of the nuclei, but also the number of neighboring NMR active nuclei within the molecule. In more complex spectra with multiple peaks at similar chemical shifts or in spectra of nuclei other than hydrogen, coupling is often the only way to distinguish different nuclei.
The magnitude of the coupling (the coupling constant J) is an effect of how strongly the nuclei are coupled to each other. For simple cases, this is an effect of the bonding distance between the nuclei, the magnetic moment of the nuclei, and the dihedral angle between them.
Second-order (or strong) coupling
[edit]
The above description assumes that the coupling constant is small in comparison with the difference in NMR frequencies between the inequivalent spins. If the shift separation decreases (or the coupling strength increases), the multiplet intensity patterns are first distorted, and then become more complex and less easily analyzed (especially if more than two spins are involved). Intensification of some peaks in a multiplet is achieved at the expense of the remainder, which sometimes almost disappear in the background noise, although the integrated area under the peaks remains constant. In most high-field NMR, however, the distortions are usually modest, and the characteristic distortions (roofing) can in fact help to identify related peaks.
Some of these patterns can be analyzed with the method published by John Pople,[24] though it has limited scope.
Second-order effects decrease as the frequency difference between multiplets increases, so that high-field (i.e. high-frequency) NMR spectra display less distortion than lower-frequency spectra. Early spectra at 60 MHz were more prone to distortion than spectra from later machines typically operating at frequencies at 200 MHz or above.
Furthermore, as in the figure to the right, J-coupling can be used to identify ortho-meta-para substitution of a ring. Ortho coupling is the strongest at 15 Hz, Meta follows with an average of 2 Hz, and finally para coupling is usually insignificant for studies.
Magnetic inequivalence
[edit]More subtle effects can occur if chemically equivalent spins (i.e., nuclei related by symmetry and so having the same NMR frequency) have different coupling relationships to external spins. Spins that are chemically equivalent but are not indistinguishable (based on their coupling relationships) are termed magnetically inequivalent. For example, the 4 H sites of 1,2-dichlorobenzene divide into two chemically equivalent pairs by symmetry, but an individual member of one of the pairs has different couplings to the spins making up the other pair.
Magnetic inequivalence can lead to highly complex spectra, which can only be analyzed by computational modeling. Such effects are more common in NMR spectra of aromatic and other non-flexible systems, while conformational averaging about C−C bonds in flexible molecules tends to equalize the couplings between protons on adjacent carbons, reducing problems with magnetic inequivalence.
Correlation spectroscopy
[edit]Correlation spectroscopy is one of several types of two-dimensional nuclear magnetic resonance (NMR) spectroscopy or 2D-NMR. This type of NMR experiment is best known by its acronym, COSY. Other types of two-dimensional NMR include J-spectroscopy, exchange spectroscopy (EXSY), Nuclear Overhauser effect spectroscopy (NOESY), total correlation spectroscopy (TOCSY), and heteronuclear correlation experiments, such as HSQC, HMQC, and HMBC. In correlation spectroscopy, emission is centered on the peak of an individual nucleus; if its magnetic field is correlated with another nucleus by through-bond (COSY, HSQC, etc.) or through-space (NOE) coupling, a response can also be detected on the frequency of the correlated nucleus. Two-dimensional NMR spectra provide more information about a molecule than one-dimensional NMR spectra and are especially useful in determining the structure of a molecule, particularly for molecules that are too complicated to work with using one-dimensional NMR. The first two-dimensional experiment, COSY, was proposed by Jean Jeener, a professor at Université Libre de Bruxelles, in 1971.[25][26] This experiment was later implemented by Walter P. Aue, Enrico Bartholdi and Richard R. Ernst, who published their work in 1976.[27]
Solid-state nuclear magnetic resonance
[edit]
A variety of physical circumstances do not allow molecules to be studied in solution, and at the same time not by other spectroscopic techniques to an atomic level, either. In solid-phase media, such as crystals, microcrystalline powders, gels, anisotropic solutions, etc., it is in particular the dipolar coupling and chemical shift anisotropy that become dominant to the behaviour of the nuclear spin systems. In conventional solution-state NMR spectroscopy, these additional interactions would lead to a significant broadening of spectral lines. A variety of techniques allows establishing high-resolution conditions, that can, at least for 13C spectra, be comparable to solution-state NMR spectra.
Two important concepts for high-resolution solid-state NMR spectroscopy are the limitation of possible molecular orientation by sample orientation, and the reduction of anisotropic nuclear magnetic interactions by sample spinning. Of the latter approach, fast spinning around the magic angle is a very prominent method, when the system comprises spin-1/2 nuclei. Spinning rates of about 20 kHz are used, which demands special equipment. A number of intermediate techniques, with samples of partial alignment or reduced mobility, is currently[when?] being used in NMR spectroscopy.[citation needed]
Applications in which solid-state NMR effects occur are often related to structure investigations on membrane proteins, protein fibrils or all kinds of polymers, and chemical analysis in inorganic chemistry, but also include "exotic" applications like the plant leaves and fuel cells. For example, Rahmani et al. studied the effect of pressure and temperature on the bicellar structures' self-assembly using deuterium NMR spectroscopy.[29] Solid-state NMR is useful also for metal structure understanding in case of X-ray amorphous metal samples (like nano-size refractory metal 99Tc) .[30] Recent studies have combined solid-state NMR with molecular dynamics simulations to resolve nanosecond-to-millisecond-scale motions in hydrated materials like amorphous calcium carbonate.[31]
Biomolecular NMR spectroscopy
[edit]Proteins
[edit]Much of the innovation within NMR spectroscopy has been within the field of protein NMR spectroscopy, an important technique in structural biology. A common goal of these investigations is to obtain high resolution 3-dimensional structures of the protein, similar to what can be achieved by X-ray crystallography. In contrast to X-ray crystallography, NMR spectroscopy is usually limited to proteins smaller than 35 kDa, although larger structures have been solved. NMR spectroscopy is often the only way to obtain high resolution information on partially or wholly intrinsically unstructured proteins. It is now a common tool for the determination of Conformation Activity Relationships where the structure before and after interaction with, for example, a drug candidate is compared to its known biochemical activity. Proteins are orders of magnitude larger than the small organic molecules discussed earlier in this article, but the basic NMR techniques and some NMR theory also applies. Because of the much higher number of atoms present in a protein molecule in comparison with a small organic compound, the basic 1D spectra become crowded with overlapping signals to an extent where direct spectral analysis becomes untenable. Therefore, multidimensional (2, 3 or 4D) experiments have been devised to deal with this problem. To facilitate these experiments, it is desirable to isotopically label the protein with 13C and 15N because the predominant naturally occurring isotope 12C is not NMR-active and the nuclear quadrupole moment of the predominant naturally occurring 14N isotope prevents high resolution information from being obtained from this nitrogen isotope. The most important method used for structure determination of proteins utilizes NOE experiments to measure distances between atoms within the molecule. Subsequently, the distances obtained are used to generate a 3D structure of the molecule by solving a distance geometry problem. NMR can also be used to obtain information on the dynamics and conformational flexibility of different regions of a protein.
Nucleic acids
[edit]Nucleic acid NMR is the use of NMR spectroscopy to obtain information about the structure and dynamics of polynucleic acids, such as DNA or RNA. As of 2003[update], nearly half of all known RNA structures had been determined by NMR spectroscopy.[32]
Nucleic acid and protein NMR spectroscopy are similar but differences exist. Nucleic acids have a smaller percentage of hydrogen atoms, which are the atoms usually observed in NMR spectroscopy, and because nucleic acid double helices are stiff and roughly linear, they do not fold back on themselves to give "long-range" correlations.[33] The types of NMR usually done with nucleic acids are 1H or proton NMR, 13C NMR, 15N NMR, and 31P NMR. Two-dimensional NMR methods are almost always used, such as correlation spectroscopy (COSY) and total coherence transfer spectroscopy (TOCSY) to detect through-bond nuclear couplings, and nuclear Overhauser effect spectroscopy (NOESY) to detect couplings between nuclei that are close to each other in space.[34]
Parameters taken from the spectrum, mainly NOESY cross-peaks and coupling constants, can be used to determine local structural features such as glycosidic bond angles, dihedral angles (using the Karplus equation), and sugar pucker conformations. For large-scale structure, these local parameters must be supplemented with other structural assumptions or models, because errors add up as the double helix is traversed, and unlike with proteins, the double helix does not have a compact interior and does not fold back upon itself. NMR is also useful for investigating nonstandard geometries such as bent helices, non-Watson–Crick basepairing, and coaxial stacking. It has been especially useful in probing the structure of natural RNA oligonucleotides, which tend to adopt complex conformations such as stem-loops and pseudoknots. NMR is also useful for probing the binding of nucleic acid molecules to other molecules, such as proteins or drugs, by seeing which resonances are shifted upon binding of the other molecule.[34]
Carbohydrates
[edit]Carbohydrate NMR spectroscopy addresses questions on the structure and conformation of carbohydrates. The analysis of carbohydrates by 1H NMR is challenging due to the limited variation in functional groups, which leads to 1H resonances concentrated in narrow bands of the NMR spectrum. In other words, there is poor spectral dispersion. The anomeric proton resonances are segregated from the others due to fact that the anomeric carbons bear two oxygen atoms. For smaller carbohydrates, the dispersion of the anomeric proton resonances facilitates the use of 1D TOCSY experiments to investigate the entire spin systems of individual carbohydrate residues.
Drug discovery
[edit]Knowledge of energy minima and rotational energy barriers of small molecules in solution can be found using NMR, e.g. looking at free ligand conformational preferences and conformational dynamics, respectively. This can be used to guide drug design hypotheses, since experimental and calculated values are comparable. For example, AstraZeneca uses NMR for its oncology research & development.[35]
High-pressure NMR spectroscopy
[edit]One of the first scientific works devoted to the use of pressure as a variable parameter in NMR experiments was the work of J. Jonas published in the journal Annual Review of Biophysics in 1994.[36] The use of high pressures in NMR spectroscopy was primarily driven by the desire to study biochemical systems, where the use of high pressure allows controlled changes in intermolecular interactions without significant perturbations.
Of course, attempts have been made to solve scientific problems using high-pressure NMR spectroscopy. However, most of them were difficult to reproduce due to the problem of equipment for creating and maintaining high pressure. In [37][38][39] the most common types of NMR cells for realization of high-pressure NMR experiments are given.[clarification needed]
High-pressure NMR spectroscopy has been widely used for a variety of applications, mainly related to the characterization of the structure of protein molecules.[40][41] However, in recent years, software and design solutions have been proposed to characterize the chemical and spatial structures of small molecules in a supercritical fluid environment,[42] using state parameters as a driving force for such changes.[43]
See also
[edit]- Earth's field NMR
- In vivo magnetic resonance spectroscopy
- Functional magnetic resonance spectroscopy of the brain
- Low field NMR
- Magnetic Resonance Imaging
- NMR crystallography
- NMR spectra database
- NMR spectroscopy of stereoisomers
- Nuclear quadrupole resonance
- Pulsed field magnet
- Proton-enhanced nuclear induction spectroscopy
- Triple-resonance nuclear magnetic resonance spectroscopy
- Zero field NMR
- Nuclear magnetic resonance decoupling
Related methods of nuclear spectroscopy:
References
[edit]- ^ Charles P. Slichter (1963). Principles of magnetic resonance: with examples from solid state physics. Harper & Row. ISBN 978-3-540-08476-1.
{{cite book}}: ISBN / Date incompatibility (help) - ^ Structural biology: practical NMR applications (PDF) (2nd ed.). Springer. 6 September 2012. p. 67. ISBN 978-1-4614-3964-6. Retrieved 7 December 2018.
- ^ Marc S. Reisch (June 29, 2015). "NMR Instrument Price Hikes Spook Users". CEN.
- ^ "Taking It Higher". The Scientist. Oct 30, 2000.
- ^ Paudler, William (1974). Nuclear Magnetic Resonance. Boston: Allyn and Bacon Chemistry Series. pp. 9–11.
- ^ "Discovery of NMR".
- ^ "Background and Theory Page of Nuclear Magnetic Resonance Facility". Mark Wainwright Analytical Centre - University of Southern Wales Sydney. 9 December 2011. Archived from the original on 27 January 2014. Retrieved 9 February 2014.
- ^ "4.7: NMR Spectroscopy". Chemistry LibreTexts. 2016-07-14. Retrieved 2023-11-25.
- ^ Balci, Metin (2005). "Dynamic NMR Spectroscopy". Basic 1H- and 13C-NMR Spectroscopy. Elsevier. pp. 213–231. doi:10.1016/b978-044451811-8.50008-5. ISBN 978-0-444-51811-8.
- ^ "NMR active nuclei for biological and biomedical applications". Open Medscience. Retrieved 2023-11-25.
- ^ Kuznetsov, Vitaly V.; Poineau, Frederic; German, Konstantin E.; Filatova, Elena A. (2024-11-11). "Pivotal role of 99Tc NMR spectroscopy in solid-state and molecular chemistry". Communications Chemistry. 7 (1): 259. Bibcode:2024CmChe...7..259K. doi:10.1038/s42004-024-01349-2. ISSN 2399-3669. PMC 11555319. PMID 39528801.
- ^ Shah, N.; Sattar, A.; Benanti, M.; Hollander, S.; Cheuck, L. (January 2006). "Magnetic resonance spectroscopy as an imaging tool for cancer: a review of the literature". The Journal of the American Osteopathic Association. 106 (1): 23–27. PMID 16428685. Archived from the original on 2013-04-07.
- ^ Johnson Jr., C. S. (1999). "Diffusion ordered nuclear magnetic resonance spectroscopy: principles and applications". Progress in Nuclear Magnetic Resonance Spectroscopy. 34 (3–4): 203–256. Bibcode:1999PNMRS..34..203J. doi:10.1016/S0079-6565(99)00003-5.
- ^ Neufeld, R.; Stalke, D. (2015). "Accurate Molecular Weight Determination of Small Molecules via DOSY-NMR by Using External Calibration Curves with Normalized Diffusion Coefficients". Chem. Sci. 6 (6): 3354–3364. doi:10.1039/C5SC00670H. PMC 5656982. PMID 29142693.
- ^ Hanson, John E. (2013). "5. NMR Spectroscopy in Nondeuterated Solvents (No-D NMR): Applications in the Undergraduate Organic Laboratory". NMR Spectroscopy in the Undergraduate Curriculum. ACS Symposium Series. Vol. 1128. American Chemical Society. pp. 69–81. doi:10.1021/bk-2013-1128.ch005. ISBN 978-0-8412-2794-1.
- ^ Gottlieb, Hugo E.; Kotlyar, Vadim; Nudelman, Abraham (1997-10-01). "NMR Chemical Shifts of Common Laboratory Solvents as Trace Impurities". The Journal of Organic Chemistry. 62 (21): 7512–7515. doi:10.1021/jo971176v. ISSN 0022-3263. PMID 11671879.
- ^ Tiers, George Van Dyke (September 1958). "Reliable Proton Nuclear Resonance Shielding Values by "Internal Referencing" with Tetramethyl-silane". The Journal of Physical Chemistry. 62 (9): 1151–1152. doi:10.1021/j150567a041. ISSN 0022-3654.
- ^ a b "The Lock". Center for NMR Spectroscopy. Washington State University. Archived from the original on 2020-01-28.
- ^ "NMR Artifacts". Max T. Rogers NMR Facility. Michigan State University. Archived from the original on 2021-09-24.
- ^ Parella, Teodor. "T1 Measurement using Inversion-Recovery". NMRGuide3.5. Archived from the original on 2021-04-28.
- ^ James Keeler. "Chapter 2: NMR and energy levels" (reprinted at University of Cambridge). Understanding NMR Spectroscopy. University of California, Irvine. Retrieved 2007-05-11.
- ^ Peter Atkins (1994) [1990]. Physical Chemistry (5 ed.). Freeman.
- ^ Ott, J. C.; Wadepohl, H.; Enders, M.; Gade, L. H. (2018). "Taking Solution Proton NMR to Its Extreme: Prediction and Detection of a Hydride Resonance in an Intermediate-Spin Iron Complex". J. Am. Chem. Soc. 140 (50): 17413–17417. Bibcode:2018JAChS.14017413O. doi:10.1021/jacs.8b11330. PMID 30486649. S2CID 207195859.
- ^ Pople, J. A.; Bernstein, H. J.; Schneider, W. G. (1957). "The Analysis of Nuclear Magnetic Resonance Spectra". Can. J. Chem. 35: 65–81. doi:10.1139/v57-143.
- ^ Aue, W. P. (1976). "Two-dimensional spectroscopy. Application to nuclear magnetic resonance". The Journal of Chemical Physics. 64 (5): 2229. Bibcode:1976JChPh..64.2229A. doi:10.1063/1.432450.
- ^ Jeener, Jean (2007). "Jeener, Jean: Reminiscences about the Early Days of 2D NMR". Encyclopedia of Magnetic Resonance. doi:10.1002/9780470034590.emrhp0087. ISBN 978-0-470-03459-0.
- ^ Martin, G.E; Zekter, A.S., Two-Dimensional NMR Methods for Establishing Molecular Connectivity; VCH Publishers, Inc: New York, 1988 (p.59)
- ^ "National Ultrahigh-Field NMR Facility for Solids". Retrieved 2014-09-22.
- ^ A. Rahmani, C. Knight, and M. R. Morrow. "Response to hydrostatic pressure of bicellar dispersions containing anionic lipid: Pressure-induced interdigitation". 2013, 29 (44), pp. 13481–13490, doi:10.1021/la4035694.
- ^ Kuznetsov, Vitaly V.; Poineau, Frederic; German, Konstantin E.; Filatova, Elena A. (2024-11-11). "Pivotal role of 99Tc NMR spectroscopy in solid-state and molecular chemistry". Communications Chemistry. 7 (1): 259. Bibcode:2024CmChe...7..259K. doi:10.1038/s42004-024-01349-2. ISSN 2399-3669. PMC 11555319. PMID 39528801.
- ^ Vinod‑Kumar; Smith‑Penzel; Redrouthu; Gindele; Gebauer; Mathies (2025). "Investigation of the structure and dynamics of amorphous calcium carbonate by NMR: stabilization by poly‑aspartate and comparison to monohydrocalcite". Physical Chemistry Chemical Physics. 27 (19): 13291–13300. Bibcode:2025PCCP...2710348V. doi:10.1039/d5cp01002k.
- ^ Fürtig, Boris; Richter, Christian; Wöhnert, Jens; Schwalbe, Harald (2003). "NMR Spectroscopy of RNA". ChemBioChem. 4 (10): 936–62. doi:10.1002/cbic.200300700. PMID 14523911. S2CID 33523981.
- ^ Addess, Kenneth J.; Feigon, Juli (1996). "Introduction to 1H NMR Spectroscopy of DNA". In Hecht, Sidney M. (ed.). Bioorganic Chemistry: Nucleic Acids. New York: Oxford University Press. ISBN 978-0-19-508467-2.
- ^ a b Wemmer, David (2000). "Chapter 5: Structure and Dynamics by NMR". In Bloomfield, Victor A.; Crothers, Donald M.; Tinoco, Ignacio (eds.). Nucleic acids: Structures, Properties, and Functions. Sausalito, California: University Science Books. ISBN 978-0-935702-49-1.
- ^ Balazs, Amber; Davies, Nichola; Longmire, David; Packer, Martin; Chiarparin, Elisabetta (2021). "NMR free ligand conformations and atomic resolution dynamics". Magnetic Resonance Discussions: 1–16. doi:10.5194/mr-2021-27. S2CID 233441183.
- ^ Jonas, J; Jonas, A (June 1994). "High-Pressure NMR Spectroscopy of Proteins and Membranes". Annual Review of Biophysics and Biomolecular Structure. 23 (1): 287–318. doi:10.1146/annurev.bb.23.060194.001443. ISSN 1056-8700. PMID 7919784.
- ^ Benedek, G. B.; Purcell, E. M. (1954-12-01). "Nuclear Magnetic Resonance in Liquids under High Pressure". The Journal of Chemical Physics. 22 (12): 2003–2012. Bibcode:1954JChPh..22.2003B. doi:10.1063/1.1739982. ISSN 0021-9606.
- ^ Kamatari, Y (September 2004). "High-pressure NMR spectroscopy for characterizing folding intermediates and denatured states of proteins". Methods. 34 (1): 133–143. doi:10.1016/j.ymeth.2004.03.010. PMID 15283922.
- ^ Peterson, Ronald W.; Wand, A. Joshua (2005-09-01). "Self-contained high-pressure cell, apparatus, and procedure for the preparation of encapsulated proteins dissolved in low viscosity fluids for nuclear magnetic resonance spectroscopy". Review of Scientific Instruments. 76 (9): 094101–094101–7. Bibcode:2005RScI...76i4101P. doi:10.1063/1.2038087. ISSN 0034-6748. PMC 1343520. PMID 16508692.
- ^ Dubois, Cécile; Herrada, Isaline; Barthe, Philippe; Roumestand, Christian (2020-11-26). "Combining High-Pressure Perturbation with NMR Spectroscopy for a Structural and Dynamical Characterization of Protein Folding Pathways". Molecules. 25 (23): 5551. doi:10.3390/molecules25235551. ISSN 1420-3049. PMC 7731413. PMID 33256081.
- ^ Gagné, Donald; Azad, Roksana; Aramini, James M.; Xu, Xingjian; Isiorho, Eta A.; Edupuganti, Uthama R.; Williams, Justin; Marcelino, Leandro Pimentel; Akasaka, Kazuyuki (2020-08-26). Use of High Pressure NMR Spectroscopy to Rapidly Identify Proteins with Internal Ligand-Binding Voids (Report). Biophysics. doi:10.1101/2020.08.25.267195.
- ^ Khodov, I.A.; Belov, K.V.; Krestyaninov, M.A.; Sobornova, V.V.; Dyshin, A.A.; Kiselev, M.G. (August 2023). "Does DMSO affect the conformational changes of drug molecules in supercritical CO2 Media?". Journal of Molecular Liquids. 384 122230. doi:10.1016/j.molliq.2023.122230.
- ^ Khodov, I.A.; Belov, K.V.; Dyshin, A.A.; Krestyaninov, M.A.; Kiselev, M.G. (December 2022). "Pressure effect on lidocaine conformational equilibria in scCO2: A study by 2D NOESY". Journal of Molecular Liquids. 367 120525. doi:10.1016/j.molliq.2022.120525.
Further reading
[edit]- John D. Roberts (1959). Nuclear Magnetic Resonance: applications to organic chemistry. McGraw-Hill Book Company. ISBN 978-1-258-81166-2.
{{cite book}}: ISBN / Date incompatibility (help) - J.A.Pople; W.G.Schneider; H.J.Bernstein (1959). High-resolution Nuclear Magnetic Resonance. McGraw-Hill Book Company.
- A. Abragam (1961). The Principles of Nuclear Magnetism. Clarendon Press. ISBN 978-0-19-852014-6.
{{cite book}}: ISBN / Date incompatibility (help) - Charles P. Slichter (1963). Principles of magnetic resonance: with examples from solid state physics. Harper & Row. ISBN 978-3-540-08476-1.
{{cite book}}: ISBN / Date incompatibility (help) - John Emsley; James Feeney; Leslie Howard Sutcliffe (1965). High Resolution Nuclear Magnetic Resonance Spectroscopy. Pergamon. ISBN 978-1-4831-8408-1.
External links
[edit]- James Keeler. "Understanding NMR Spectroscopy" (reprinted at University of Cambridge). University of California, Irvine. Retrieved 2007-05-11.
- The Basics of NMR - A non-technical overview of NMR theory, equipment, and techniques by Dr. Joseph Hornak, Professor of Chemistry at RIT
- GAMMA and PyGAMMA Libraries - GAMMA is an open source C++ library written for the simulation of Nuclear Magnetic Resonance Spectroscopy experiments. PyGAMMA is a Python wrapper around GAMMA.
- relax Software for the analysis of NMR dynamics
- Vespa - VeSPA (Versatile Simulation, Pulses and Analysis) is a free software suite composed of three Python applications. These GUI based tools are for magnetic resonance (MR) spectral simulation, RF pulse design, and spectral processing and analysis of MR data.
Nuclear magnetic resonance spectroscopy
View on GrokipediaFundamentals
Basic principles
Nuclear magnetic resonance (NMR) spectroscopy is a powerful analytical technique that exploits the intrinsic magnetic properties of certain atomic nuclei to elucidate the structure, dynamics, and chemical environments of molecules in solution or solid state. By applying an external magnetic field and radiofrequency pulses, NMR probes the local electronic environment around nuclei, yielding information on molecular connectivity, conformation, and interactions at atomic resolution. This method is particularly valued in chemistry and biology for its ability to analyze complex biomolecules non-destructively, enabling repeated measurements on the same sample without alteration.[12][13][8] The fundamental setup of an NMR experiment involves placing the sample—typically dissolved in a solvent—within a strong, homogeneous static magnetic field , often generated by superconducting magnets exceeding 10 tesla. This field partially aligns the nuclear magnetic moments, creating a net magnetization along the field direction. Short bursts of radiofrequency (RF) energy, tuned to the Larmor frequency specific to the nucleus and field strength, are then applied perpendicular to via a coil, perturbing the aligned spins and tipping the magnetization away from equilibrium. As the spins relax back to their equilibrium state, they emit RF signals that are detected by a receiver coil, producing a time-domain signal known as the free induction decay (FID), which is subsequently Fourier-transformed into a frequency spectrum for analysis.[5][12][13] The macroscopic behavior of the nuclear magnetization in NMR is described by the phenomenological Bloch equations, which model the precession around the magnetic field, transverse decay, and longitudinal recovery: Here, is the gyromagnetic ratio, is the effective magnetic field, and are the longitudinal and transverse relaxation times, respectively, and is the equilibrium magnetization. These equations, introduced without quantum mechanical derivation, provide the foundational framework for understanding signal generation and decay in NMR experiments.[14][12]NMR-active nuclei
Nuclear magnetic resonance (NMR) spectroscopy is applicable only to atomic nuclei that possess a non-zero nuclear spin quantum number , as these nuclei have an intrinsic angular momentum and associated magnetic moment that can interact with an external magnetic field to produce observable signals. Nuclei with , such as and , lack this property and are NMR-silent. Among NMR-active nuclei, those with (e.g., , , , , ) are particularly favorable because they have no electric quadrupole moment, leading to narrow spectral lines and high-resolution spectra. In contrast, nuclei with (quadrupolar nuclei, e.g., with , with , with ) possess a quadrupole moment that can interact with electric field gradients in the sample, often resulting in broadened or split signals that complicate spectral interpretation.[15] The detectability of an NMR-active nucleus depends on its natural abundance, gyromagnetic ratio (which determines the resonance frequency , where is the magnetic field strength), and intrinsic sensitivity. Receptivity, a combined measure of these factors relative to at natural abundance, quantifies practical ease of observation; higher values indicate easier detection. For instance, has near-100% natural abundance and a high , making it the most sensitive, while suffers from low abundance (about 1.07%) and lower (), reducing its receptivity by a factor of about 5700 relative to (accounting for both factors).[15][16] The following table summarizes key properties for selected common NMR-active nuclei, using values updated from CODATA 2018 and IAEA data (gyromagnetic ratios given as in MHz/T for resonance frequency at 1 T; receptivities at natural abundance relative to ; quadrupole moments in barns for ):| Nucleus | Spin | Natural Abundance (%) | (MHz/T) | Receptivity (rel. to ) | Quadrupole Moment (barn) |
|---|---|---|---|---|---|
| 1/2 | 99.9885 | 42.577 | 1.000 | - | |
| 1 | 0.0115 | 6.536 | 2.24 × 10^{-6} | +0.00286 | |
| 1/2 | 1.07 | 10.708 | 1.76 × 10^{-4} | - | |
| 1 | 99.632 | 3.076 | 1.00 × 10^{-3} | +0.020 | |
| 1/2 | 0.368 | -4.315 | 3.35 × 10^{-6} | - | |
| 5/2 | 0.038 | -5.773 | 1.06 × 10^{-5} | -0.0256 | |
| 1/2 | 100 | 40.069 | 0.834 | - | |
| 3/2 | 100 | 11.269 | 0.093 | +0.104 | |
| 1/2 | 100 | 17.241 | 0.066 | - |
Theoretical foundations
Nuclear spin and magnetic moments
Nuclear spin angular momentum is an intrinsic quantum mechanical property of atomic nuclei, arising from the combined spins of protons and neutrons. It is characterized by the spin quantum number , which takes non-negative values (integer or half-integer) depending on the nuclear composition: nuclei with even numbers of both protons and neutrons have , while others have non-zero . The possible orientations of the spin angular momentum relative to an external axis are quantized, resulting in distinct spin states, each associated with a magnetic quantum number that ranges from to in steps of 1. For instance, the nucleus (proton) has , yielding two states: (denoted as the α state) and (β state).[17][18] The nuclear magnetic moment , which enables interaction with magnetic fields, is directly proportional to the spin angular momentum operator . It is expressed as , where is the gyromagnetic ratio—a nucleus-specific constant reflecting the ratio of magnetic moment to angular momentum—and is the reduced Planck's constant. The magnitude of the magnetic moment is , but in the context of directional interactions, the vector form with the operator is used. This relationship underscores why only nuclei with exhibit magnetic resonance behavior, as implies no magnetic moment.[19] When placed in a static external magnetic field (typically aligned along the z-axis), the degenerate spin states split due to the Zeeman effect, lifting the energy degeneracy through the interaction Hamiltonian . The energy for each state becomes , where determines the projection of the spin along . For a spin-1/2 nucleus, this results in two levels separated by , with the lower-energy state ( for positive ) slightly more populated at thermal equilibrium due to the Boltzmann distribution. This splitting forms the basis for the energy differences probed in NMR.[20][21] In the classical vector model, the behavior of an ensemble of nuclear spins is described by the macroscopic magnetization vector , which represents the vector sum (or thermal average) of the individual microscopic magnetic moments . At equilibrium, aligns predominantly along , with its magnitude proportional to the population difference between spin states and the sample's nuclear density. Upon perturbation or in the absence of relaxation, precesses around at the Larmor frequency , analogous to a gyroscope in a gravitational field; this precession frequency is independent of and sets the timescale for NMR phenomena.[22][23] The chemical environment surrounding the nucleus influences the effective local magnetic field, primarily through shielding effects from the orbiting electrons, which generate an induced field opposing . This modulation, known as chemical shielding, causes slight variations in the experienced field , where is the shielding constant, leading to nucleus-specific resonance positions without altering the fundamental spin properties.[24]Resonance and energy transitions
In nuclear magnetic resonance (NMR), the phenomenon of resonance occurs when a radiofrequency (RF) field, denoted as , is applied perpendicular to the static magnetic field at the precise frequency matching the Larmor precession of nuclear spins. The Larmor frequency , where is the gyromagnetic ratio of the nucleus, governs this precession, causing the spins to absorb energy and transition between aligned and anti-aligned states relative to . This resonance condition was first theoretically described in the context of NMR by Bloch, who modeled the macroscopic magnetization as precessing around at this frequency. The energy difference between the spin states arises from the Zeeman splitting in the magnetic field, given by , where is Planck's constant and . At resonance, the oscillating field induces transitions, leading to net absorption of RF energy by the spin system, as observed in early continuous-wave NMR experiments. This absorption spectrum reflects the frequency-dependent energy levels, with the peak occurring at the Larmor frequency for each NMR-active nucleus. In modern pulse NMR, short RF pulses rather than continuous waves are used to excite the spins efficiently. A 90° pulse, for instance, tips the equilibrium magnetization from the direction of into the transverse plane, creating a coherent precessing magnetization that generates a detectable signal known as the free induction decay (FID). The tip angle of such a pulse is determined by , where is the pulse duration and is the RF field amplitude; a 180° pulse inverts the magnetization, while the 90° pulse maximizes transverse component formation. The Bloch vector model illustrates this evolution: under , the magnetization precesses longitudinally, but the resonant rotates it in the rotating frame, producing the FID as the transverse magnetization decays over time. The time-domain FID signal is converted to the frequency-domain absorption spectrum through Fourier transformation, where the spectrum is obtained as the Fourier transform of the FID, . This pulsed Fourier transform (FT) approach, pioneered by Ernst and Anderson, dramatically improves sensitivity and resolution by allowing rapid signal acquisition and averaging. In the Bloch picture, the post-pulse dynamics under combined and fields highlight how resonance drives these coherent transitions, forming the basis for all subsequent NMR signal generation.Relaxation mechanisms
In nuclear magnetic resonance (NMR) spectroscopy, relaxation mechanisms govern the return of the perturbed nuclear spin system to thermal equilibrium, influencing signal decay and spectral quality. Longitudinal relaxation, denoted by the time constant T1, describes the recovery of the z-component of the net magnetization (Mz) to its equilibrium value (M0) through spin-lattice interactions, where excess spin energy is dissipated to the surrounding molecular lattice. This process is quantified by the relaxation rate 1/T1 = W↑ + W↓, with W↑ and W↓ representing the transition probabilities for upward and downward spin flips, respectively.[25] Transverse relaxation, characterized by T2, accounts for the decay of the transverse magnetization (Mxy) primarily due to spin-spin dephasing, arising from mutual interactions among spins and local magnetic field fluctuations. In general, T2 ≤ T1 because transverse relaxation encompasses both the irreversible energy exchange of T1 and reversible but accumulating phase differences; an additional contribution, pure dephasing (T2'), stems from extrinsic magnetic field inhomogeneities across the sample. The overall effective transverse relaxation time is then 1/T2 = 1/T2(intrinsic) + 1/T2'.[14] Several molecular mechanisms contribute to spin relaxation rates, with their relative importance depending on the nucleus, solvent, temperature, and magnetic field strength. The dominant mechanism for many organic molecules, particularly those involving protons or other abundant spins, is dipole-dipole relaxation, which originates from through-space magnetic field fluctuations caused by rotating dipolar couplings between nearby nuclei. Other key mechanisms include chemical shift anisotropy (CSA), arising from time-dependent variations in the nuclear shielding tensor during molecular tumbling; spin-rotation interactions, due to coupling between the nuclear spin and the rotational angular momentum of the molecule; and scalar (or J) relaxation, from modulation of isotropic spin-spin couplings during chemical exchange or bond vibrations. In the extreme narrowing limit (where the correlation time τc satisfies ωτc ≪ 1, with ω the Larmor frequency), the intramolecular dipole-dipole contribution to the longitudinal relaxation rate for two identical spins-1/2 is given by where γ is the gyromagnetic ratio, ħ is the reduced Planck's constant, and r is the internuclear distance.[26][27] A significant consequence of dipole-dipole coupling is the nuclear Overhauser effect (NOE), a cross-relaxation process that transfers T1 relaxation between interacting nuclei, often enhancing the signal intensity of one nucleus (e.g., ¹H) upon saturation of another (e.g., ¹³C or ¹⁵N). This effect, proportional to the inverse sixth power of the internuclear distance, provides distance constraints in structure determination.[25] Practical measurement of relaxation times is essential for quantitative NMR analysis. T1 is commonly determined using the inversion recovery sequence, which applies a 180° pulse to invert Mz, allows recovery for a variable delay τ, and then acquires the signal with a 90° pulse, fitting the recovered intensity to derive T1. For T2, the spin-echo method refocuses dephasing due to static field inhomogeneities: a 90° pulse creates Mxy, followed by a 180° pulse after time τ/2 to form an echo at τ, with signal decay yielding T2.[28]Instrumentation and experimental setup
Magnets, probes, and hardware
Modern NMR spectrometers rely on superconducting magnets to generate the strong, stable magnetic fields essential for high-resolution spectroscopy. These magnets typically operate at field strengths ranging from 9.4 T to 23.5 T, corresponding to proton resonance frequencies of 400 MHz to 1000 MHz.[29] The superconducting coils, often made from niobium-titanium alloys, must be maintained at cryogenic temperatures near 4 K using liquid helium as the primary coolant, while an outer liquid nitrogen jacket at approximately 77 K minimizes heat transfer to the helium reservoir and reduces boil-off rates.[30][31] The probe serves as the interface for radiofrequency (RF) excitation and signal detection within the magnet's bore. It incorporates RF coils designed to transmit pulsed RF fields that interact with nuclear spins and receive the weak induced signals, optimized for specific nuclei such as 1H or 13C.[29] Cryogenically cooled probes enhance sensitivity by chilling the RF coils to around 25 K, reducing thermal noise and achieving signal-to-noise ratio (S/N) improvements of up to 4-fold compared to room-temperature probes, particularly beneficial for low-concentration samples in non-polar solvents.[32] Gradient coils are integrated into the probe or magnet assembly to produce controlled spatial variations in the magnetic field, enabling techniques such as diffusion measurements, selective excitation, or multidimensional imaging in solid-state and solution NMR.[33] These coils generate linear field gradients along the x, y, or z axes, allowing precise localization of signals without mechanical sample movement. The console and associated electronics form the control and signal processing hub of the NMR system. Pulse programmers generate precise timing sequences for RF pulses, while high-power amplifiers deliver the necessary energy for excitation, and sensitive preamplifiers and digitizers capture and convert analog signals to digital data for further processing.[34] Modern consoles support multi-channel operation, facilitating simultaneous handling of multiple frequencies in quadruple resonance probes tuned for nuclei like 1H, 13C, 15N, and 2H (for locking), which is standard in biomolecular applications.[35] Achieving high spectral resolution in NMR demands exceptional field homogeneity, typically required to be better than 1 part per billion (ppb) variation over the active sample volume of several millimeters.[36] This uniformity is maintained through superconducting shim coils that adjust higher-order field imperfections, ensuring minimal line broadening and accurate chemical shift determination.[37]Sample preparation and handling
In solution-state nuclear magnetic resonance (NMR) spectroscopy, samples must be in liquid form to enable molecular tumbling and narrow spectral linewidths. Typically, 0.5–0.7 mL of sample is prepared in standard 5 mm outer diameter NMR tubes, corresponding to a fill height of approximately 4.5–5 cm for optimal shimming and signal-to-noise ratio. For ¹H NMR, analyte concentrations range from 2–50 mM, balancing sensitivity with avoidance of aggregation or dynamic range issues; higher concentrations up to 100 mM may be used for dilute samples but can complicate spectral interpretation.[38][39][40] Deuterated solvents are essential for solution NMR, serving multiple roles: providing a deuterium lock signal for field stabilization (as detailed in shimming and locking procedures), minimizing proton background signals that would obscure analyte resonances, and controlling solution viscosity to maintain appropriate relaxation times. Common deuterated solvents are selected based on analyte solubility, chemical stability, and polarity; for instance, CDCl₃ is widely used for non-polar organics due to its low viscosity and inertness, while D₂O suits aqueous biomolecules. These solvents exhibit residual proton signals at specific chemical shifts, which must be accounted for in spectral assignment, and their physical properties influence experimental conditions. Solvent choice can also subtly affect chemical shifts through solvent-solute interactions (as explored in chemical shift analysis). The following table summarizes properties of selected common deuterated solvents, including residual ¹H chemical shifts (in ppm relative to TMS), ²H-¹H coupling constants (in Hz), melting and boiling points (°C), and density (g/mL at 20°C):| Solvent | Residual ¹H (ppm) | ²H-¹H J (Hz) | Melting Point (°C) | Boiling Point (°C) | Density (g/mL) |
|---|---|---|---|---|---|
| CDCl₃ | 7.26 | - | -64 | 61 | 1.50 |
| D₂O | 4.79 (HOD) | - | 3.8 | 101.4 | 1.11 |
| DMSO-d₆ | 2.50 | 1.7 | 18 | 189 | 1.18 |
| Acetone-d₆ | 2.05 | 0.9 | -94 | 56 | 0.87 |
| CD₃OD | 3.31 (CH₃), 4.87 (OH) | 1.7 (CH₃) | -98 | 65 | 0.89 |
| C₆D₆ | 7.16 | - | 6.8 | 80 | 0.95 |
