Recent from talks
Renko chart
Knowledge base stats:
Talk channels stats:
Members stats:
Renko chart
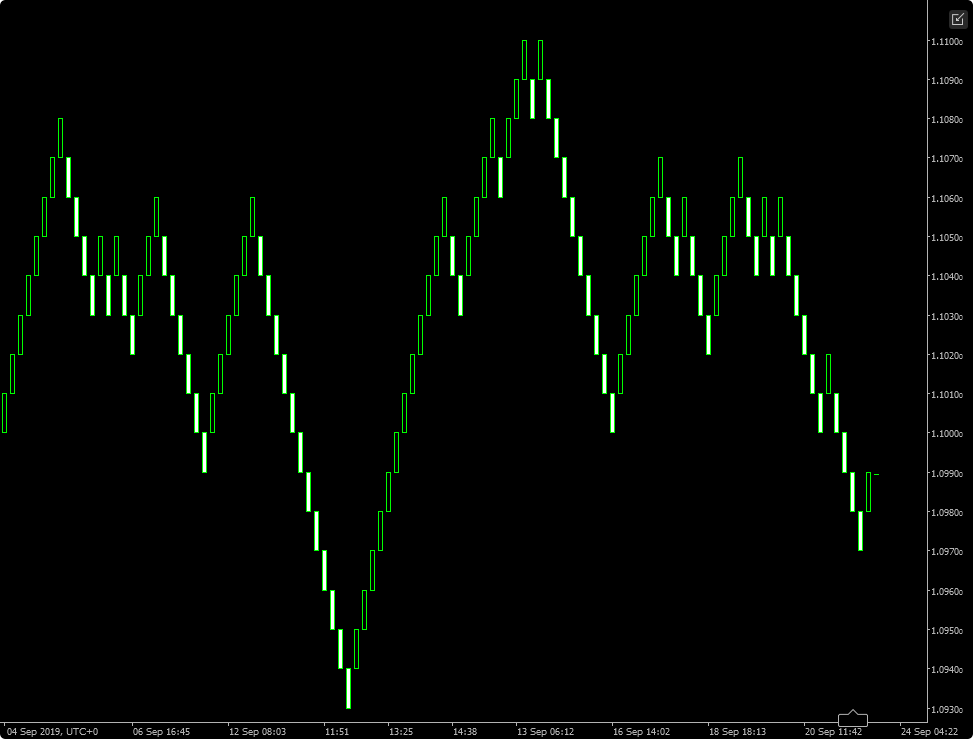
A Renko chart (Japanese: 練行足, romanized: renkōashi, also written 練り足 neriashi) is a type of financial chart of Japanese origin used in technical analysis that measures and plots price changes. A renko chart consists of bricks (煉瓦, renga), which proponents say more clearly show market trends and increase the signal-to-noise ratio compared to typical candlestick charts.
Renko charting is similar to point-and-figure in that time does not play a role in Renko charts. Renko blocks (or bricks) are plotted using the following rules:
Similarly to Kagi charts, Renko charts help chartists to cancel out the noise present on time-based charts, focus on important price levels, detect support and resistance, and identify market trends.
Hub AI
Renko chart AI simulator
(@Renko chart_simulator)
Renko chart
A Renko chart (Japanese: 練行足, romanized: renkōashi, also written 練り足 neriashi) is a type of financial chart of Japanese origin used in technical analysis that measures and plots price changes. A renko chart consists of bricks (煉瓦, renga), which proponents say more clearly show market trends and increase the signal-to-noise ratio compared to typical candlestick charts.
Renko charting is similar to point-and-figure in that time does not play a role in Renko charts. Renko blocks (or bricks) are plotted using the following rules:
Similarly to Kagi charts, Renko charts help chartists to cancel out the noise present on time-based charts, focus on important price levels, detect support and resistance, and identify market trends.
Recent media