Community hub
Recent from talks
Knowledge base stats:
Talk channels stats:
Members stats:
Cooling curve
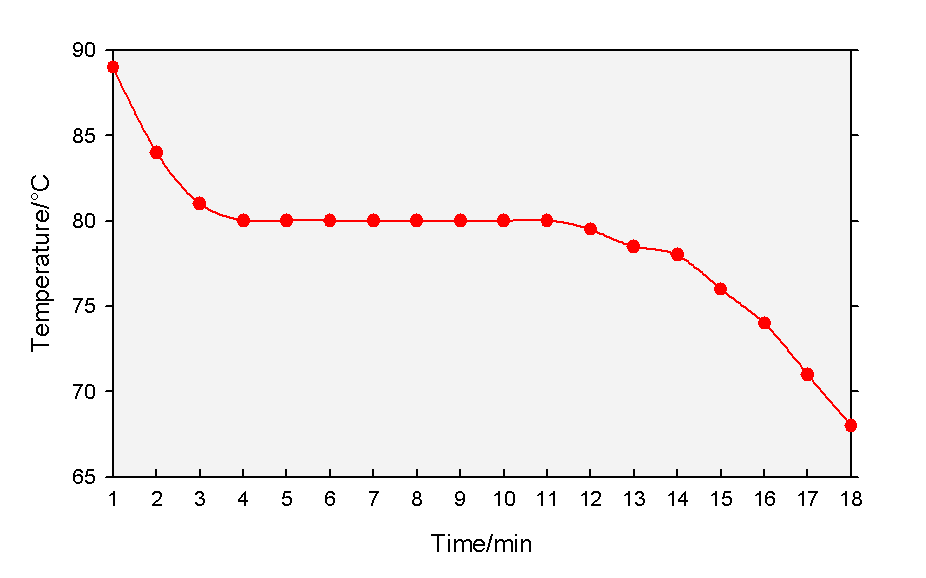
A cooling curve is a line graph that represents the change of phase of matter, typically from a gas to a solid or a liquid to a solid. The independent variable (X-axis) is time and the dependent variable (Y-axis) is temperature. Below is an example of a cooling curve used in castings.
The initial point of the graph is the starting temperature of the matter, here noted as the "pouring temperature". When the phase change occurs, there is a "thermal arrest"; that is, the temperature stays constant. This is because the matter has more internal energy as a liquid or gas than in the state that it is cooling to. The amount of energy required for a phase change is known as latent heat. The "cooling rate" is the slope of the cooling curve at any point.
Alloys have a melting point range. It solidifies as shown in the figure above. First, the molten alloy reaches to liquidus temperature and then freezing range starts. At solidus temperature, the molten alloy becomes solid.
Hub AI
Cooling curve AI simulator
(@Cooling curve_simulator)
Cooling curve
A cooling curve is a line graph that represents the change of phase of matter, typically from a gas to a solid or a liquid to a solid. The independent variable (X-axis) is time and the dependent variable (Y-axis) is temperature. Below is an example of a cooling curve used in castings.
The initial point of the graph is the starting temperature of the matter, here noted as the "pouring temperature". When the phase change occurs, there is a "thermal arrest"; that is, the temperature stays constant. This is because the matter has more internal energy as a liquid or gas than in the state that it is cooling to. The amount of energy required for a phase change is known as latent heat. The "cooling rate" is the slope of the cooling curve at any point.
Alloys have a melting point range. It solidifies as shown in the figure above. First, the molten alloy reaches to liquidus temperature and then freezing range starts. At solidus temperature, the molten alloy becomes solid.