Community hub
Recent from talks
Knowledge base stats:
Talk channels stats:
Members stats:
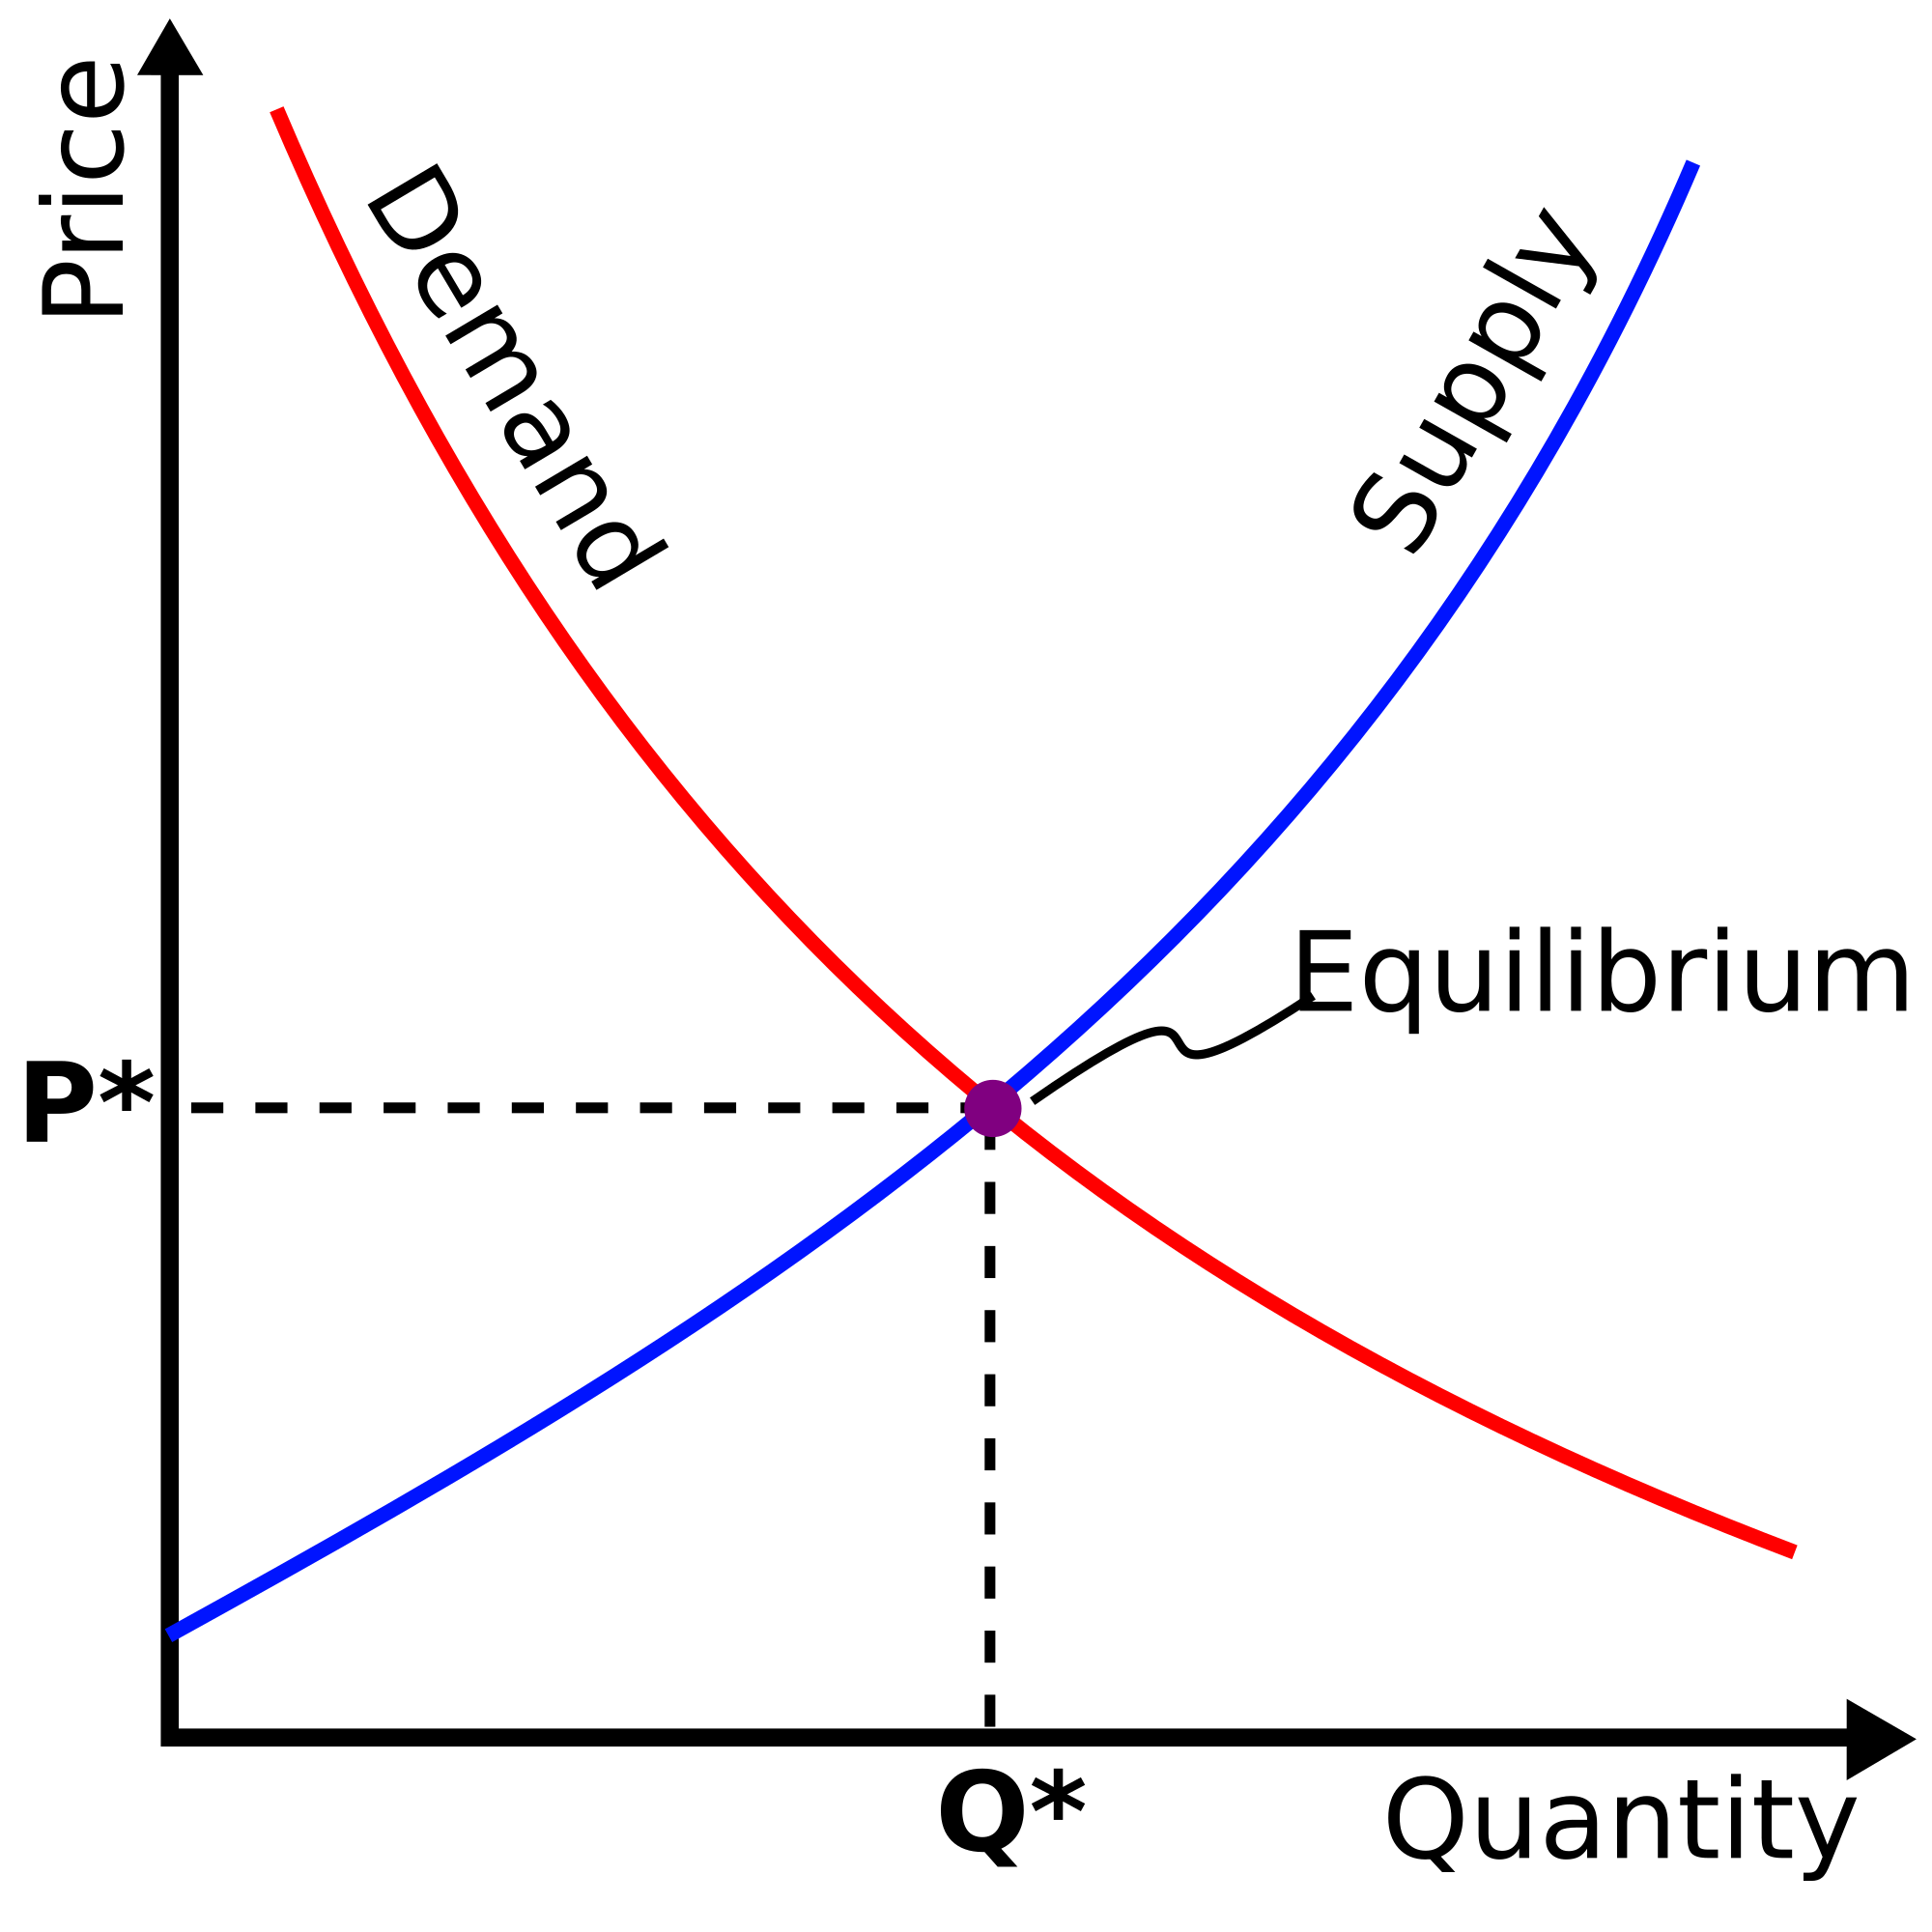
Supply and demand
In microeconomics, supply and demand is an economic model of price determination in a market. It postulates that, holding all else equal, the unit price for a particular good or other traded item in a perfectly competitive market, will vary until it settles at the market-clearing price, where the quantity demanded equals the quantity supplied such that an economic equilibrium is achieved for price and quantity transacted. The concept of supply and demand forms the theoretical basis of modern economics.
In situations where a firm has market power, its decision on how much output to bring to market influences the market price, in violation of perfect competition. There, a more complicated model should be used; for example, an oligopoly or differentiated-product model. Likewise, where a buyer has market power, models such as monopsony will be more accurate.
In macroeconomics, as well, the aggregate demand-aggregate supply model has been used to depict how the quantity of total output and the aggregate price level may be determined in equilibrium.
A supply schedule, depicted graphically as a supply curve, is a table that shows the relationship between the price of a good and the quantity supplied by producers. Under the assumption of perfect competition, supply is determined by marginal cost: Firms will produce additional output as long as the cost of extra production is less than the market price.
A rise in the cost of raw materials would decrease supply, shifting the supply curve to the left because at each possible price a smaller quantity would be supplied. This shift may also be thought of as an upwards shift in the supply curve, because the price must rise for producers to supply a given quantity. A fall in production costs would increase supply, shifting the supply curve to the right and down.
Mathematically, a supply curve is represented by a supply function, giving the quantity supplied as a function of its price and as many other variables as desired to better explain quantity supplied. The two most common specifications are:
1) linear supply function, e.g., the slanted line
2) the constant-elasticity supply function (also called isoelastic or log-log or loglinear supply function), e.g., the smooth curve
Hub AI
Supply and demand AI simulator
(@Supply and demand_simulator)
Supply and demand
In microeconomics, supply and demand is an economic model of price determination in a market. It postulates that, holding all else equal, the unit price for a particular good or other traded item in a perfectly competitive market, will vary until it settles at the market-clearing price, where the quantity demanded equals the quantity supplied such that an economic equilibrium is achieved for price and quantity transacted. The concept of supply and demand forms the theoretical basis of modern economics.
In situations where a firm has market power, its decision on how much output to bring to market influences the market price, in violation of perfect competition. There, a more complicated model should be used; for example, an oligopoly or differentiated-product model. Likewise, where a buyer has market power, models such as monopsony will be more accurate.
In macroeconomics, as well, the aggregate demand-aggregate supply model has been used to depict how the quantity of total output and the aggregate price level may be determined in equilibrium.
A supply schedule, depicted graphically as a supply curve, is a table that shows the relationship between the price of a good and the quantity supplied by producers. Under the assumption of perfect competition, supply is determined by marginal cost: Firms will produce additional output as long as the cost of extra production is less than the market price.
A rise in the cost of raw materials would decrease supply, shifting the supply curve to the left because at each possible price a smaller quantity would be supplied. This shift may also be thought of as an upwards shift in the supply curve, because the price must rise for producers to supply a given quantity. A fall in production costs would increase supply, shifting the supply curve to the right and down.
Mathematically, a supply curve is represented by a supply function, giving the quantity supplied as a function of its price and as many other variables as desired to better explain quantity supplied. The two most common specifications are:
1) linear supply function, e.g., the slanted line
2) the constant-elasticity supply function (also called isoelastic or log-log or loglinear supply function), e.g., the smooth curve