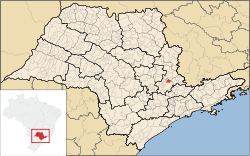
Jaguariúna is a municipality in the state of São Paulo in Brazil. It is part of the Metropolitan Region of Campinas.[2] The population is 58,722 (2020 est.) in an area of 141.39 km2.[3] The elevation is 584 m. This place name comes from the Tupi language and means the river of the black Jaguars.
In telecommunications, the city was served by Telecomunicações de São Paulo.[4] In July 1998, this company was acquired by Telefónica, which adopted the Vivo brand in 2012. The company is currently an operator of cell phones, fixed lines, internet (fiber optics/4G) and television (satellite and cable).[5]
Christianity is present in the city as follows:
The Catholic church in the municipality is part of the Roman Catholic Diocese of Amparo.[6]
The most diverse evangelical beliefs are present in the city, mainly Pentecostal, including the Assemblies of God in Brazil (the largest evangelical church in the country),[7][8] Christian Congregation in Brazil,[9] among others. These denominations are growing more and more throughout Brazil.
| Climate data for Jaguariúna, elevation 574 m (1,883 ft), (2008–2020 normals, extremes 2007–2022) | |||||||||||||
|---|---|---|---|---|---|---|---|---|---|---|---|---|---|
| Month | Jan | Feb | Mar | Apr | May | Jun | Jul | Aug | Sep | Oct | Nov | Dec | Year |
| Record high °C (°F) | 37.2 (99.0) |
37.9 (100.2) |
36.1 (97.0) |
36.4 (97.5) |
33.6 (92.5) |
32.3 (90.1) |
32.8 (91.0) |
36.0 (96.8) |
40.4 (104.7) |
41.4 (106.5) |
38.7 (101.7) |
37.2 (99.0) |
41.4 (106.5) |
| Mean daily maximum °C (°F) | 31.3 (88.3) |
31.9 (89.4) |
31.0 (87.8) |
30.1 (86.2) |
27.2 (81.0) |
26.3 (79.3) |
27.1 (80.8) |
28.4 (83.1) |
30.5 (86.9) |
31.3 (88.3) |
30.6 (87.1) |
31.5 (88.7) |
29.8 (85.6) |
| Daily mean °C (°F) | 25.5 (77.9) |
25.7 (78.3) |
24.9 (76.8) |
23.0 (73.4) |
19.7 (67.5) |
18.6 (65.5) |
18.4 (65.1) |
19.5 (67.1) |
22.2 (72.0) |
24.2 (75.6) |
24.4 (75.9) |
25.5 (77.9) |
22.6 (72.8) |
| Mean daily minimum °C (°F) | 19.6 (67.3) |
19.5 (67.1) |
18.7 (65.7) |
16.0 (60.8) |
12.2 (54.0) |
10.9 (51.6) |
9.7 (49.5) |
10.7 (51.3) |
13.8 (56.8) |
17.1 (62.8) |
18.0 (64.4) |
19.5 (67.1) |
15.5 (59.9) |
| Record low °C (°F) | 13.2 (55.8) |
15.8 (60.4) |
13.5 (56.3) |
8.9 (48.0) |
3.2 (37.8) |
1.4 (34.5) |
−1.2 (29.8) |
2.6 (36.7) |
6.3 (43.3) |
8.6 (47.5) |
9.1 (48.4) |
12.3 (54.1) |
−1.2 (29.8) |
| Average precipitation mm (inches) | 240.4 (9.46) |
144.7 (5.70) |
144.2 (5.68) |
68.5 (2.70) |
48.0 (1.89) |
58.3 (2.30) |
28.3 (1.11) |
25.1 (0.99) |
50.0 (1.97) |
88.8 (3.50) |
148.7 (5.85) |
213.9 (8.42) |
1,258.9 (49.57) |
| Average precipitation days (≥ 1.0 mm) | 18.7 | 15.6 | 15.2 | 8.0 | 8.5 | 9.4 | 5.8 | 4.5 | 6.9 | 11.4 | 14.0 | 16.7 | 134.7 |
| Source: Centro Integrado de Informações Agrometeorológicas[10][11][12][13] | |||||||||||||
This geographical article relating to the Mesoregion of Campinas is a stub. You can help Wikipedia by expanding it. |
general
This is the start of the #general chat. #general is a chat channel to discuss anything related to the hub.