
Recent from talks
Susceptibility weighted imaging
Knowledge base stats:
Talk channels stats:
Members stats:
Susceptibility weighted imaging
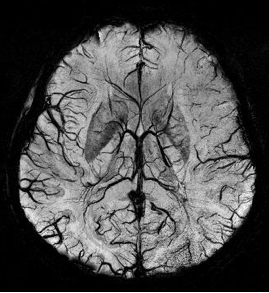
Susceptibility weighted imaging (SWI), originally called BOLD venographic imaging, is an MRI sequence that is exquisitely sensitive to venous blood, hemorrhage and iron storage. SWI uses a fully flow compensated, long echo, gradient recalled echo (GRE) pulse sequence to acquire images. This method exploits the susceptibility differences between tissues and uses the phase image to detect these differences. The magnitude and phase data are combined to produce an enhanced contrast magnitude image. The imaging of venous blood with SWI is a blood-oxygen-level dependent (BOLD) technique which is why it was (and is sometimes still) referred to as BOLD venography. Due to its sensitivity to venous blood SWI is commonly used in traumatic brain injuries (TBI) and for high resolution brain venographies but has many other clinical applications. SWI is offered as a clinical package by Philips and Siemens but can be run on any manufacturer's machine at field strengths of 1.0 T, 1.5 T, 3.0 T and higher.
SWI uses a fully velocity compensated, RF spoiled, high-resolution, 3D gradient recalled echo (GRE) scan. Both the magnitude and phase images are saved, and the phase image is high pass (HP) filtered to remove unwanted artifacts. The magnitude image is then combined with the phase image to create an enhanced contrast magnitude image referred to as the susceptibility weighted (SW) image. It is also common to create minimum intensity projections (mIP) over 8 to 10 mm to better visualize vein connectivity. In this way four sets of images are generated, the original magnitude, HP filtered phase, susceptibility weighted, and mIPs over the susceptibility weighted images.
The values in the phase images are constrained from -π to π so if the value goes above π it wraps to -π, inhomogeneities in the magnetic field cause low frequency background gradients. This causes all the phase values to slowly increase across the image which creates phase wrapping and obscures the image. This type of artifact can be removed by phase unwrapping or by high pass filtering the original complex data to remove the low frequency variations in the phase image.
The susceptibility weighted image is created by combining the magnitude and filtered phase images. A mask is created from the phase image by mapping all values above 0 radians to be 1 and linearly mapping values from -π to 0 radians to range from 0 to 1, respectively. Alternatively, a power function (typically 4th degree) can be used instead of a linear mapping from -π to 0 to increase the effect of the mask. The magnitude image is then multiplied by this mask. In this way phase values above 0 radians have no effect and phase values below 0 radians darken the magnitude image. This increases the contrast in the magnitude image for objects with low phase values such as veins, iron, and hemorrhage.
SWI is most commonly used to detect small amounts of hemorrhage or calcium. Clinical applications are under research in different fields of medicine.
The detection of micro-hemorrhages, shearing, and diffuse axonal injury (DAI) in trauma patients is often difficult as the injuries tend to be relatively small in size and can be easily missed by low resolution scans. SWI is usually run at relatively high resolution (1 mm3) and is extremely sensitive to bleeding in the gray matter/white matter boundaries making it is possible to see very small lesions increasing the ability to detect more subtle injuries.
Diffusion weighted imaging offers a powerful means to detect acute stroke. Although it is well known that gradient echo imaging can detect hemorrhage, it is best detected with SWI. In the example shown here, the gradient echo image shows the region of likely cytotoxic edema whereas the SW image shows the likely localization of the stroke and the vascular territory affected (data acquired at 1.5 T).
The bright region in the gradient echo weighted image shows the area affected in this acute stroke example. The arrows in the SWI image may show the tissue at risk that has been affected by the stroke (A, B, C) and the location of the stroke itself (D). The reason that we are able to see the affected vascular territory could be because there is a reduced level of oxygen saturation in this tissue, suggesting that the flow to this region of the brain could be reduced post stroke. Another possible explanation is that there is an increase in local venous blood volume. In either case, this image suggests that the tissue associated with this vascular territory could be tissue at risk. Future stroke research will involve comparisons of perfusion weighted imaging and SWI to learn more about local flow and oxygen saturation.
Hub AI
Susceptibility weighted imaging AI simulator
(@Susceptibility weighted imaging_simulator)
Susceptibility weighted imaging
Susceptibility weighted imaging (SWI), originally called BOLD venographic imaging, is an MRI sequence that is exquisitely sensitive to venous blood, hemorrhage and iron storage. SWI uses a fully flow compensated, long echo, gradient recalled echo (GRE) pulse sequence to acquire images. This method exploits the susceptibility differences between tissues and uses the phase image to detect these differences. The magnitude and phase data are combined to produce an enhanced contrast magnitude image. The imaging of venous blood with SWI is a blood-oxygen-level dependent (BOLD) technique which is why it was (and is sometimes still) referred to as BOLD venography. Due to its sensitivity to venous blood SWI is commonly used in traumatic brain injuries (TBI) and for high resolution brain venographies but has many other clinical applications. SWI is offered as a clinical package by Philips and Siemens but can be run on any manufacturer's machine at field strengths of 1.0 T, 1.5 T, 3.0 T and higher.
SWI uses a fully velocity compensated, RF spoiled, high-resolution, 3D gradient recalled echo (GRE) scan. Both the magnitude and phase images are saved, and the phase image is high pass (HP) filtered to remove unwanted artifacts. The magnitude image is then combined with the phase image to create an enhanced contrast magnitude image referred to as the susceptibility weighted (SW) image. It is also common to create minimum intensity projections (mIP) over 8 to 10 mm to better visualize vein connectivity. In this way four sets of images are generated, the original magnitude, HP filtered phase, susceptibility weighted, and mIPs over the susceptibility weighted images.
The values in the phase images are constrained from -π to π so if the value goes above π it wraps to -π, inhomogeneities in the magnetic field cause low frequency background gradients. This causes all the phase values to slowly increase across the image which creates phase wrapping and obscures the image. This type of artifact can be removed by phase unwrapping or by high pass filtering the original complex data to remove the low frequency variations in the phase image.
The susceptibility weighted image is created by combining the magnitude and filtered phase images. A mask is created from the phase image by mapping all values above 0 radians to be 1 and linearly mapping values from -π to 0 radians to range from 0 to 1, respectively. Alternatively, a power function (typically 4th degree) can be used instead of a linear mapping from -π to 0 to increase the effect of the mask. The magnitude image is then multiplied by this mask. In this way phase values above 0 radians have no effect and phase values below 0 radians darken the magnitude image. This increases the contrast in the magnitude image for objects with low phase values such as veins, iron, and hemorrhage.
SWI is most commonly used to detect small amounts of hemorrhage or calcium. Clinical applications are under research in different fields of medicine.
The detection of micro-hemorrhages, shearing, and diffuse axonal injury (DAI) in trauma patients is often difficult as the injuries tend to be relatively small in size and can be easily missed by low resolution scans. SWI is usually run at relatively high resolution (1 mm3) and is extremely sensitive to bleeding in the gray matter/white matter boundaries making it is possible to see very small lesions increasing the ability to detect more subtle injuries.
Diffusion weighted imaging offers a powerful means to detect acute stroke. Although it is well known that gradient echo imaging can detect hemorrhage, it is best detected with SWI. In the example shown here, the gradient echo image shows the region of likely cytotoxic edema whereas the SW image shows the likely localization of the stroke and the vascular territory affected (data acquired at 1.5 T).
The bright region in the gradient echo weighted image shows the area affected in this acute stroke example. The arrows in the SWI image may show the tissue at risk that has been affected by the stroke (A, B, C) and the location of the stroke itself (D). The reason that we are able to see the affected vascular territory could be because there is a reduced level of oxygen saturation in this tissue, suggesting that the flow to this region of the brain could be reduced post stroke. Another possible explanation is that there is an increase in local venous blood volume. In either case, this image suggests that the tissue associated with this vascular territory could be tissue at risk. Future stroke research will involve comparisons of perfusion weighted imaging and SWI to learn more about local flow and oxygen saturation.
Recent media