Community hub
Recent from talks
Knowledge base stats:
Talk channels stats:
Members stats:
Amtrak
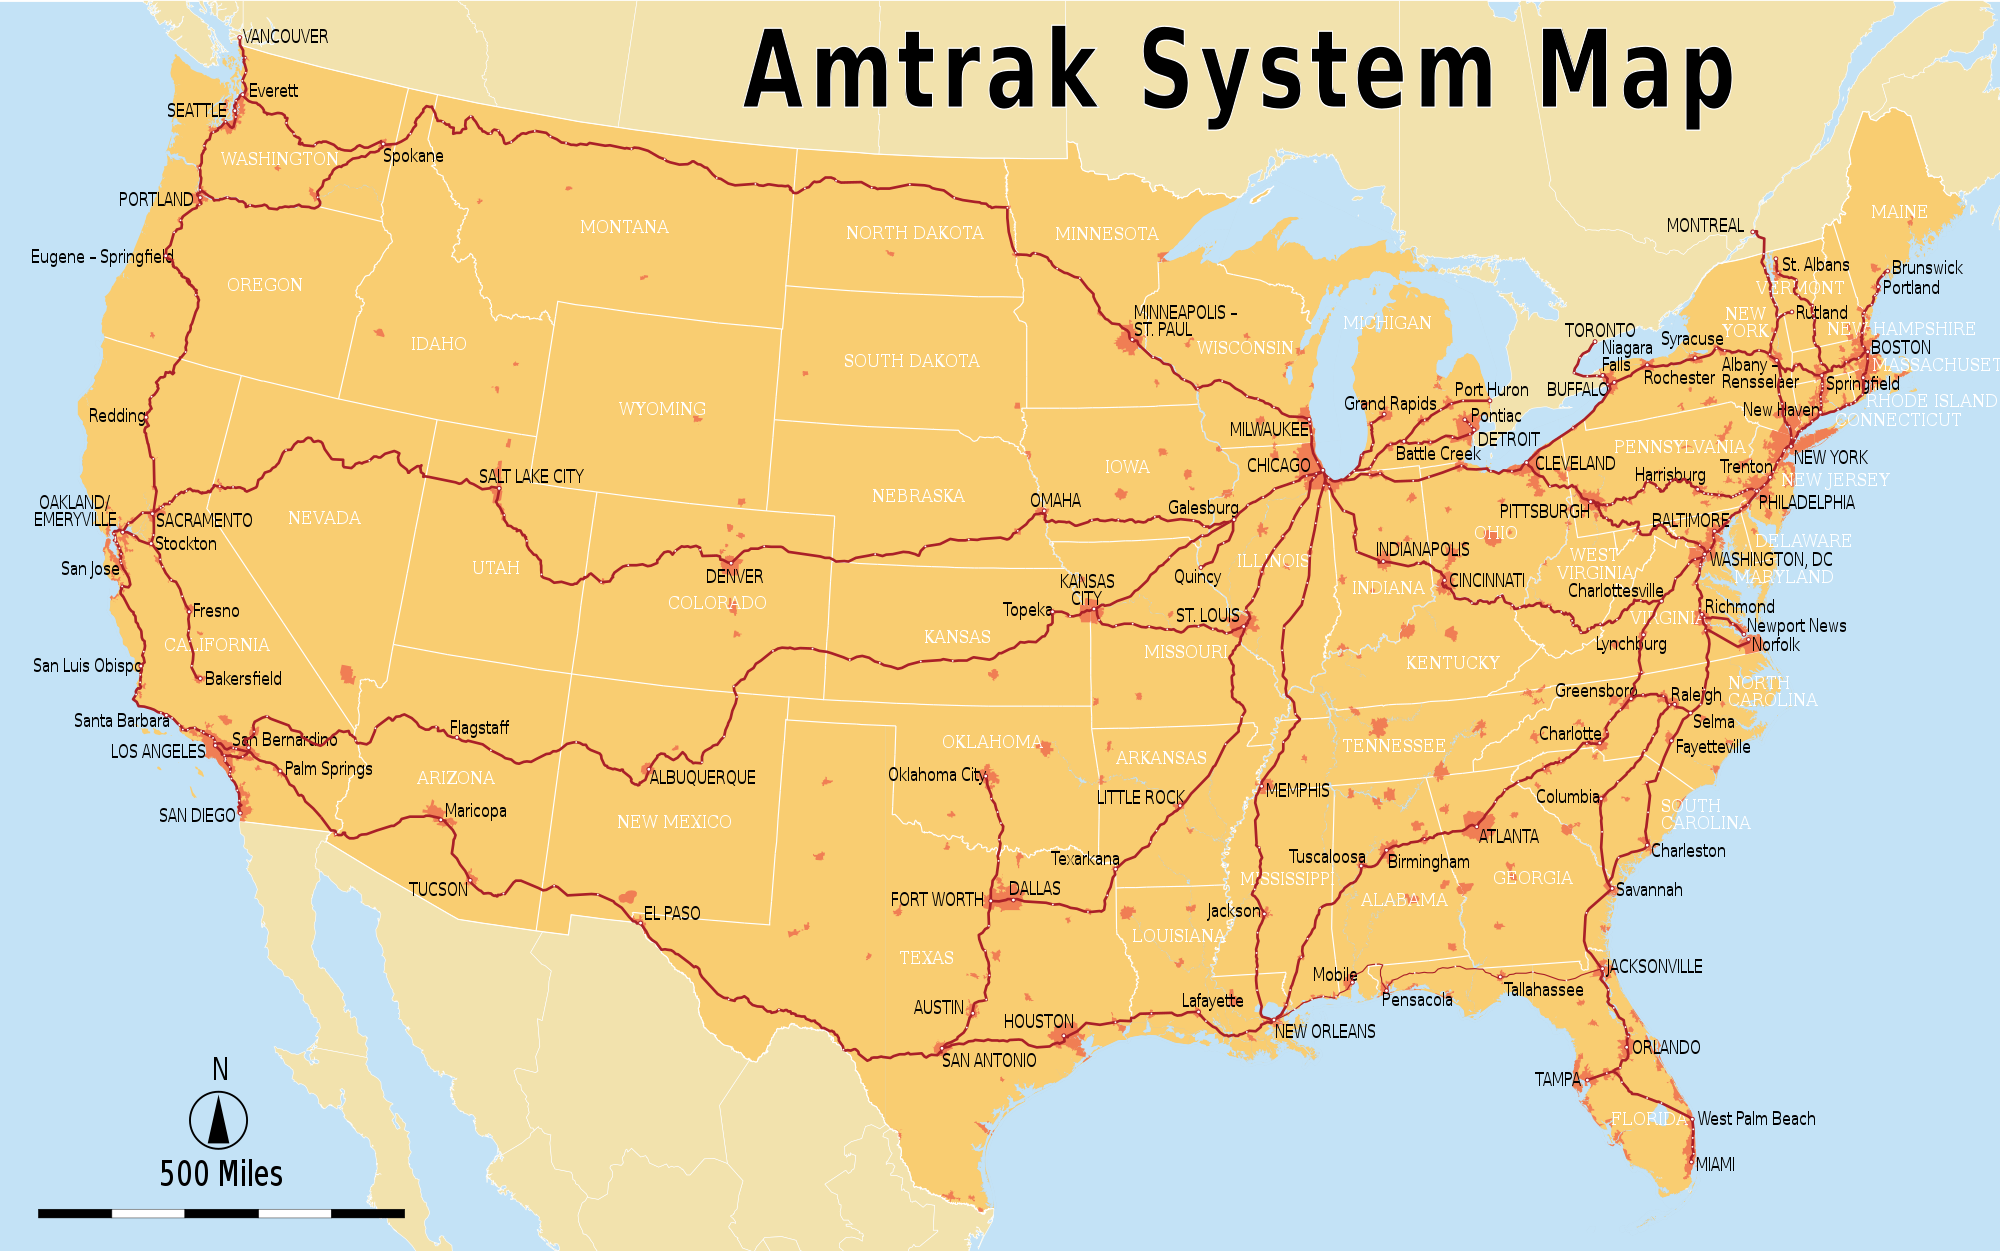
The National Railroad Passenger Corporation, doing business as Amtrak (/ˈæmtræk/; reporting marks AMTK, AMTZ), is the national passenger railroad company of the United States. It operates intercity rail service in every contiguous U.S. state except for Wyoming and South Dakota as well as three Canadian provinces. Amtrak is a portmanteau of the words America and track.
Founded in 1971 as a quasi-public corporation to operate many U.S. passenger rail routes, Amtrak receives a combination of state and federal subsidies but is managed as a for-profit organization. The company's headquarters is located one block west of Union Station in Washington, D.C. Amtrak is headed by a Board of Directors, two of whom are the secretary of transportation and chief executive officer (CEO) of Amtrak, while the other eight members are nominated to serve a term of five years.
Amtrak's network includes over 500 stations along 21,400 miles (34,000 km) of track. It directly owns approximately 623 miles (1,003 km) of this track and operates an additional 132 miles (212 km) of track; the remaining mileage is over rail lines owned by other railroad companies. While most track speeds are limited to 79 mph (127 km/h) or less, several lines have been upgraded to support top speeds of 110 mph (180 km/h), and parts of the Northeast Corridor support top speeds of 160 mph (260 km/h).
In fiscal year 2024, Amtrak served 32.4 million passengers and had $2.5 billion in revenue, with more than 22,100 employees. Nearly 87,000 passengers ride more than 300 Amtrak trains daily. Nearly two-thirds of passengers come from the 10 largest metropolitan areas and 83% of passengers travel on routes shorter than 400 miles (645 km).
In 1916, 98% of all commercial intercity travelers in the United States moved by rail, and the remaining 2% moved by inland waterways. Nearly 42 million passengers used railways as primary transportation. Passenger trains were owned and operated by the same privately owned companies that operated freight trains. As the 20th century progressed, patronage declined in the face of competition from buses, air travel, and the car. New streamlined diesel-powered trains, such as the Pioneer Zephyr, were popular with the traveling public but could not reverse the trend. By 1940, railroads held 67 percent of commercial passenger-miles in the United States. In real terms, passenger-miles had fallen by 40% since 1916, from 42 billion to 25 billion.
Traffic surged during World War II, aided by troop movement and gasoline rationing. The railroad's market share surged to 74% in 1945, with a massive 94 billion passenger-miles. After the war, railroads rejuvenated their overworked and neglected passenger fleets with fast and luxurious streamliners. These new trains brought only temporary relief to the overall decline. Even as postwar travel exploded, passenger travel percentages of the overall market share fell to 46% by 1950, and then 32% by 1957. The railroads had lost money on passenger service since the Great Depression, but deficits reached $723 million in 1957. For many railroads, these losses threatened financial viability.
The causes of this decline were heavily debated. The National Highway System and airports, both funded by the government, competed directly with the railroads, which, unlike the airline, bus, and trucking companies, paid for their own infrastructure. American car culture was also on the rise in the post–World War II years. Progressive Era rate regulation limited the railroads' ability to turn a profit. Railroads also faced antiquated work rules and inflexible relationships with trade unions. To take one example, workers continued to receive a day's pay for 100-to-150-mile (160 to 240 km) workdays. Streamliners covered that in two hours.
Matters approached a crisis in the 1960s. Passenger service route-miles fell from 107,000 miles (172,000 km) in 1958 to 49,000 miles (79,000 km) in 1970, the last full year of private operation. The diversion of most United States Post Office Department mail from passenger trains to trucks, airplanes, and freight trains in late 1967 deprived those trains of badly needed revenue. In direct response, the Atchison, Topeka and Santa Fe Railway filed to discontinue 33 of its remaining 39 trains, ending almost all passenger service on one of the largest railroads in the country. The equipment the railroads had ordered after World War II was now 20 years old, worn out, and in need of replacement.
Hub AI
Amtrak AI simulator
(@Amtrak_simulator)
Amtrak
The National Railroad Passenger Corporation, doing business as Amtrak (/ˈæmtræk/; reporting marks AMTK, AMTZ), is the national passenger railroad company of the United States. It operates intercity rail service in every contiguous U.S. state except for Wyoming and South Dakota as well as three Canadian provinces. Amtrak is a portmanteau of the words America and track.
Founded in 1971 as a quasi-public corporation to operate many U.S. passenger rail routes, Amtrak receives a combination of state and federal subsidies but is managed as a for-profit organization. The company's headquarters is located one block west of Union Station in Washington, D.C. Amtrak is headed by a Board of Directors, two of whom are the secretary of transportation and chief executive officer (CEO) of Amtrak, while the other eight members are nominated to serve a term of five years.
Amtrak's network includes over 500 stations along 21,400 miles (34,000 km) of track. It directly owns approximately 623 miles (1,003 km) of this track and operates an additional 132 miles (212 km) of track; the remaining mileage is over rail lines owned by other railroad companies. While most track speeds are limited to 79 mph (127 km/h) or less, several lines have been upgraded to support top speeds of 110 mph (180 km/h), and parts of the Northeast Corridor support top speeds of 160 mph (260 km/h).
In fiscal year 2024, Amtrak served 32.4 million passengers and had $2.5 billion in revenue, with more than 22,100 employees. Nearly 87,000 passengers ride more than 300 Amtrak trains daily. Nearly two-thirds of passengers come from the 10 largest metropolitan areas and 83% of passengers travel on routes shorter than 400 miles (645 km).
In 1916, 98% of all commercial intercity travelers in the United States moved by rail, and the remaining 2% moved by inland waterways. Nearly 42 million passengers used railways as primary transportation. Passenger trains were owned and operated by the same privately owned companies that operated freight trains. As the 20th century progressed, patronage declined in the face of competition from buses, air travel, and the car. New streamlined diesel-powered trains, such as the Pioneer Zephyr, were popular with the traveling public but could not reverse the trend. By 1940, railroads held 67 percent of commercial passenger-miles in the United States. In real terms, passenger-miles had fallen by 40% since 1916, from 42 billion to 25 billion.
Traffic surged during World War II, aided by troop movement and gasoline rationing. The railroad's market share surged to 74% in 1945, with a massive 94 billion passenger-miles. After the war, railroads rejuvenated their overworked and neglected passenger fleets with fast and luxurious streamliners. These new trains brought only temporary relief to the overall decline. Even as postwar travel exploded, passenger travel percentages of the overall market share fell to 46% by 1950, and then 32% by 1957. The railroads had lost money on passenger service since the Great Depression, but deficits reached $723 million in 1957. For many railroads, these losses threatened financial viability.
The causes of this decline were heavily debated. The National Highway System and airports, both funded by the government, competed directly with the railroads, which, unlike the airline, bus, and trucking companies, paid for their own infrastructure. American car culture was also on the rise in the post–World War II years. Progressive Era rate regulation limited the railroads' ability to turn a profit. Railroads also faced antiquated work rules and inflexible relationships with trade unions. To take one example, workers continued to receive a day's pay for 100-to-150-mile (160 to 240 km) workdays. Streamliners covered that in two hours.
Matters approached a crisis in the 1960s. Passenger service route-miles fell from 107,000 miles (172,000 km) in 1958 to 49,000 miles (79,000 km) in 1970, the last full year of private operation. The diversion of most United States Post Office Department mail from passenger trains to trucks, airplanes, and freight trains in late 1967 deprived those trains of badly needed revenue. In direct response, the Atchison, Topeka and Santa Fe Railway filed to discontinue 33 of its remaining 39 trains, ending almost all passenger service on one of the largest railroads in the country. The equipment the railroads had ordered after World War II was now 20 years old, worn out, and in need of replacement.