
Community hub
Recent from talks
Contribute something to knowledge base
Content stats: 0 posts, 0 articles, 1 media, 0 notes
Members stats: 0 subscribers, 0 contributors, 0 moderators, 0 supporters
Subscribers
Supporters
Contributors
Moderators
Hub AI
Calibration curve AI simulator
(@Calibration curve_simulator)
Hub AI
Calibration curve AI simulator
(@Calibration curve_simulator)
Calibration curve
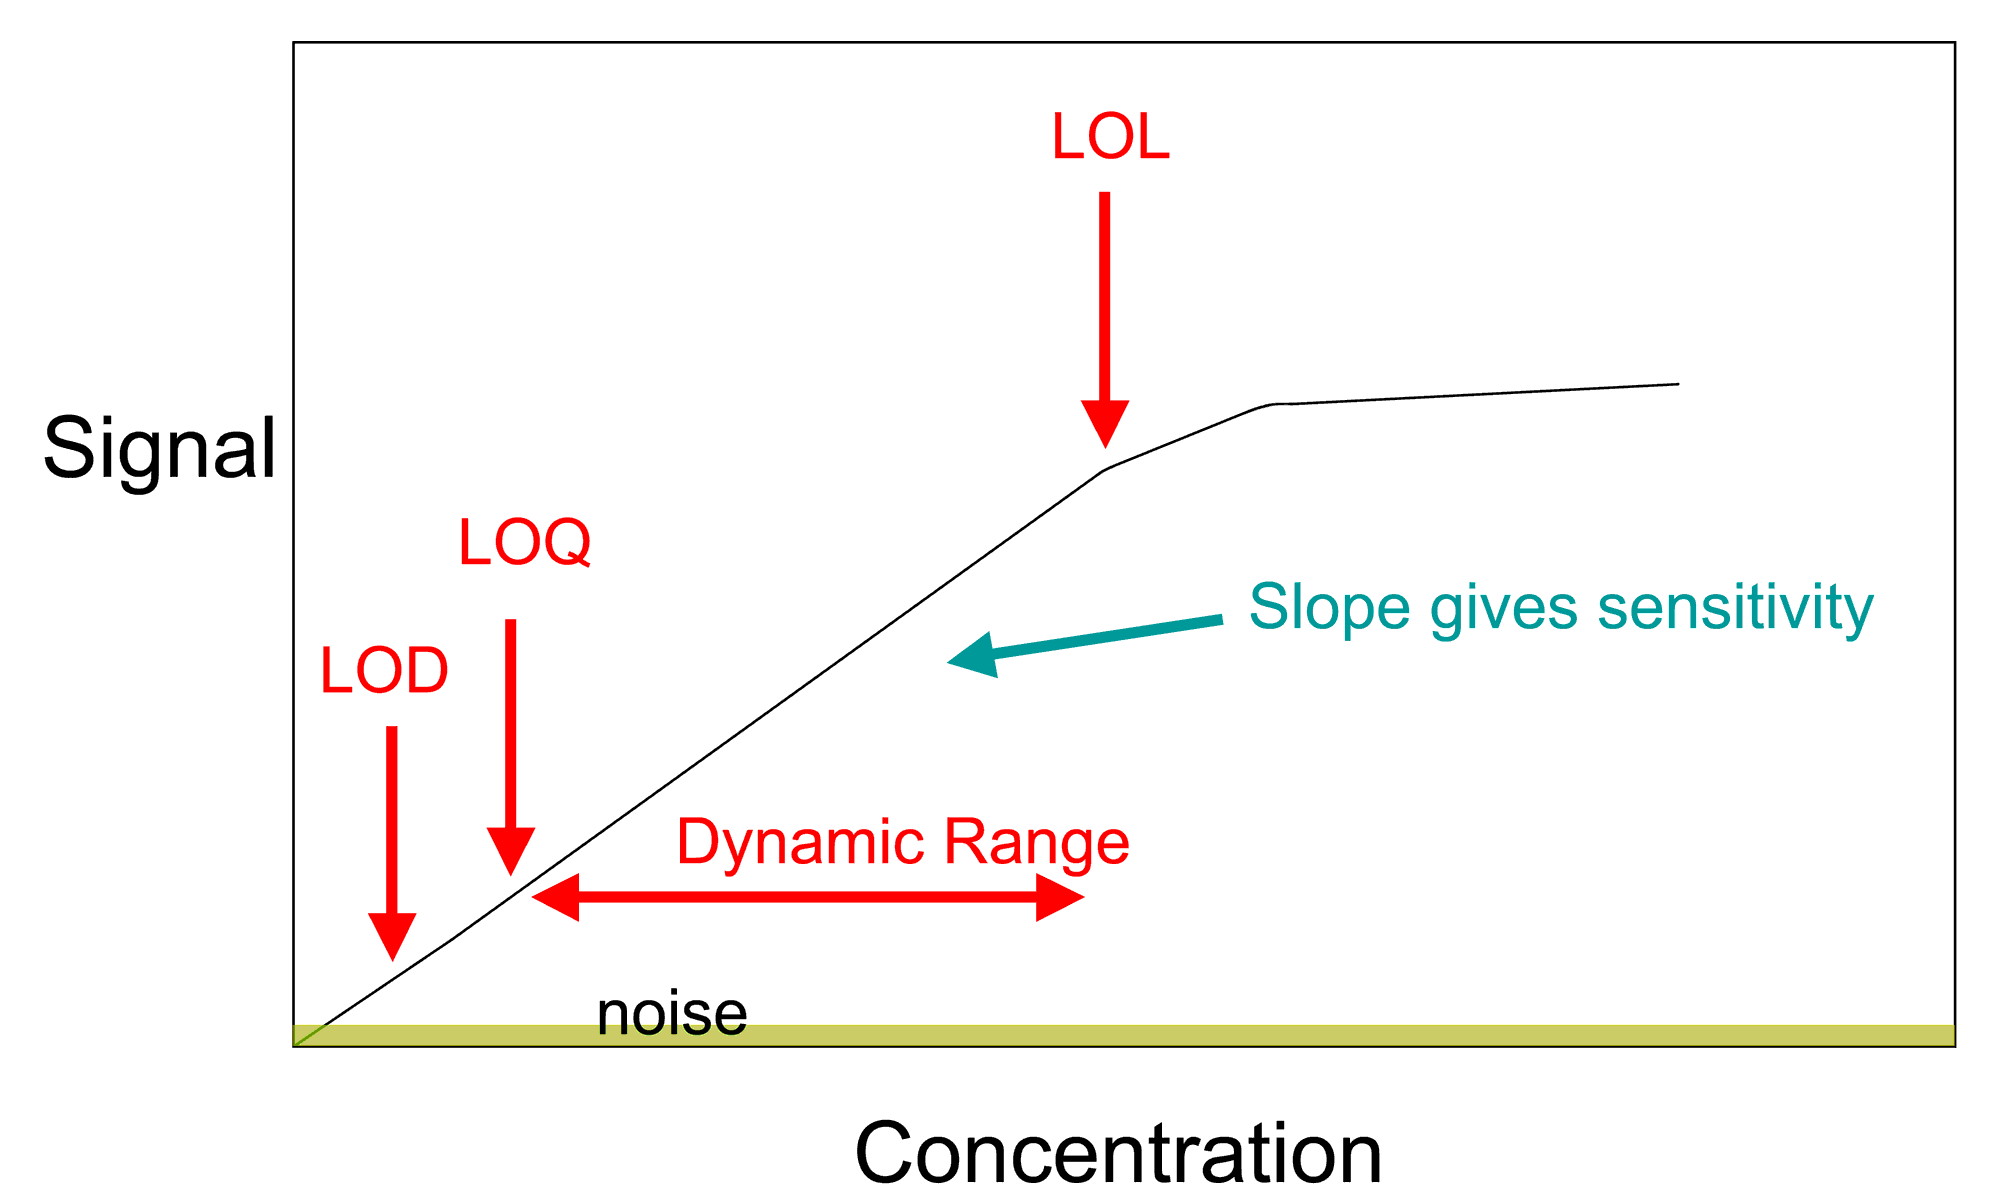
In analytical chemistry, a calibration curve, also known as a standard curve, is a general method for determining the concentration of a substance in an unknown sample by comparing the unknown to a set of standard samples of known concentration. A calibration curve is one approach to the problem of instrument calibration; other standard approaches may mix the standard into the unknown, giving an internal standard. The calibration curve is a plot of how the instrumental response, the so-called analytical signal, changes with the concentration of the analyte (the substance to be measured).
In more general use, a calibration curve is a curve or table for a measuring instrument which measures some parameter indirectly, giving values for the desired quantity as a function of values of sensor output. For example, a calibration curve can be made for a particular pressure transducer to determine applied pressure from transducer output (a voltage). Such a curve is typically used when an instrument uses a sensor whose calibration varies from one sample to another, or changes with time or use; if sensor output is consistent the instrument would be marked directly in terms of the measured unit.
The operator prepares a series of standards across a range of concentrations near the expected concentration of analyte in the unknown. The concentrations of the standards must lie within the working range of the technique (instrumentation) they are using. Analyzing each of these standards using the chosen technique will produce a series of measurements. For most analyses a plot of instrument response vs. concentration will show a linear relationship. The operator can measure the response of the unknown and, using the calibration curve, can interpolate to find the concentration of analyte.
The data – the concentrations of the analyte and the instrument response for each standard – can be fit to a straight line, using linear regression analysis. This yields a model described by the equation y = mx + y0, where y is the instrument response, m represents the sensitivity, and y0 is a constant that describes the background. The analyte concentration (x) of unknown samples may be calculated from this equation.
Many different variables can be used as the analytical signal. For instance, chromium (III) might be measured using a chemiluminescence method, in an instrument that contains a photomultiplier tube (PMT) as the detector. The detector converts the light produced by the sample into a voltage, which increases with intensity of light. The amount of light measured is the analytical signal.
The Bradford assay is a colorimetric assay that measures protein concentration. The reagent Coomassie brilliant blue turns blue when it binds to arginine and aromatic amino acids present in proteins, thus increasing the absorbance of the sample. The absorbance is measured using a spectrophotometer, at the maximum absorbance frequency (Amax) of the blue dye (which is 595 nm). In this case, the greater the absorbance, the higher the protein concentration.
Data for known concentrations of protein are used to make the standard curve, plotting concentration on the X axis, and the assay measurement on the Y axis. The same assay is then performed with samples of unknown concentration. To analyze the data, one locates the measurement on the Y-axis that corresponds to the assay measurement of the unknown substance and follows a line to intersect the standard curve. The corresponding value on the X-axis is the concentration of substance in the unknown sample.
As expected, the concentration of the unknown will have some error which can be calculated from the formula below. This formula assumes that a linear relationship is observed for all the standards. The error in the concentration will be minimal if the signal from the unknown lies in the middle of the signals of all the standards (the term goes to zero if )


Calibration curve
In analytical chemistry, a calibration curve, also known as a standard curve, is a general method for determining the concentration of a substance in an unknown sample by comparing the unknown to a set of standard samples of known concentration. A calibration curve is one approach to the problem of instrument calibration; other standard approaches may mix the standard into the unknown, giving an internal standard. The calibration curve is a plot of how the instrumental response, the so-called analytical signal, changes with the concentration of the analyte (the substance to be measured).
In more general use, a calibration curve is a curve or table for a measuring instrument which measures some parameter indirectly, giving values for the desired quantity as a function of values of sensor output. For example, a calibration curve can be made for a particular pressure transducer to determine applied pressure from transducer output (a voltage). Such a curve is typically used when an instrument uses a sensor whose calibration varies from one sample to another, or changes with time or use; if sensor output is consistent the instrument would be marked directly in terms of the measured unit.
The operator prepares a series of standards across a range of concentrations near the expected concentration of analyte in the unknown. The concentrations of the standards must lie within the working range of the technique (instrumentation) they are using. Analyzing each of these standards using the chosen technique will produce a series of measurements. For most analyses a plot of instrument response vs. concentration will show a linear relationship. The operator can measure the response of the unknown and, using the calibration curve, can interpolate to find the concentration of analyte.
The data – the concentrations of the analyte and the instrument response for each standard – can be fit to a straight line, using linear regression analysis. This yields a model described by the equation y = mx + y0, where y is the instrument response, m represents the sensitivity, and y0 is a constant that describes the background. The analyte concentration (x) of unknown samples may be calculated from this equation.
Many different variables can be used as the analytical signal. For instance, chromium (III) might be measured using a chemiluminescence method, in an instrument that contains a photomultiplier tube (PMT) as the detector. The detector converts the light produced by the sample into a voltage, which increases with intensity of light. The amount of light measured is the analytical signal.
The Bradford assay is a colorimetric assay that measures protein concentration. The reagent Coomassie brilliant blue turns blue when it binds to arginine and aromatic amino acids present in proteins, thus increasing the absorbance of the sample. The absorbance is measured using a spectrophotometer, at the maximum absorbance frequency (Amax) of the blue dye (which is 595 nm). In this case, the greater the absorbance, the higher the protein concentration.
Data for known concentrations of protein are used to make the standard curve, plotting concentration on the X axis, and the assay measurement on the Y axis. The same assay is then performed with samples of unknown concentration. To analyze the data, one locates the measurement on the Y-axis that corresponds to the assay measurement of the unknown substance and follows a line to intersect the standard curve. The corresponding value on the X-axis is the concentration of substance in the unknown sample.
As expected, the concentration of the unknown will have some error which can be calculated from the formula below. This formula assumes that a linear relationship is observed for all the standards. The error in the concentration will be minimal if the signal from the unknown lies in the middle of the signals of all the standards (the term goes to zero if )
Recent media
Recent media