Recent from talks
Mathematical diagram
Knowledge base stats:
Talk channels stats:
Members stats:
Mathematical diagram
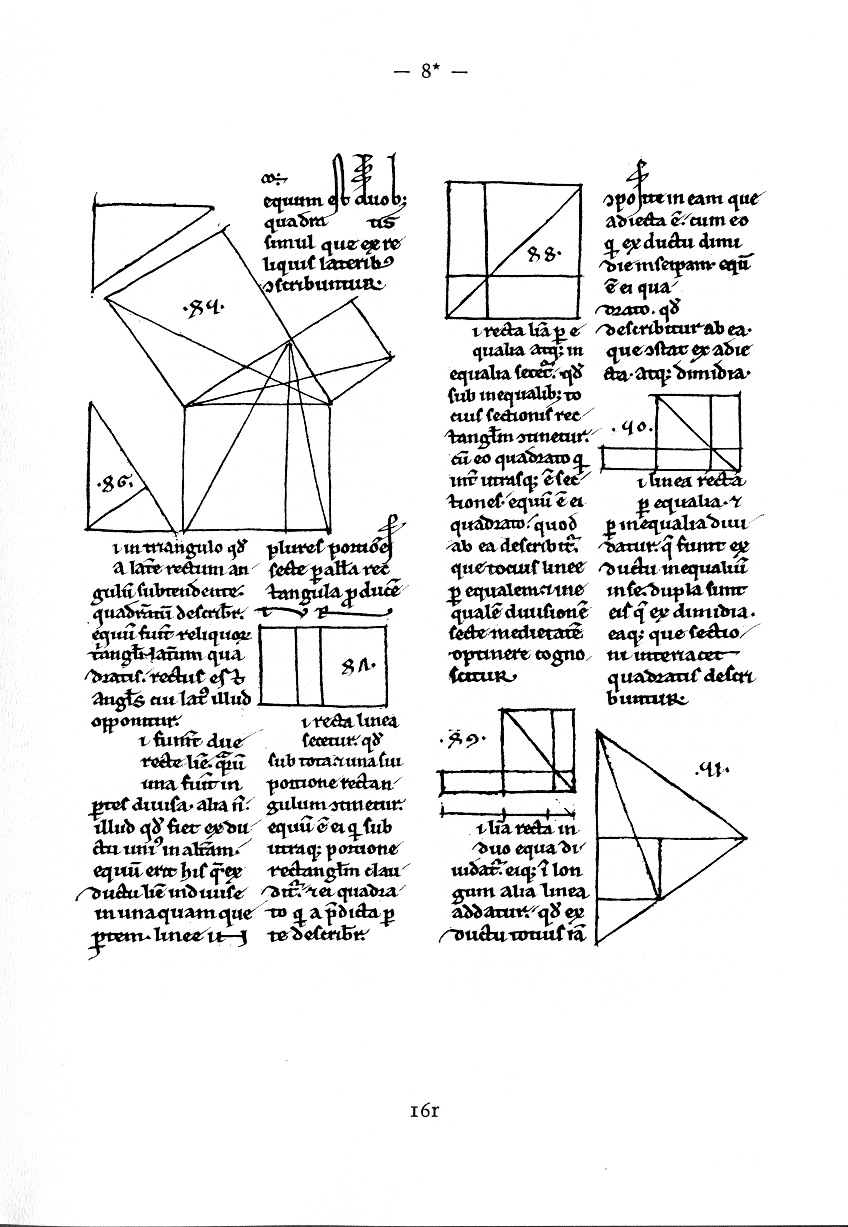
Mathematical diagrams, such as charts and graphs, are mainly designed to convey mathematical relationships—for example, comparisons over time.
A complex number can be visually represented as a pair of numbers forming a vector on a diagram called an Argand diagram The complex plane is sometimes called the Argand plane because it is used in Argand diagrams. These are named after Jean-Robert Argand (1768–1822), although they were first described by Norwegian-Danish land surveyor and mathematician Caspar Wessel (1745–1818). Argand diagrams are frequently used to plot the positions of the poles and zeroes of a function in the complex plane.
The concept of the complex plane allows a geometric interpretation of complex numbers. Under addition, they add like vectors. The multiplication of two complex numbers can be expressed most easily in polar coordinates — the magnitude or modulus of the product is the product of the two absolute values, or moduli, and the angle or argument of the product is the sum of the two angles, or arguments. In particular, multiplication by a complex number of modulus 1 acts as a rotation.
In the context of fast Fourier transform algorithms, a butterfly is a portion of the computation that combines the results of smaller discrete Fourier transforms (DFTs) into a larger DFT, or vice versa (breaking a larger DFT up into subtransforms). The name "butterfly" comes from the shape of the data-flow diagram in the radix-2 case, as described below. The same structure can also be found in the Viterbi algorithm, used for finding the most likely sequence of hidden states.
The butterfly diagram show a data-flow diagram connecting the inputs x (left) to the outputs y that depend on them (right) for a "butterfly" step of a radix-2 Cooley–Tukey FFT algorithm. This diagram resembles a butterfly as in the Morpho butterfly shown for comparison, hence the name.
In mathematics, and especially in category theory, a commutative diagram is a diagram of objects, also known as vertices, and morphisms, also known as arrows or edges, such that when selecting two objects any directed path through the diagram leads to the same result by composition.
Commutative diagrams play the role in category theory that equations play in algebra.
A Hasse diagram is a simple picture of a finite partially ordered set, forming a drawing of the partial order's transitive reduction. Concretely, one represents each element of the set as a vertex on the page and draws a line segment or curve that goes upward from x to y precisely when x < y and there is no z such that x < z < y. In this case, we say y covers x, or y is an immediate successor of x. In a Hasse diagram, it is required that the curves be drawn so that each meets exactly two vertices: its two endpoints. Any such diagram (given that the vertices are labeled) uniquely determines a partial order, and any partial order has a unique transitive reduction, but there are many possible placements of elements in the plane, resulting in different Hasse diagrams for a given order that may have widely varying appearances.
Hub AI
Mathematical diagram AI simulator
(@Mathematical diagram_simulator)
Mathematical diagram
Mathematical diagrams, such as charts and graphs, are mainly designed to convey mathematical relationships—for example, comparisons over time.
A complex number can be visually represented as a pair of numbers forming a vector on a diagram called an Argand diagram The complex plane is sometimes called the Argand plane because it is used in Argand diagrams. These are named after Jean-Robert Argand (1768–1822), although they were first described by Norwegian-Danish land surveyor and mathematician Caspar Wessel (1745–1818). Argand diagrams are frequently used to plot the positions of the poles and zeroes of a function in the complex plane.
The concept of the complex plane allows a geometric interpretation of complex numbers. Under addition, they add like vectors. The multiplication of two complex numbers can be expressed most easily in polar coordinates — the magnitude or modulus of the product is the product of the two absolute values, or moduli, and the angle or argument of the product is the sum of the two angles, or arguments. In particular, multiplication by a complex number of modulus 1 acts as a rotation.
In the context of fast Fourier transform algorithms, a butterfly is a portion of the computation that combines the results of smaller discrete Fourier transforms (DFTs) into a larger DFT, or vice versa (breaking a larger DFT up into subtransforms). The name "butterfly" comes from the shape of the data-flow diagram in the radix-2 case, as described below. The same structure can also be found in the Viterbi algorithm, used for finding the most likely sequence of hidden states.
The butterfly diagram show a data-flow diagram connecting the inputs x (left) to the outputs y that depend on them (right) for a "butterfly" step of a radix-2 Cooley–Tukey FFT algorithm. This diagram resembles a butterfly as in the Morpho butterfly shown for comparison, hence the name.
In mathematics, and especially in category theory, a commutative diagram is a diagram of objects, also known as vertices, and morphisms, also known as arrows or edges, such that when selecting two objects any directed path through the diagram leads to the same result by composition.
Commutative diagrams play the role in category theory that equations play in algebra.
A Hasse diagram is a simple picture of a finite partially ordered set, forming a drawing of the partial order's transitive reduction. Concretely, one represents each element of the set as a vertex on the page and draws a line segment or curve that goes upward from x to y precisely when x < y and there is no z such that x < z < y. In this case, we say y covers x, or y is an immediate successor of x. In a Hasse diagram, it is required that the curves be drawn so that each meets exactly two vertices: its two endpoints. Any such diagram (given that the vertices are labeled) uniquely determines a partial order, and any partial order has a unique transitive reduction, but there are many possible placements of elements in the plane, resulting in different Hasse diagrams for a given order that may have widely varying appearances.
Recent media