Hubbry Logo
Graph drawingGraph drawingMain
Open search
Graph drawing
Community hub
Graph drawing
logo
8 pages, 0 posts
0 subscribers
Be the first to start a discussion here.
Contribute something
Graph drawing
Graph drawing
from Wikipedia

Graphic representation of a minute fraction of the WWW, demonstrating hyperlinks.

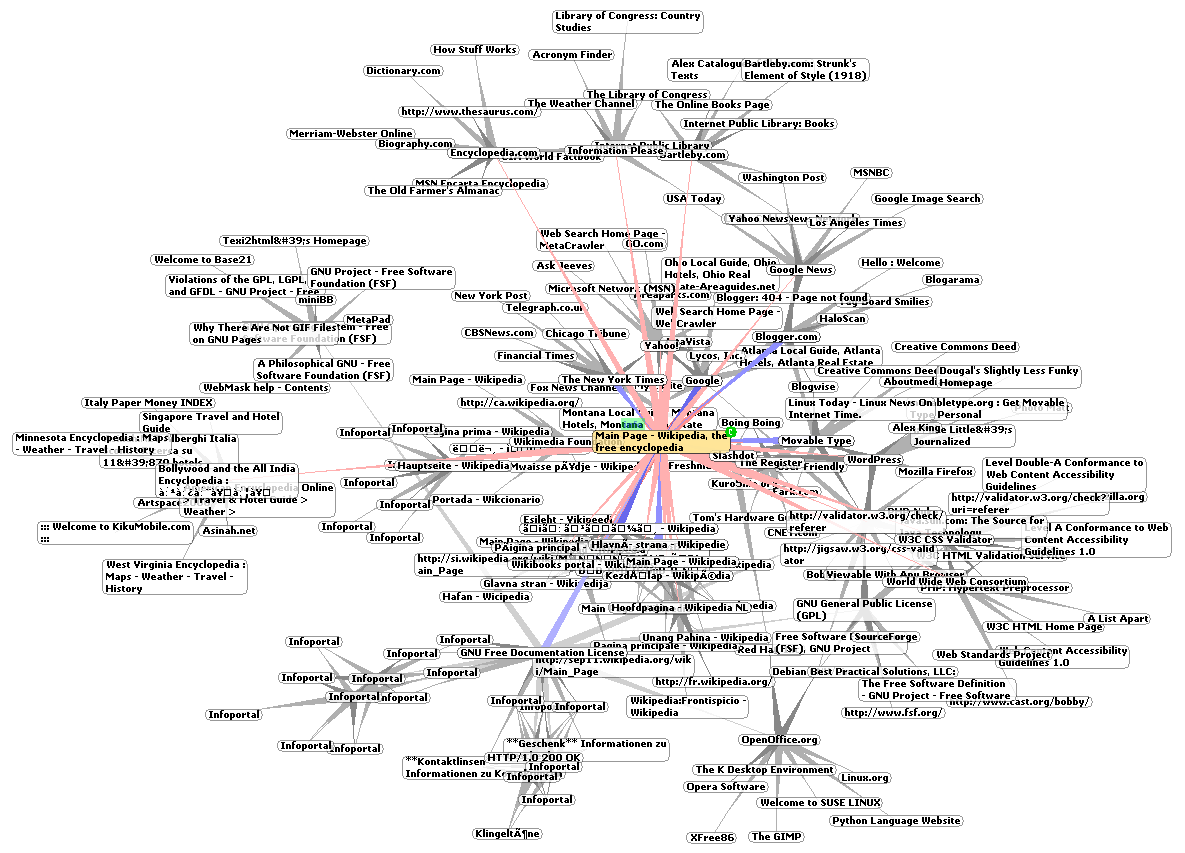
Graph drawing is an area of mathematics and computer science combining methods from geometric graph theory and information visualization to derive two-dimensional (or, sometimes, three-dimensional) depictions of graphs arising from applications such as social network analysis, cartography, linguistics, and bioinformatics.[1]

A drawing of a graph or network diagram is a pictorial representation of the vertices and edges of a graph. This drawing should not be confused with the graph itself: very different layouts can correspond to the same graph.[2] In the abstract, all that matters is which pairs of vertices are connected by edges. In the concrete, however, the arrangement of these vertices and edges within a drawing affects its understandability, usability, fabrication cost, and aesthetics.[3] The problem gets worse if the graph changes over time by adding and deleting edges (dynamic graph drawing) and the goal is to preserve the user's mental map.[4]

Graphical conventions

[edit]
Directed graph with arrowheads showing edge directions

Graphs are frequently drawn as node–link diagrams in which the vertices are represented as disks, boxes, or textual labels and the edges are represented as line segments, polylines, or curves in the Euclidean plane.[3] Node–link diagrams can be traced back to the 14th-16th century works of Pseudo-Lull which were published under the name of Ramon Llull, a 13th century polymath. Pseudo-Lull drew diagrams of this type for complete graphs in order to analyze all pairwise combinations among sets of metaphysical concepts.[5]

In the case of directed graphs, arrowheads form a commonly used graphical convention to show their orientation;[2] however, user studies have shown that other conventions such as tapering provide this information more effectively.[6] Upward planar drawing uses the convention that every edge is oriented from a lower vertex to a higher vertex, making arrowheads unnecessary.[7]

Alternative conventions to node–link diagrams include adjacency representations such as circle packings, in which vertices are represented by disjoint regions in the plane and edges are represented by adjacencies between regions; intersection representations in which vertices are represented by non-disjoint geometric objects and edges are represented by their intersections; visibility representations in which vertices are represented by regions in the plane and edges are represented by regions that have an unobstructed line of sight to each other; confluent drawings, in which edges are represented as smooth curves within mathematical train tracks; fabrics, in which nodes are represented as horizontal lines and edges as vertical lines;[8] and visualizations of the adjacency matrix of the graph.

Quality measures

[edit]

Many different quality measures have been defined for graph drawings, in an attempt to find objective means of evaluating their aesthetics and usability.[9] In addition to guiding the choice between different layout methods for the same graph, some layout methods attempt to directly optimize these measures.

Planar graph drawn without overlapping edges
  • The crossing number of a drawing is the number of pairs of edges that cross each other. If the graph is planar, then it is often convenient to draw it without any edge intersections; that is, in this case, a graph drawing represents a graph embedding. However, nonplanar graphs frequently arise in applications, so graph drawing algorithms must generally allow for edge crossings.[10]
  • The area of a drawing is the size of its smallest bounding box, relative to the closest distance between any two vertices. Drawings with smaller area are generally preferable to those with larger area, because they allow the features of the drawing to be shown at greater size and therefore more legibly. The aspect ratio of the bounding box may also be important.
  • Symmetry display is the problem of finding symmetry groups within a given graph, and finding a drawing that displays as much of the symmetry as possible. Some layout methods automatically lead to symmetric drawings; alternatively, some drawing methods start by finding symmetries in the input graph and using them to construct a drawing.[11]
  • It is important that edges have shapes that are as simple as possible, to make it easier for the eye to follow them. In polyline drawings, the complexity of an edge may be measured by its number of bends, and many methods aim to provide drawings with few total bends or few bends per edge. Similarly for spline curves the complexity of an edge may be measured by the number of control points on the edge.
  • Several commonly used quality measures concern lengths of edges: it is generally desirable to minimize the total length of the edges as well as the maximum length of any edge. Additionally, it may be preferable for the lengths of edges to be uniform rather than highly varied.
  • Angular resolution is a measure of the sharpest angles in a graph drawing. If a graph has vertices with high degree then it necessarily will have small angular resolution, but the angular resolution can be bounded below by a function of the degree.[12]
  • The slope number of a graph is the minimum number of distinct edge slopes needed in a drawing with straight line segment edges (allowing crossings). Cubic graphs have slope number at most four, but graphs of degree five may have unbounded slope number; it remains open whether the slope number of degree-4 graphs is bounded.[12]

Layout methods

[edit]
A force-based network visualization.[13]
Spectral graph layout visualization.

There are many different graph layout strategies:

  • In force-based layout systems, the graph drawing software modifies an initial vertex placement by continuously moving the vertices according to a system of forces based on physical metaphors related to systems of springs or molecular mechanics. Typically, these systems combine attractive forces between adjacent vertices with repulsive forces between all pairs of vertices, in order to seek a layout in which edge lengths are small while vertices are well-separated. These systems may perform gradient descent based minimization of an energy function, or they may translate the forces directly into velocities or accelerations for the moving vertices.[14]
  • Spectral layout methods use as coordinates the eigenvectors of a matrix such as the Laplacian derived from the adjacency matrix of the graph.[15]
  • Orthogonal layout methods, which allow the edges of the graph to run horizontally or vertically, parallel to the coordinate axes of the layout. These methods were originally designed for VLSI and PCB layout problems but they have also been adapted for graph drawing. They typically involve a multiphase approach in which an input graph is planarized by replacing crossing points by vertices, a topological embedding of the planarized graph is found, edge orientations are chosen to minimize bends, vertices are placed consistently with these orientations, and finally a layout compaction stage reduces the area of the drawing.[16]
  • Tree layout algorithms these show a rooted tree-like formation, suitable for trees. Often, in a technique called "balloon layout", the children of each node in the tree are drawn on a circle surrounding the node, with the radii of these circles diminishing at lower levels in the tree so that these circles do not overlap.[17]
  • Layered graph drawing methods (often called Sugiyama-style drawing) are best suited for directed acyclic graphs or graphs that are nearly acyclic, such as the graphs of dependencies between modules or functions in a software system. In these methods, the nodes of the graph are arranged into horizontal layers using methods such as the Coffman–Graham algorithm, in such a way that most edges go downwards from one layer to the next; after this step, the nodes within each layer are arranged in order to minimize crossings.[18]
Arc diagram
  • Arc diagrams, a layout style dating back to the 1960s,[19] place vertices on a line; edges may be drawn as semicircles above or below the line, or as smooth curves linked together from multiple semicircles.
  • Circular layout methods place the vertices of the graph on a circle, choosing carefully the ordering of the vertices around the circle to reduce crossings and place adjacent vertices close to each other. Edges may be drawn either as chords of the circle or as arcs inside or outside of the circle. In some cases, multiple circles may be used.[20]
  • Dominance drawing places vertices in such a way that one vertex is upwards, rightwards, or both of another if and only if it is reachable from the other vertex. In this way, the layout style makes the reachability relation of the graph visually apparent.[21]

Application-specific graph drawings

[edit]

Graphs and graph drawings arising in other areas of application include

In addition, the placement and routing steps of electronic design automation (EDA) are similar in many ways to graph drawing, as is the problem of greedy embedding in distributed computing, and the graph drawing literature includes several results borrowed from the EDA literature. However, these problems also differ in several important ways: for instance, in EDA, area minimization and signal length are more important than aesthetics, and the routing problem in EDA may have more than two terminals per net while the analogous problem in graph drawing generally only involves pairs of vertices for each edge.

Graph drawing algorithms

[edit]

There are many algorithms for graph drawing. Among them are:

  • The Reingold-Tilford algorithm for tree drawing.[28]
  • Kant's algorithm,[29] which constructs a polyline drawing of a 3-connected planar graph such that the size of the minimal angle among arcs is at least , where d is the maximal node degree; and its generaliztion, that also works well for other planar graphs, by Gutwenger and Mutzel.[30]
  • Tamassia's algorithm for minimizing the number of bends in an orthogonal representation of a planar graph.[31]
  • The Magnetic Spring Model by Sugiyama and Misue.[32]

Software

[edit]
A graph drawing interface (Gephi 0.9.1)

Software, systems, and providers of systems for drawing graphs include:

  • BioFabric open-source software for visualizing large networks by drawing nodes as horizontal lines.
  • Cytoscape, open-source software for visualizing molecular interaction networks
  • Gephi, open-source network analysis and visualization software
  • graph-tool, a free/libre Python library for analysis of graphs
  • Graphviz, an open-source graph drawing system from AT&T Corporation[33]
  • Linkurious, a commercial network analysis and visualization software for graph databases
  • Mathematica, a general-purpose computation tool that includes 2D and 3D graph visualization and graph analysis tools.[34]
  • Microsoft Automatic Graph Layout, open-source .NET library (formerly called GLEE) for laying out graphs[35]
  • NetworkX is a Python library for studying graphs and networks.
  • Tulip,[36] an open-source data visualization tool
  • yEd, a graph editor with graph layout functionality[37]
  • PGF/TikZ 3.0 with the graphdrawing package (requires LuaTeX).[38]
  • LaNet-vi, an open-source large network visualization software
  • OGDF, an open-source library of C++ data structures and algorithms, mostly for graph drawing[39]

See also

[edit]

References

[edit]

Further reading

[edit]
[edit]
Revisions and contributorsEdit on WikipediaRead on Wikipedia
from Grokipedia
Graph drawing is the algorithmic discipline dedicated to producing visual representations of graphs—abstract structures consisting of vertices as entities and edges as relationships—by assigning geometric coordinates to vertices and rendering edges as lines or curves to facilitate comprehension and analysis. These drawings emphasize through aesthetic criteria such as minimizing edge crossings, bends, and overlaps, while maximizing and uniform edge lengths to reveal the underlying graph structure. The field intersects , , and , with conventions including grid-based placements on integer coordinates, polyline edges formed by line segments, straight-line connections, and orthogonal drawings restricted to horizontal and vertical segments. The origins of graph drawing trace to early , notably Leonhard Euler's 1736 solution to the bridge problem, which formalized graphs without explicit visualization but inspired subsequent representational needs. By the 18th and 19th centuries, applications emerged in (e.g., René Haüy's 1784 lattice diagrams) and molecular chemistry (e.g., Alexander Crum Brown's 1864 depictions of chemical bonds), evolving into systematic algorithms in the . Key milestones include planarity tests by Kuratowski (1930) and Kurt Wagner (1937), straight-line drawing theorems for planar graphs by István Fáry (1948), and force-directed methods pioneered by in the 1960s, which model vertices as particles repelling via simulated springs. Workshops like Graph Drawing '92 in and '94 in Princeton marked the field's maturation, fostering research in 2D and 3D layouts. Major algorithmic paradigms include force-directed approaches, which iteratively adjust positions to balance attractive and repulsive forces for symmetric layouts, particularly effective for general undirected graphs; planar drawing methods, ensuring crossing-free embeddings for planar graphs via techniques like or visibility representations; and hierarchical layouts for directed acyclic graphs, layering nodes by rank to support flow visualization, as in the Sugiyama framework (1981). Specialized algorithms address subclasses, such as Reingold–Tilford for layered drawings minimizing width, or polyline methods achieving linear-time for certain planar graphs (e.g., Kant, 1996). Challenges persist in non-planar graphs, requiring planarization or 3D extensions, and in optimizing metrics like drawing area or bend minimization. Applications of graph drawing are diverse and impactful, underpinning VLSI circuit design for chip layouts, software engineering via UML diagrams and database schemas, network visualization in computer systems, and bioinformatics for molecular pathways. In social sciences, it enables sociograms; in architecture, floor plans; and in user interfaces, interactive explorations of complex data. Ongoing research emphasizes dynamic and interactive drawings, evaluation benchmarks, and integration with machine learning to automate aesthetic improvements.

Fundamentals

Definition and Basic Principles

Graph drawing is the algorithmic process of visualizing an abstract graph by mapping its vertices to points in the (or higher-dimensional space) and representing its edges as curves or line segments connecting those points, with the goal of producing a clear and informative layout. This distinguishes between the abstract combinatorial structure of the graph and its geometric realization, where the positions of vertices and the paths of edges determine the visual properties such as crossings and readability. At its core, graph drawing operates on graphs defined in , where an undirected graph G=(V,E)G = (V, E) consists of a set VV of vertices and a set EE of edges connecting pairs of vertices, without self-loops or multiple edges between the same pair in simple graphs; multigraphs allow multiple edges, while directed graphs incorporate edge orientations. Common drawing styles include straight-line drawings, where edges are line segments; polyline drawings, where edges are polygonal chains; and orthogonal drawings, where edges consist of horizontal and vertical segments. A fundamental objective in many embeddings, particularly planar ones, is to minimize the total edge length, formulated as uvEpupv\sum_{uv \in E} \| p_u - p_v \|, where pip_i denotes the position of vertex ii. The scope of graph drawing encompasses both static drawings for fixed graphs and dynamic drawings that adapt to changes in the graph structure over time, often requiring smooth animations between layouts; it also extends to 2D and 3D spaces, though 2D remains the primary focus for readability.

Historical Development

The theoretical foundations of graph drawing trace back to early 20th-century results on s. In 1936, Klaus Wagner proved that every admits a straight-line without crossings, establishing a key property for geometric representations. Independently, in 1948, István Fáry extended this by showing that any simple can be drawn with straight-line edges, providing the first rigorous guarantee for crossing-free straight-line drawings. These results laid the groundwork for algorithmic approaches but were primarily theoretical, predating computational applications. The practical development of graph drawing algorithms began in the with the advent of . A seminal contribution was W.T. Tutte's 1963 method for embedding 3-connected planar graphs using barycentric coordinates, which produced straight-line drawings by solving a based on spring-like forces. This marked one of the earliest force-directed techniques, bridging and . The saw further advancements: Kozo Sugiyama and colleagues introduced the layered drawing framework in 1981 for hierarchical directed graphs, emphasizing topological ordering and edge bundling to enhance readability. Peter Eades followed in 1984 with a heuristic spring-embedder model for general undirected graphs, simulating physical forces to minimize edge crossings and optimize . These methods established core paradigms for automated visualization. The 1990s formalized the field through dedicated research and resources. The first International Symposium on Graph Drawing was held in 1992 near Rome, Italy, fostering a dedicated community and annual proceedings that advanced algorithmic and aesthetic criteria. A landmark publication, the 1999 book Graph Drawing: Algorithms for the Visualization of Graphs by Giuseppe Di Battista, Peter Eades, Roberto Tamassia, and Ioannis G. Tollis, synthesized foundational techniques and became a standard reference for researchers. Entering the 2000s, the focus shifted toward scalability for large networks, with force-directed methods adapted to handle graphs exceeding 100,000 vertices through approximations and parallelization; extensions to 3D drawings also gained traction for immersive visualizations. Software tools like (1991 onward), Cytoscape (2003), and (2008) integrated these algorithms, enabling practical deployment in domains such as and social sciences. Post-2010 developments emphasized applications, driven by the explosion of network data in , bioinformatics, and . The Graph Drawing symposia reflected this evolution, with the 31st in Palermo, (2023), the 32nd in Vienna, (2024), and the 33rd in , (2025), increasingly featuring tracks on dynamic, massive-scale, and interactive visualizations. This period saw innovations in stress-minimizing layouts and hybrid methods to address scalability challenges, underscoring graph drawing's role in interpreting complex real-world networks.

Visual Conventions

Node and Edge Representations

In graph drawing, nodes representing vertices are commonly depicted as simple geometric shapes such as circles, ellipses, or points to facilitate clear identification and positioning in the plane. These shapes are chosen for their neutrality and minimal visual clutter, allowing focus on relational structures rather than ornate designs. Node size can encode attributes like vertex degree, with larger diameters indicating higher connectivity, while colors differentiate node types or clusters, enhancing interpretability in complex graphs. Labels, typically textual identifiers, are placed adjacent to nodes, often outside or within the shape if space permits, to avoid obscuring connections. Edges, representing connections between vertices, are visualized as lines or curves linking node centers to maintain relational clarity. Straight lines are preferred for their simplicity and directness in non-orthogonal layouts, promoting ease of tracing relationships. For orthogonal drawings, polylines with right-angle bends are used to align with grid structures, reducing angular ambiguity. Curved edges, such as splines or , appear in aesthetic-focused layouts to minimize visual crossings and improve flow . Edge thickness varies to denote weights, with thicker lines signaling stronger or more significant connections, while arrows at endpoints indicate directionality in directed graphs. Standard conventions adapt these representations to domain-specific needs for consistency and readability. In (UML) for software graphs, nodes for classes are rendered as rectangles containing compartments for attributes and methods, while edges use solid lines for associations and dashed lines for dependencies. Network diagrams often employ dashed or dotted lines for virtual or logical links to distinguish them from solid lines representing physical connections. A core convention across these visualizations is the avoidance of overlapping nodes or edges, ensuring distinct separation to prevent misinterpretation of adjacency or hierarchy.

Standard Notations and Symbols

In graph drawing, standard notations for graphs often begin with abstract representations such as adjacency matrices, where rows and columns correspond to vertices and entries indicate the presence or absence of edges between them. However, when transitioning to visual drawings, vertices are typically denoted by alphanumeric labels, such as single letters (e.g., v_1, u) or identifiers representing entities like nodes in a network. Edge notations in drawings include labels for attributes like weights or costs, often placed along the line segments to convey quantitative information without altering the geometric layout. Symbols for edges distinguish between undirected and directed graphs through simple visual cues: undirected edges are represented as plain straight or curved lines connecting two vertices, implying bidirectional connectivity, while directed edges incorporate arrowheads at one endpoint to indicate the orientation of the relationship. These conventions ensure clarity in interpreting flow or association, with arrowheads typically styled as filled triangles or chevrons for emphasis. Clusters or groups of vertices, such as subgraphs or communities, are commonly enclosed by bounding boxes—rectangular outlines—or differentiated via distinct colors to highlight modular structures without overlapping individual elements. Domain-specific adaptations extend these notations for interpretability in specialized fields. In biological network visualizations, nodes representing genes or proteins may use icons like ovals for simple entities or cut-corner rectangles (octagons) for complexes, following the Graphical Notation (SBGN) to standardize process descriptions and entity relationships. For social networks, vertices often incorporate user avatars or profile icons instead of generic labels, allowing quick recognition of individuals or groups while maintaining edge symbols for interactions like friendships or follows. Flowcharts, a of graph drawings, adhere to ISO 5807 standards, employing symbols such as rectangles for processes, diamonds for decisions, and arrows for directional flow between elements. Tools like with the TikZ package facilitate precise symbolic rendering in academic and technical drawings, enabling customizable vertex shapes, edge arrows, and labels through declarative code that avoids manual positioning errors. In multi-edge graphs, where multiple connections exist between the same pair of vertices, ambiguity is mitigated by parallel , distinct line styles (e.g., dashed vs. solid), or explicit numeric labels on each edge to differentiate instances.

Quality Evaluation

Aesthetic Criteria

Aesthetic criteria in graph drawing refer to a set of principles aimed at enhancing the visual appeal and of graph layouts, often balancing subjective human preferences with objective geometric properties. These criteria guide the design of algorithms to produce drawings that facilitate comprehension of graph , such as relationships between nodes and edges. While some criteria are qualitative, others can be quantified through metrics, serving as optimization targets in layout methods. has validated that adhering to these criteria improves user task performance, particularly in domains like software visualization and network analysis. Key aesthetic criteria include uniform edge lengths, where edges are ideally of similar length to avoid visual imbalance; minimal bends, preferring straight or low-curvature edges for clarity; and , which exploits graph symmetries to create balanced, intuitive layouts. balance seeks a drawing whose bounding has a width-to-height ratio close to 1, suitable for standard displays without excessive whitespace. Readability is further enhanced by node-edge separation, ensuring sufficient distance between non-adjacent vertices and edges to prevent overlaps. These elements collectively contribute to a drawing's overall coherence, though they often involve trade-offs, such as prioritizing uniform edge lengths over . A seminal framework for these criteria was proposed by Helen C. Purchase, identifying seven common aesthetics derived from graph drawing literature and validated through user studies. These are:
  • Minimize bends: Reduce the total number of direction changes in polyline edges to promote smoothness.
  • Node distribution: Evenly spread nodes within the bounding box to avoid clustering and improve spatial uniformity.
  • Edge variation: Maintain uniform edge lengths to enhance perceptual consistency.
  • Direction of flow: Align edges in a consistent direction, often top-to-bottom or left-to-right, to suggest .
  • Orthogonality: Align edges and nodes to a grid, minimizing diagonal lines for a structured appearance.
  • Edge lengths: Keep edges short but not excessively so, balancing density and visibility.
  • Symmetry: Display symmetric substructures where possible, leveraging human bias toward balanced forms.
Purchase's experiments demonstrated trade-offs, such as conflicting with edge length uniformity, where enforcing grid alignment can elongate some edges. Additional quantitative concepts include edge straightness, which favors straight-line edges over polylines to reduce ; , defined as the minimum angle θ\theta between two adjacent edges at a vertex, ideally approaching 360/d(v)360^\circ / d(v) where d(v)d(v) is the vertex degree to avoid acute angles; and vertex resolution, the minimum between any two vertices, ensuring distinct node placement. Node-edge separation extends this to the minimum distance between a vertex and a non-incident edge, preventing visual clutter. High and vertex resolutions are crucial for in dense graphs. Empirical studies from the , including those by Purchase, revealed user preferences for layouts, with participants showing faster comprehension and higher accuracy in tasks like identifying graph properties when was present, though its impact varied by graph type. For instance, in UML class diagrams, and uniform edge lengths significantly boosted performance over asymmetric alternatives. These findings underscore that while not all criteria equally affect , and edge uniformity are robustly preferred across domains.

Planarity and Crossing Metrics

In graph drawing, planarity refers to the property of a graph that allows it to be embedded in the plane without any edge crossings, meaning vertices are represented as points and edges as non-intersecting curves connecting them. A graph possessing this property is called planar, and such an preserves the graph's combinatorial structure while ensuring topological embeddability. Kuratowski's theorem provides a precise characterization of non-planar graphs: a finite undirected graph is planar it contains no subgraph that is a subdivision of the K5K_5 or the K3,3K_{3,3}. These forbidden subgraphs serve as the minimal obstructions to planarity, enabling algorithmic tests for embeddability by searching for such subdivisions. For non-planar graphs, crossing metrics quantify the extent of unavoidable edge intersections in drawings. The crossing number cr(G)\mathrm{cr}(G) of a graph GG is defined as the minimum number of edge crossings over all possible drawings in the plane, where a crossing occurs at the intersection point of two edges that do not share a vertex. This metric counts the total number of such intersection points, assuming a simple drawing where edges intersect transversely and at most once per pair; an edge crossing pair refers to a pair of non-adjacent edges that intersect in the drawing. Computing cr(G)\mathrm{cr}(G) exactly is NP-complete, even for restricted classes of graphs. Upper bounds on cr(G)\mathrm{cr}(G) provide insight into the scale of crossings; for a graph with n=Vn = |V| vertices, a trivial bound is cr(G)(E2)\mathrm{cr}(G) \le \binom{|E|}{2}, but improved estimates show cr(G)=O(n4)\mathrm{cr}(G) = O(n^4) in the worst case, as realized by complete graphs where cr(Kn)14n/22(n1)/22\mathrm{cr}(K_n) \le \frac{1}{4} \lfloor n/2 \rfloor^2 \lfloor (n-1)/2 \rfloor^2. Fáry's establishes that every admits a straight-line without crossings, where edges are represented as line segments, bridging combinatorial planarity with geometric realizations. In dense graphs, where edge density approaches O(n2)O(n^2), crossing metrics often normalize the total crossings to assess impact; for instance, the average number of crossings per edge, computed as cr(G)/E\mathrm{cr}(G) / |E|, highlights how intersections distribute across edges, with values exceeding 1 indicating significant clutter in optimal drawings. Crossing density, defined as cd(G)=cr(G)/n4\mathrm{cd}(G) = \mathrm{cr}(G) / n^4, further scales this for dense cases, approaching constants like 1/64 for complete graphs to quantify topological complexity.

Core Layout Techniques

Force-Directed Methods

Force-directed methods are a class of graph drawing algorithms inspired by physical systems, where nodes are modeled as particles that repel each other, and edges act as springs that attract connected nodes toward an equilibrium state. This simulation seeks a layout where repulsive forces between all pairs of nodes balance the attractive forces along edges, resulting in a configuration that minimizes overall energy and promotes even distribution of nodes. The approach is particularly effective for undirected graphs, producing organic, aesthetically pleasing layouts without requiring specific graph properties like planarity. One of the earliest and most influential algorithms is the Kamada-Kawai method, which minimizes an energy function defined as
E=i<j12ki,j(pipjli,j)2,E = \sum_{i < j} \frac{1}{2} k_{i,j} \left( \| \mathbf{p}_i - \mathbf{p}_j \| - l_{i,j} \right)^2,
where pi\mathbf{p}_i and pj\mathbf{p}_j are the positions of nodes ii and jj, li,jl_{i,j} is the ideal distance based on graph-theoretic shortest paths (scaled by a constant LL), and ki,jk_{i,j} is a stiffness coefficient inversely proportional to the square of the shortest path distance. This formulation treats the layout as an optimization problem, aiming to make geometric distances approximate graph distances.
The Fruchterman-Reingold algorithm builds on this spring model with explicit force definitions: attractive forces fa(d)=d2kf_a(d) = \frac{d^2}{k} pulling connected nodes together, and repulsive forces fr(d)=k2df_r(d) = -\frac{k^2}{d} pushing all nodes apart, where dd is the distance between nodes and kk is a scaling factor derived from the graph's area and number of vertices (k=CareaVk = C \sqrt{\frac{\text{area}}{|V|}}
Add your contribution
Related Hubs
Contribute something
User Avatar
No comments yet.