
Community hub
Recent from talks
Contribute something to knowledge base
Content stats: 0 posts, 0 articles, 1 media, 0 notes
Members stats: 0 subscribers, 0 contributors, 0 moderators, 0 supporters
Subscribers
Supporters
Contributors
Moderators
Hub AI
Ternary plot AI simulator
(@Ternary plot_simulator)
Hub AI
Ternary plot AI simulator
(@Ternary plot_simulator)
Ternary plot
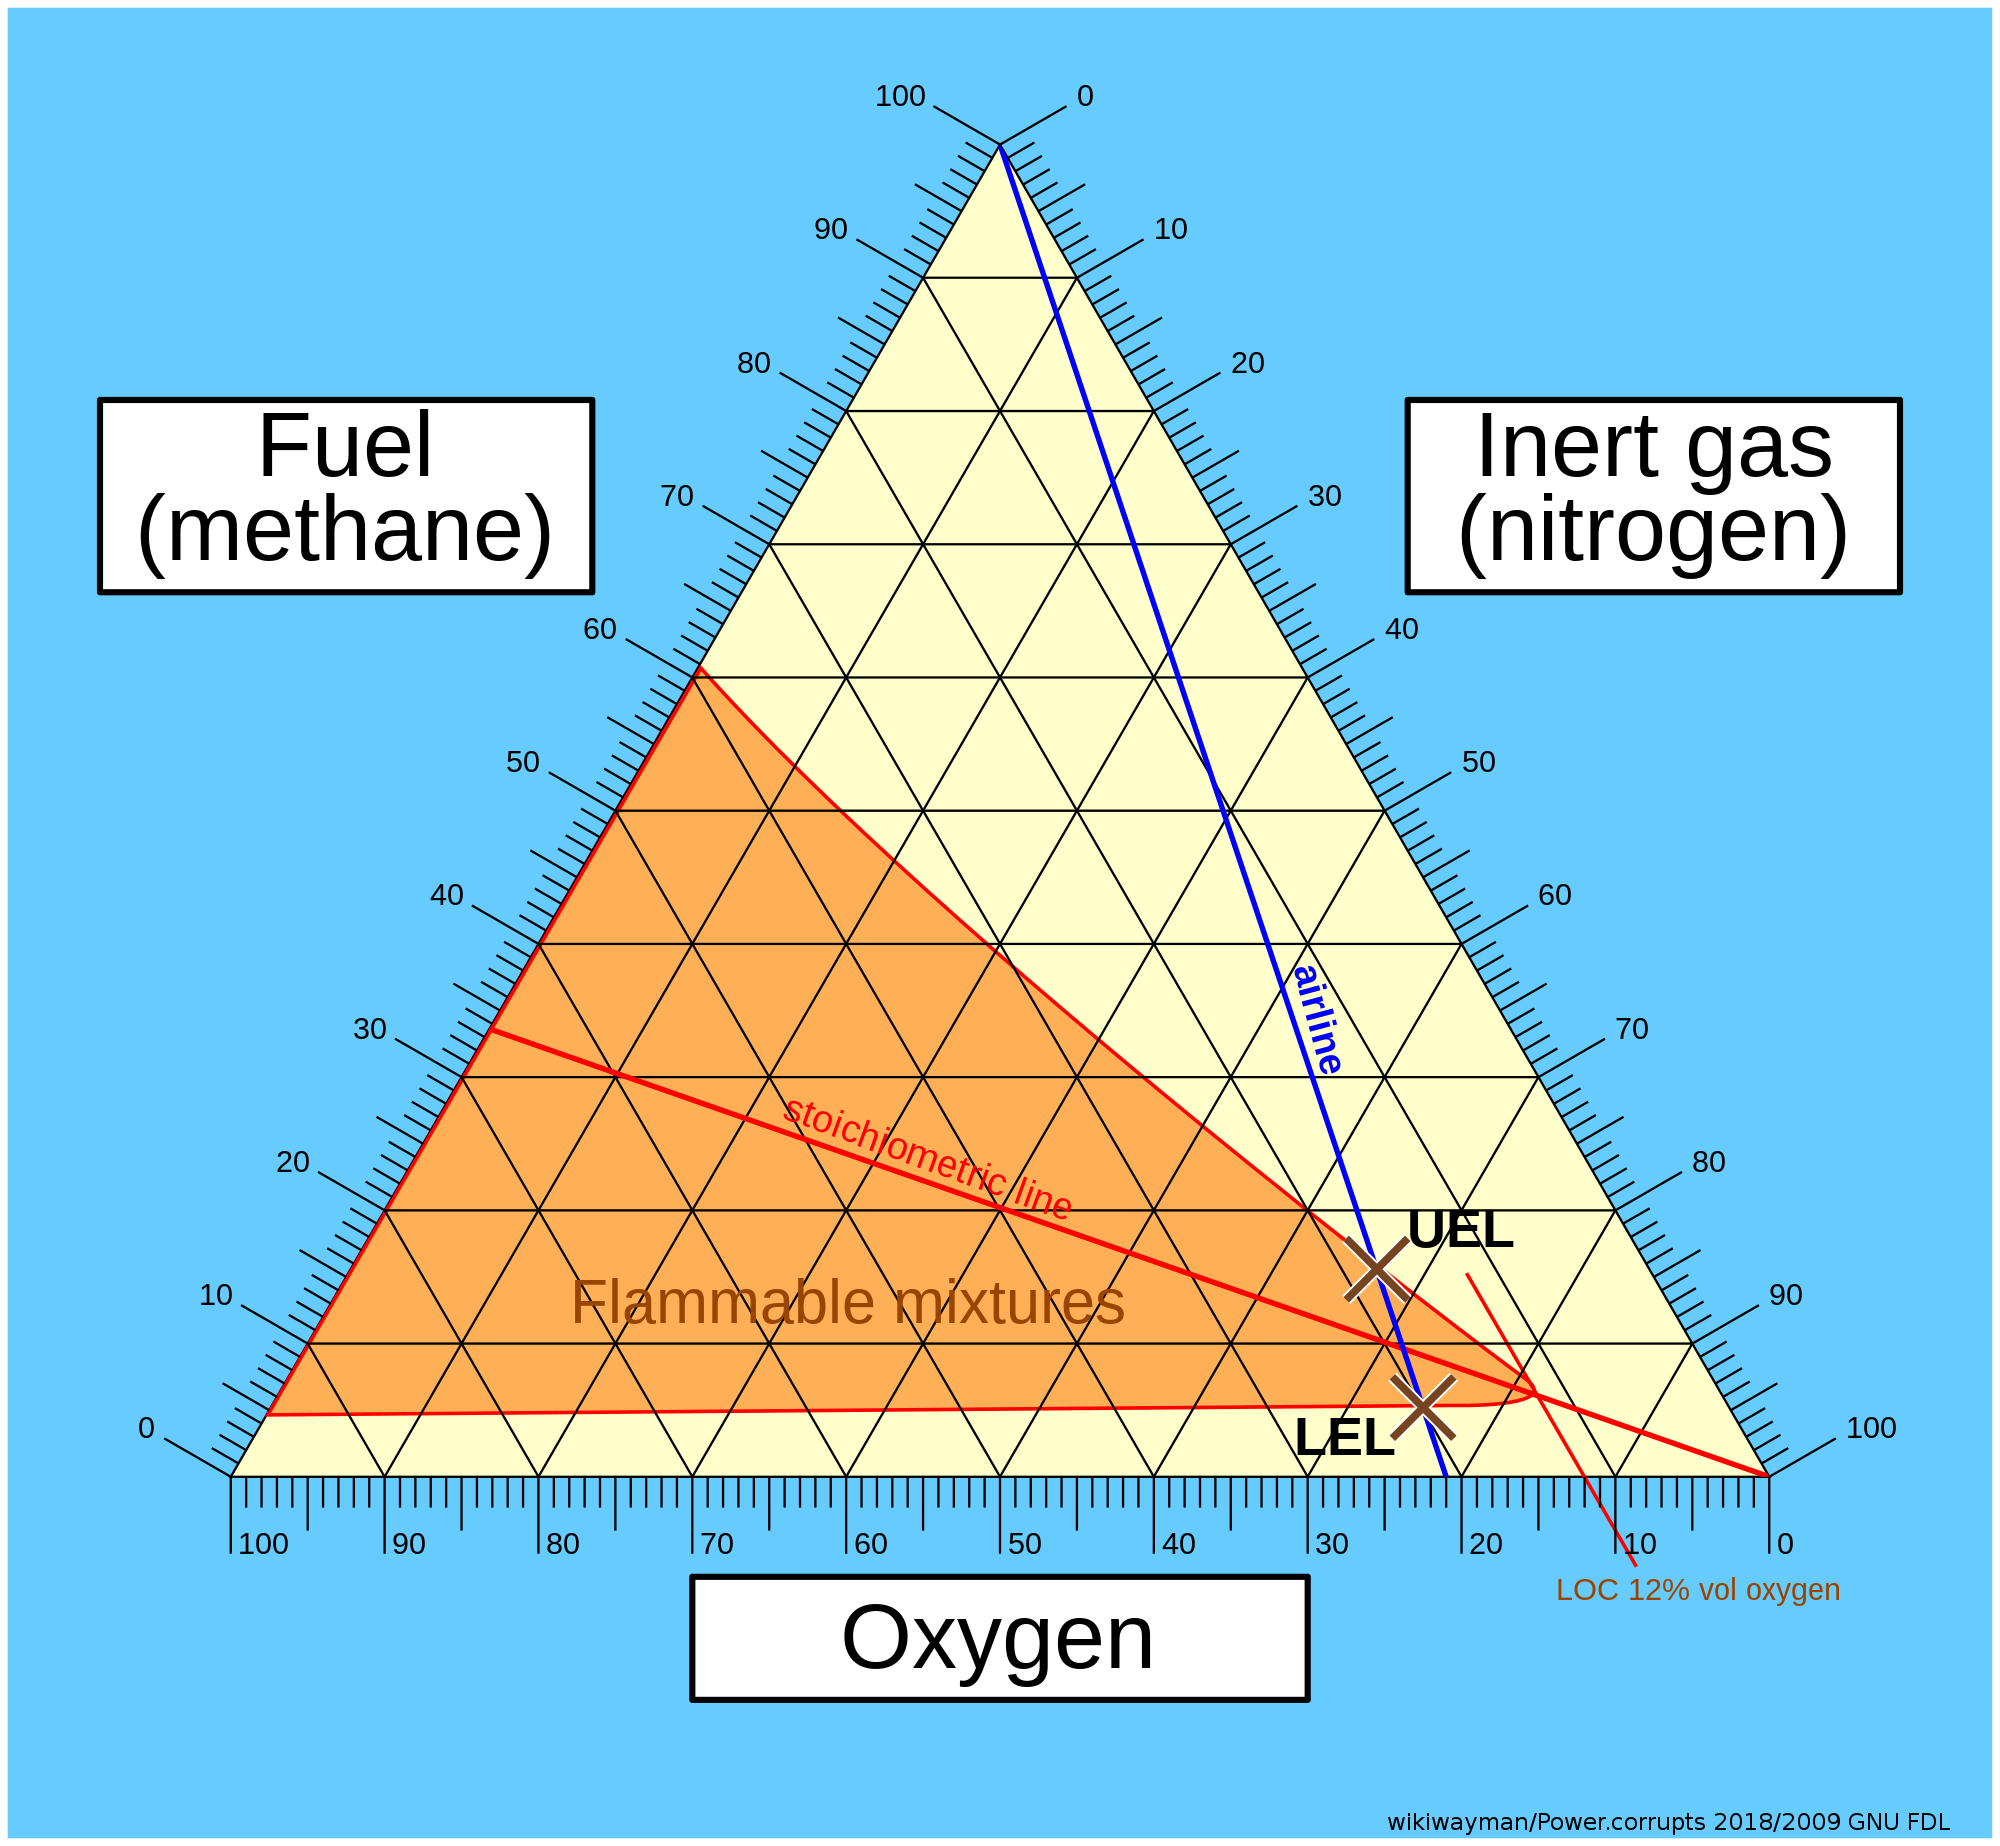
A ternary plot, ternary graph, triangle plot, simplex plot, or Gibbs triangle is a barycentric plot on three variables which sum to a constant. It graphically depicts the ratios of the three variables as positions in an equilateral triangle. It is used in physical chemistry, petrology, mineralogy, metallurgy, and other physical sciences to show the compositions of systems composed of three species. Ternary plots are tools for analyzing compositional data in the three-dimensional case.
In population genetics, a triangle plot of genotype frequencies is called a de Finetti diagram. In game theory and convex optimization, it is often called a simplex plot.
In a ternary plot, the values of the three variables a, b, and c must sum to some constant, K. Usually, this constant is represented as 1.0 or 100%. Because a + b + c = K for all substances being graphed, any one variable is not independent of the others, so only two variables must be known to find a sample's point on the graph: for instance, c must be equal to K − a − b. Because the three numerical values cannot vary independently—there are only two degrees of freedom—it is possible to graph the combinations of all three variables in only two dimensions.
The advantage of using a ternary plot for depicting chemical compositions is that three variables can be conveniently plotted in a two-dimensional graph. Ternary plots can also be used to create phase diagrams by outlining the composition regions on the plot where different phases exist.
The values of a point on a ternary plot correspond (up to a constant) to its trilinear coordinates or barycentric coordinates.
There are three equivalent methods that can be used to determine the values of a point on the plot:
A displacement along a parallel line (grid line) preserves the sum of two values, while motion along a perpendicular line increases (or decreases) the two values an equal amount, each half of the decrease (increase) of the third value. Motion along a line through a corner preserves the ratio of the other two values.
Figure (1) shows an oblique projection of point P(a,b,c) in a 3-dimensional Cartesian space with axes a, b and c, respectively.
Ternary plot
A ternary plot, ternary graph, triangle plot, simplex plot, or Gibbs triangle is a barycentric plot on three variables which sum to a constant. It graphically depicts the ratios of the three variables as positions in an equilateral triangle. It is used in physical chemistry, petrology, mineralogy, metallurgy, and other physical sciences to show the compositions of systems composed of three species. Ternary plots are tools for analyzing compositional data in the three-dimensional case.
In population genetics, a triangle plot of genotype frequencies is called a de Finetti diagram. In game theory and convex optimization, it is often called a simplex plot.
In a ternary plot, the values of the three variables a, b, and c must sum to some constant, K. Usually, this constant is represented as 1.0 or 100%. Because a + b + c = K for all substances being graphed, any one variable is not independent of the others, so only two variables must be known to find a sample's point on the graph: for instance, c must be equal to K − a − b. Because the three numerical values cannot vary independently—there are only two degrees of freedom—it is possible to graph the combinations of all three variables in only two dimensions.
The advantage of using a ternary plot for depicting chemical compositions is that three variables can be conveniently plotted in a two-dimensional graph. Ternary plots can also be used to create phase diagrams by outlining the composition regions on the plot where different phases exist.
The values of a point on a ternary plot correspond (up to a constant) to its trilinear coordinates or barycentric coordinates.
There are three equivalent methods that can be used to determine the values of a point on the plot:
A displacement along a parallel line (grid line) preserves the sum of two values, while motion along a perpendicular line increases (or decreases) the two values an equal amount, each half of the decrease (increase) of the third value. Motion along a line through a corner preserves the ratio of the other two values.
Figure (1) shows an oblique projection of point P(a,b,c) in a 3-dimensional Cartesian space with axes a, b and c, respectively.
Recent media
Recent media