
Community hub
Recent from talks
Contribute something to knowledge base
Content stats: 0 posts, 0 articles, 1 media, 0 notes
Members stats: 0 subscribers, 0 contributors, 0 moderators, 0 supporters
Subscribers
Supporters
Contributors
Moderators
Hub AI
Venn diagram AI simulator
(@Venn diagram_simulator)
Hub AI
Venn diagram AI simulator
(@Venn diagram_simulator)
Venn diagram
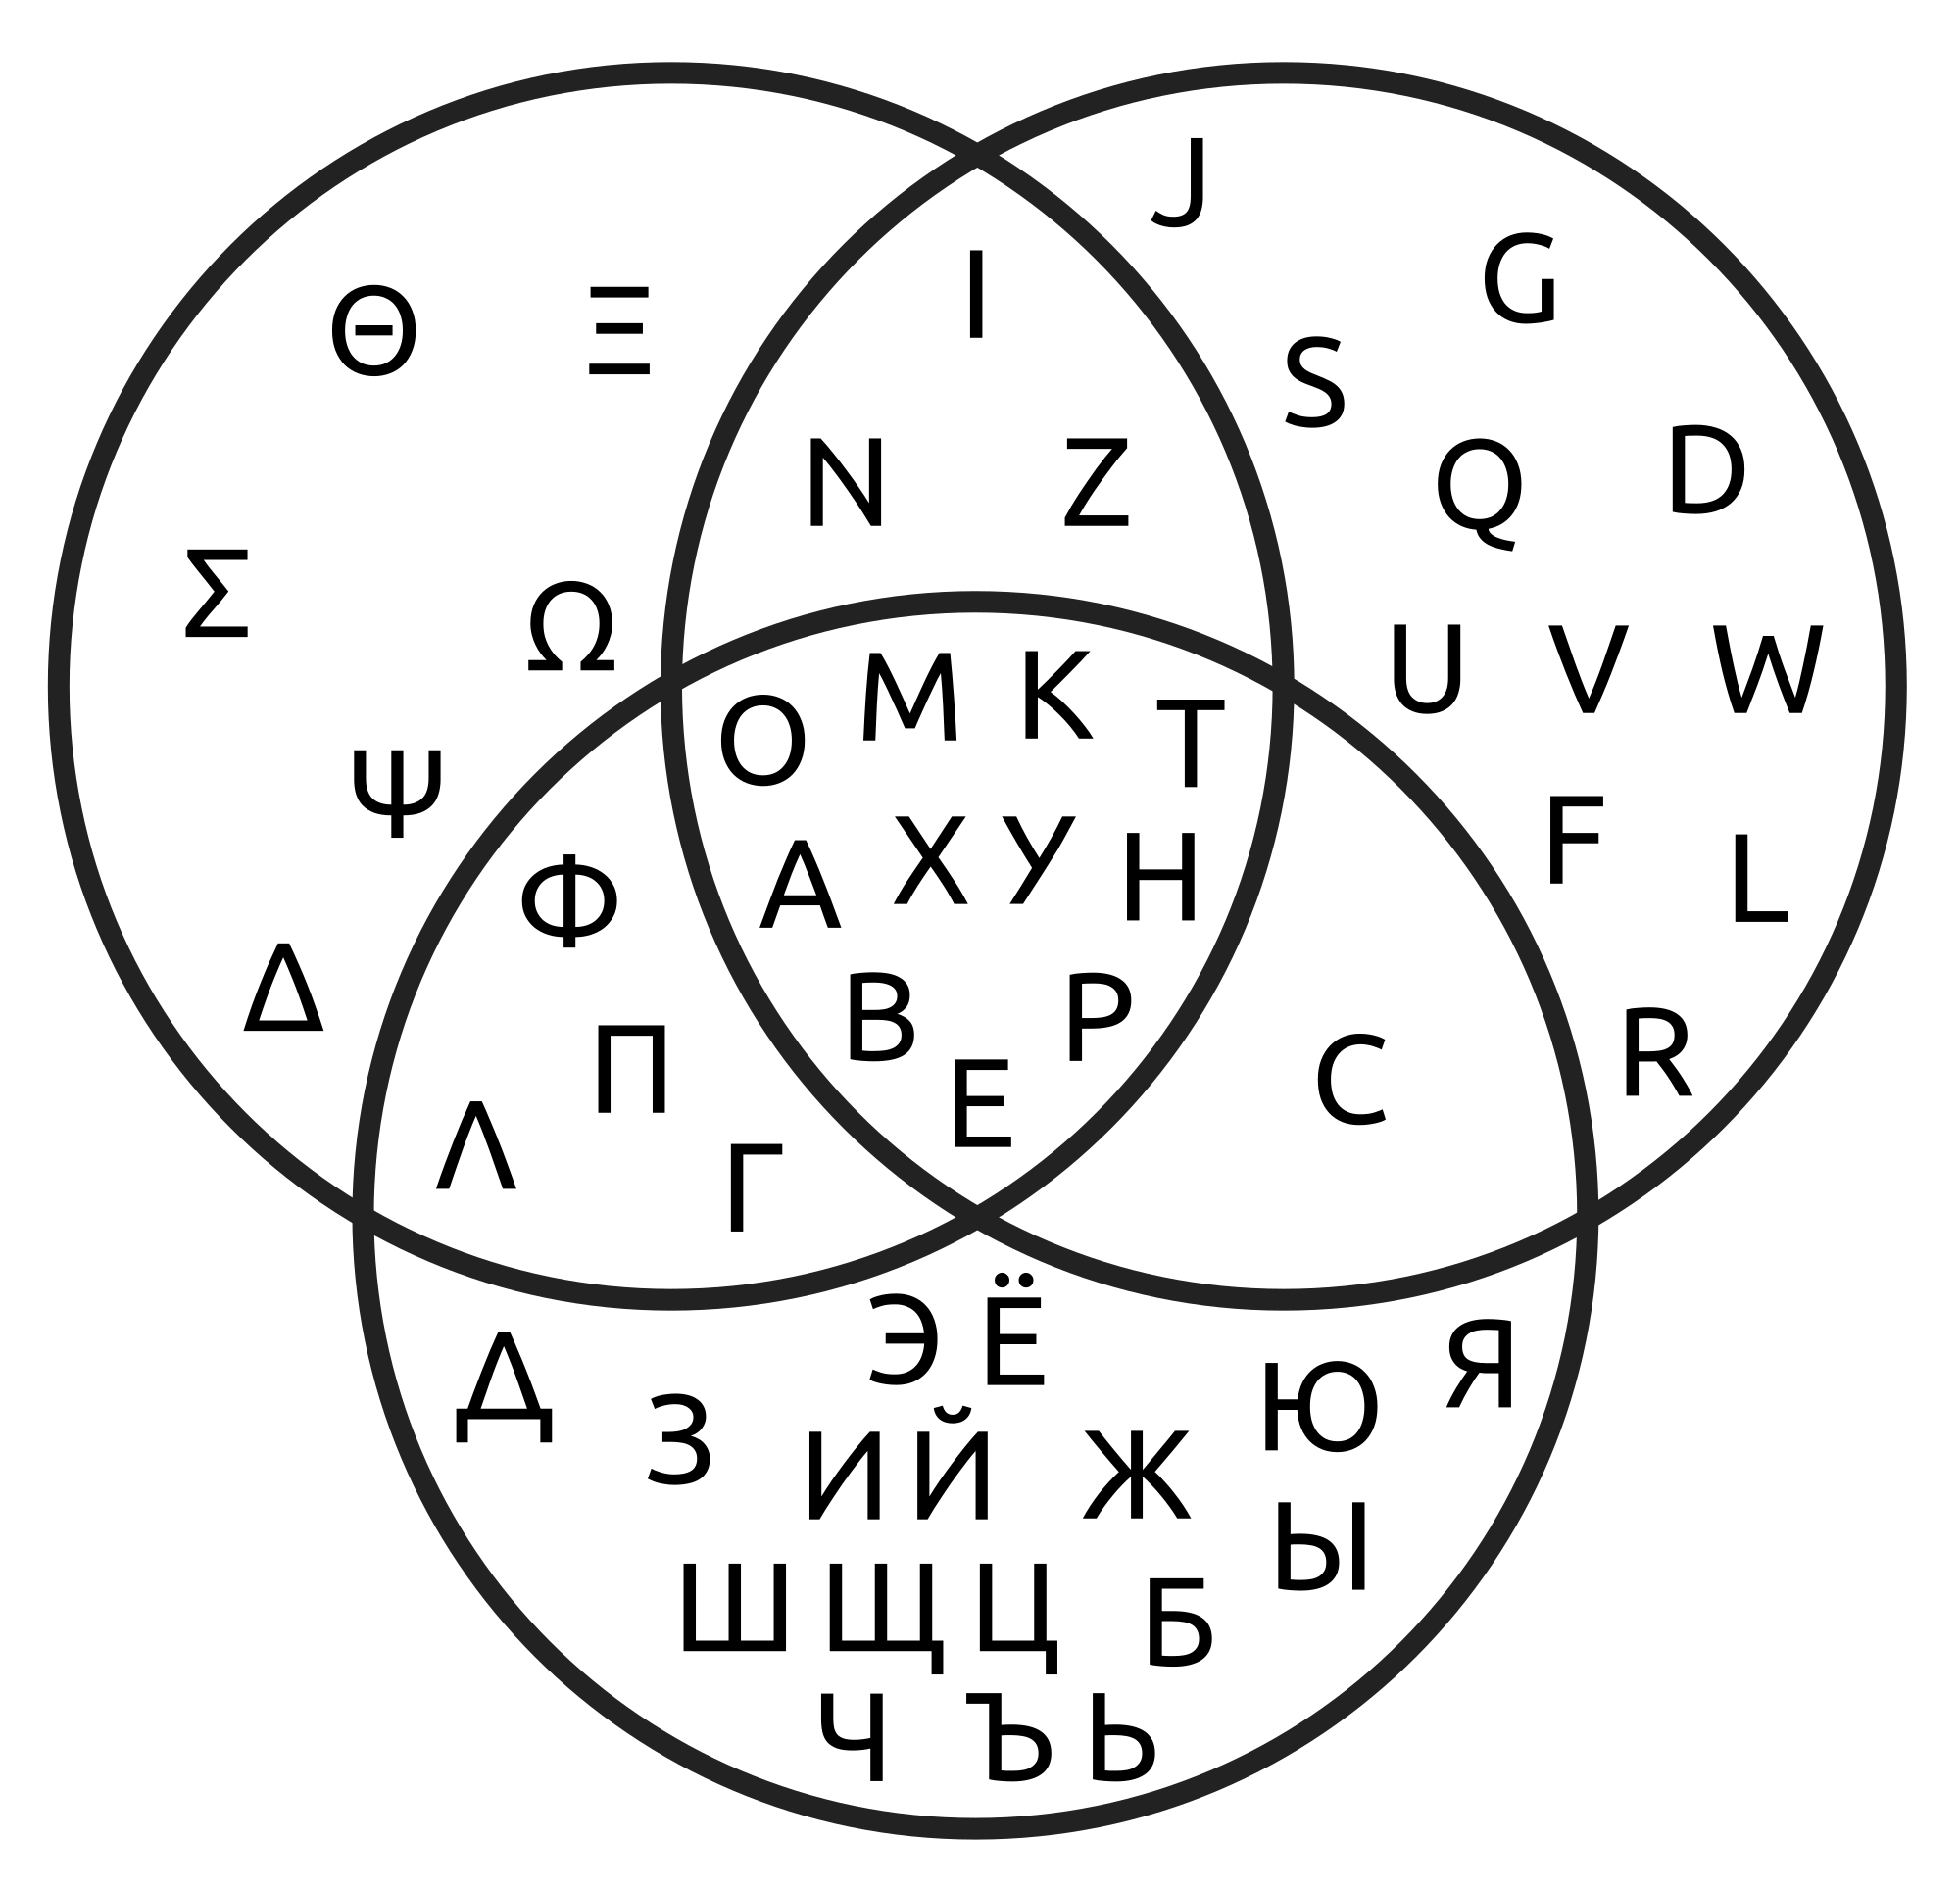
A Venn diagram is a widely used diagram style that shows the logical relation between sets, popularized by John Venn (1834–1923) in the 1880s. The diagrams are used to teach elementary set theory, and to illustrate simple set relationships in probability, logic, statistics, linguistics and computer science. A Venn diagram uses simple closed curves on a plane to represent sets. The curves are often circles or ellipses.
Similar ideas had been proposed before Venn such as by Christian Weise in 1712 (Nucleus Logicoe Wiesianoe) and Leonhard Euler in 1768 (Letters to a German Princess). The idea was popularised by Venn in Symbolic Logic, Chapter V "Diagrammatic Representation", published in 1881.
A Venn diagram, also called a set diagram or logic diagram, shows all possible logical relations between a finite collection of different sets. These diagrams depict elements as points in the plane, and sets as regions inside closed curves. A Venn diagram consists of multiple overlapping closed curves, usually circles, each representing a set. The points inside a curve labelled S represent elements of the set S, while points outside the boundary represent elements not in the set S. This lends itself to intuitive visualizations; for example, the set of all elements that are members of both sets S and T, denoted S ∩ T and read "the intersection of S and T", is represented visually by the area of overlap of the regions S and T.
In Venn diagrams, the curves are overlapped in every possible way, showing all possible relations between the sets. They are thus a special case of Euler diagrams, which do not necessarily show all relations. Venn diagrams were conceived around 1880 by John Venn. They are used to teach elementary set theory, as well as illustrate simple set relationships in probability, logic, statistics, linguistics, and computer science.
A Venn diagram in which the area of each shape is proportional to the number of elements it contains is called an area-proportional (or scaled) Venn diagram.
This example involves two sets of creatures, represented as overlapping circles: one circle that represents all types of creatures that have two legs, and another representing creatures that can fly. Each separate type of creature can be imagined as a point somewhere in the diagram. Living creatures that have two legs and can fly—for example, parrots—are then in both sets, so they correspond to points in the region where the two circles overlap. This overlapping region would only contain those elements (in this example, creatures) that are members of both the set of two-legged creatures and set of flying creatures.
Humans and penguins are bipedal, and so are in the "has two legs" circle, but since they cannot fly, they appear in the part of the that circle that does not overlap with the "can fly" circle. Mosquitoes can fly, but have six, not two, legs, so the point for mosquitoes is in the part of the "can fly" circle that does not overlap with the "has two legs" circle. Creatures that are neither two-legged nor able to fly (for example, whales and spiders) would all be represented by points outside both circles.
The combined region of the two sets is called their union, denoted by A ∪ B, where A is the "has two legs" circle and B the "can fly" circle. The union in this case contains all living creatures that either are two-legged or can fly (or both). The region included in both A and B, where the two sets overlap, is called the intersection of A and B, denoted by A ∩ B.
Venn diagram
A Venn diagram is a widely used diagram style that shows the logical relation between sets, popularized by John Venn (1834–1923) in the 1880s. The diagrams are used to teach elementary set theory, and to illustrate simple set relationships in probability, logic, statistics, linguistics and computer science. A Venn diagram uses simple closed curves on a plane to represent sets. The curves are often circles or ellipses.
Similar ideas had been proposed before Venn such as by Christian Weise in 1712 (Nucleus Logicoe Wiesianoe) and Leonhard Euler in 1768 (Letters to a German Princess). The idea was popularised by Venn in Symbolic Logic, Chapter V "Diagrammatic Representation", published in 1881.
A Venn diagram, also called a set diagram or logic diagram, shows all possible logical relations between a finite collection of different sets. These diagrams depict elements as points in the plane, and sets as regions inside closed curves. A Venn diagram consists of multiple overlapping closed curves, usually circles, each representing a set. The points inside a curve labelled S represent elements of the set S, while points outside the boundary represent elements not in the set S. This lends itself to intuitive visualizations; for example, the set of all elements that are members of both sets S and T, denoted S ∩ T and read "the intersection of S and T", is represented visually by the area of overlap of the regions S and T.
In Venn diagrams, the curves are overlapped in every possible way, showing all possible relations between the sets. They are thus a special case of Euler diagrams, which do not necessarily show all relations. Venn diagrams were conceived around 1880 by John Venn. They are used to teach elementary set theory, as well as illustrate simple set relationships in probability, logic, statistics, linguistics, and computer science.
A Venn diagram in which the area of each shape is proportional to the number of elements it contains is called an area-proportional (or scaled) Venn diagram.
This example involves two sets of creatures, represented as overlapping circles: one circle that represents all types of creatures that have two legs, and another representing creatures that can fly. Each separate type of creature can be imagined as a point somewhere in the diagram. Living creatures that have two legs and can fly—for example, parrots—are then in both sets, so they correspond to points in the region where the two circles overlap. This overlapping region would only contain those elements (in this example, creatures) that are members of both the set of two-legged creatures and set of flying creatures.
Humans and penguins are bipedal, and so are in the "has two legs" circle, but since they cannot fly, they appear in the part of the that circle that does not overlap with the "can fly" circle. Mosquitoes can fly, but have six, not two, legs, so the point for mosquitoes is in the part of the "can fly" circle that does not overlap with the "has two legs" circle. Creatures that are neither two-legged nor able to fly (for example, whales and spiders) would all be represented by points outside both circles.
The combined region of the two sets is called their union, denoted by A ∪ B, where A is the "has two legs" circle and B the "can fly" circle. The union in this case contains all living creatures that either are two-legged or can fly (or both). The region included in both A and B, where the two sets overlap, is called the intersection of A and B, denoted by A ∩ B.
Recent media
Recent media