
Community hub
Recent from talks
Contribute something
Nothing was collected or created yet.
Slugging percentage
View on Wikipedia
In baseball statistics, slugging percentage (SLG) is a measure of the batting productivity of a hitter. It is calculated as total bases divided by at-bats, through the following formula, where AB is the number of at-bats for a given player, and 1B, 2B, 3B, and HR are the number of singles, doubles, triples, and home runs, respectively:

Unlike batting average, slugging percentage gives more weight to extra-base hits such as doubles and home runs, relative to singles. Batters who excel at getting extra-base hits are sometimes referred to as sluggers.[2] Plate appearances resulting in walks, hit-by-pitches, catcher's interference, and sacrifice bunts or flies are specifically excluded from this calculation, as such an appearance is not counted as an at-bat (these are not factored into batting average either).
The name is a misnomer, as the statistic is not a percentage but an average of how many bases a player achieves per at bat. It is a scale of measure whose computed value is a number from 0 to 4. A Major League Baseball player's slugging percentage is almost always less than 1 because a majority of at bats result in either 0 or 1 base. The stat awards a double twice the value of a single, a triple three times the value, and a home run four times.[3] The slugging percentage would have to be divided by 4 to actually be a percentage (of bases achieved per at bat out of total bases possible). As a result, it is occasionally called slugging average, or simply slugging, instead.[4]
A slugging percentage is usually expressed as a decimal to three decimal places and is generally spoken as if multiplied by 1000. For example, a slugging percentage of .589 would be spoken as "five eighty-nine." The slugging percentage can also be applied as an evaluative tool for pitchers. This is not as common but is referred to as "slugging-percentage against".[5]
In Major League Baseball
[edit]As an example: with the New York Yankees in 1920, Babe Ruth had 458 at bats during which he recorded 172 hits: 73 singles, 36 doubles, 9 triples, and 54 home runs.[6] This was (73 × 1) + (36 × 2) + (9 × 3) + (54 × 4) = 388 total bases. His total number of bases (388) divided by his total at-bats (458) is .847, which constitutes his slugging percentage for the season.[6]
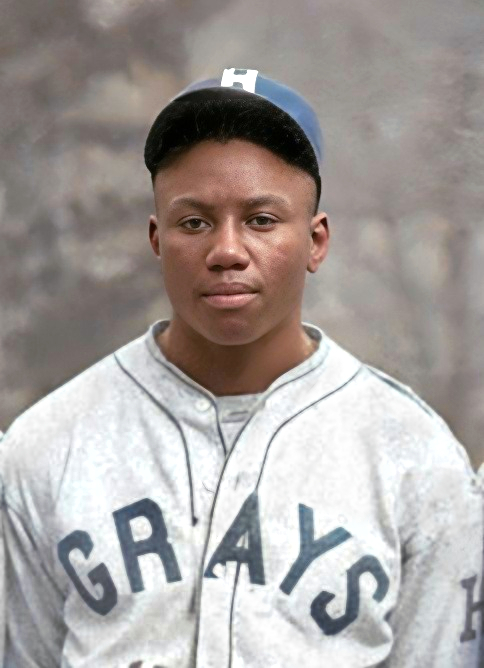
Ruth's 1920 figure set a record in Major League Baseball (MLB), which stood until 2001 when Barry Bonds achieved 411 bases in 476 at-bats for a slugging percentage of .863.[7][8] Josh Gibson, who played in Negro league baseball, had a slugging percentage of .974 in 1937.[8][a]
Until the 2024 incorporation of Negro league statistics into major league records, the MLB career leader in slugging percentage was Ruth (.6897), followed by Ted Williams (.6338) and Lou Gehrig (.6324).[10] Ruth was displaced by Josh Gibson, who has a career slugging percentage of .718.[11]
The maximum possible slugging percentage is 4.000.[3] A number of MLB players have had a 4.000 career slugging percentage for a short amount of time by hitting a home run in their first major league at bat. However, no player in MLB history has ever retired with a 4.000 slugging percentage. Four players have tripled in their only MLB plate appearance and therefore share the record—without consideration of a minimum number of games played or plate appearances—of a career slugging percentage of 3.000. They are Eric Cammack (2000 Mets); Scott Munninghoff (1980 Phillies); Eduardo Rodríguez (1973 Brewers); and Chuck Lindstrom (1958 White Sox).[12]
For the 2023 season, the average slugging percentage for all players in MLB was .414. The highest single-season league average was .437 in 2000, and the lowest was .305 in 1908.[13]
Significance
[edit]Long after it was invented, slugging percentage gained new significance when baseball analysts realized that it combined with on-base percentage (OBP) to form a very good measure of a player's overall offensive production (OBP + SLG was originally referred to as "production" by baseball writer and statistician Bill James). A predecessor metric was developed by Branch Rickey in 1954. Rickey, in Life magazine, suggested that combining OBP with what he called "extra base power" (EBP) would give a better indicator of player performance than typical Triple Crown stats. EBP was a predecessor to slugging percentage.[14]
Allen Barra and George Ignatin were early adopters in combining the two modern-day statistics, multiplying them together to form what is now known as "SLOB" (Slugging × On-Base).[15] Bill James applied this principle to his runs created formula several years later (and perhaps independently), essentially multiplying SLOB × at bats to create the formula:

In 1984, Pete Palmer and John Thorn developed perhaps the most widespread means of combining slugging and on-base percentage: on-base plus slugging (OPS), which is a simple addition of the two values. Because it is easy to calculate, OPS has been used with increased frequency in recent years as a shorthand form to evaluate contributions as a batter.
In a 2015 article, Bryan Grosnick made the point that "on base" and "slugging" may not be comparable enough to be simply added together. "On base" has a theoretical maximum of 1.000 whereas "slugging" has a theoretical maximum of 4.000. The actual numbers do not show as big a difference, with Grosnick listing .350 as a good "on base" and .430 as a good "slugging." He goes on to say that OPS has the advantages of simplicity and availability and further states, "you'll probably get it 75% right, at least."[16]
See also
[edit]Notes
[edit]References
[edit]- ^ "All-Time MLB Player Hitting Stat Leaders". MLB.com. Retrieved 2025-01-09.
- ^ "Slugger Baseball Dictionary | Baseball Almanac". www.baseball-almanac.com. Retrieved 2025-06-30.
- ^ a b Baseball Scorekeeping: A Practical Guide to the Rules, Andres Wirkmaa, Jefferson, North Carolina, London: McFarland & Company, Inc., Publishers, 2003.
- ^ "Slugging Average All Time Leaders on Baseball Almanac".
- ^ "What is a Slugging Percentage". MLB.com.
- ^ a b "Babe Ruth". Retrosheet. Retrieved April 13, 2024.
- ^ "Barry Bonds". Retrosheet. Retrieved April 13, 2024.
- ^ a b "Single-Season Leaders & Records for Slugging %". Baseball Reference. Retrieved 2016-12-10.
- ^ Anderson, R.J. (December 16, 2020). "MLB Elevates Negro Leagues to 'Major League' Status, Giving 'Overdue Recognition' to 3,400 Players". CBSSports.com. Archived from the original on December 16, 2020. Retrieved December 18, 2020.
- ^ "Career Leaders & Records for Slugging %". Baseball-Reference.com. Retrieved April 13, 2024.
- ^ Castrovince, Anthony (29 May 2024). "What to know about Negro Leagues stats entering MLB record". MLB.com. Retrieved 9 June 2024.
- ^ "Slugging Percentage | The ARMory Power Pitching Academy". armorypitching.com. Retrieved 2020-10-10.
- ^ "Major League Baseball Batting Year-by-Year Averages". Baseball-Reference.com. Retrieved April 13, 2024.
- ^ Lewis, Dan (2001-03-31). "Lies, Damn Lies, and RBIs". nationalreview.com. Archived from the original on 2012-10-20. Retrieved 2012-07-01.
- ^ Barra, Allen (2001-06-20). "The best season ever?". Salon.com. Retrieved 2007-07-15.
- ^ Separate but not quite equal: Why OPS is a "bad" statistic, Bryan Grosnick, Beyond the Box Score, September 18, 2015.
External links
[edit]Slugging percentage
View on GrokipediaSlugging percentage (SLG), often abbreviated as SLG, is a traditional baseball statistic that quantifies a batter's power-hitting ability by representing the average number of bases earned per at-bat through hits, with extra-base hits weighted accordingly: singles count as one base, doubles as two, triples as three, and home runs as four.[1] The metric is computed as total bases divided by at-bats (AB), excluding walks, hit-by-pitches, and sacrifices, thereby focusing solely on hit production rather than overall plate discipline.[1] Unlike batting average, which treats all hits equally, SLG emphasizes the causal impact of harder contact on run production by valuing long hits that advance runners and score more effectively.[2] Introduced in local leagues by at least 1914 and gaining prominence in the early 20th century amid rising interest in power statistics, SLG evolved as a complement to on-base percentage (OBP), forming the basis of the widely used on-base plus slugging (OPS) composite that better predicts offensive value than either alone.[3][4] In Major League Baseball (MLB), Babe Ruth holds the career SLG record at .690 (1914–1935), reflecting his transformative dominance in extra-base production during the live-ball era.[5] Pre-integration Negro League players achieved even higher marks, with Josh Gibson posting a verified single-season SLG of .974 in 1937 and a career-high individual figure of .718, underscoring empirical evidence of elite power suppressed by segregation.[6][7] These records highlight SLG's role in identifying sluggers whose extra-base hits drive team scoring, though modern analytics like expected SLG (xSLG) adjust for batted-ball quality to address luck and park effects.[8]
Definition and Calculation
Formula and Components
Slugging percentage quantifies a batter's power output by measuring total bases per at-bat, weighting extra-base hits more heavily than singles.[1] It is calculated as the sum of bases from hits divided by official at-bats, excluding outcomes like walks and sacrifices that do not count as at-bats.[9] The numerator, known as total bases, assigns values based on hit type: one base for each single (1B), two bases for each double (2B), three bases for each triple (3B), and four bases for each home run (HR).[1] Thus, the formula is SLG = \frac{1B + (2 \times 2B) + (3 \times 3B) + (4 \times HR)}{AB}, where AB denotes at-bats.[9] At-bats (AB) represent plate appearances resulting in hits, outs, or errors, but exclude bases on balls, hit by pitches, sacrifice flies, sacrifice bunts, catcher's interference, and fielder's choices in certain contexts; this denominator focuses solely on opportunities where the batter risks an out to advance baserunners or score. Singles contribute minimally to SLG as they equal the batting average's base value of one, while extra-base hits elevate the metric to reflect power hitting's value in driving in runs and stretching defenses.[1]Interpretation of Values
Slugging percentage (SLG) quantifies a batter's power output by representing the average number of bases earned per at-bat from hits, excluding walks and hit-by-pitches. Values below 0.300 typically signify poor power production, as they reflect predominantly singles or weaker contact relative to league norms. In Major League Baseball (MLB), league-average SLG has generally ranged from 0.400 to 0.420 in the modern era (post-1920), with recent seasons like 2023 showing a collective .414 across both leagues.[10] A SLG of 0.400 or slightly above aligns with average offensive production, indicating a balance of singles and occasional extra-base hits sufficient for replacement-level contributors.[9] Players achieving 0.450 to 0.500 demonstrate solid power, often correlating with above-average run production and value in team lineups, as extra-base hits (doubles, triples, home runs) weigh more heavily in the metric.[11] Values exceeding 0.500 mark strong power hitters, with historical data showing such marks distinguishing All-Star caliber performers from the pack.[9] Elite SLG thresholds, above 0.550, denote exceptional power, reserved for the era's top sluggers; for instance, only 14 players qualified for the batting title with an SLG over 0.600 in the 2023 season, led by Ronald Acuña Jr. at 0.596. Career leaders like Babe Ruth (0.690) and Ted Williams (0.634) exemplify this tier, far surpassing contemporaries and underscoring SLG's role in identifying transformative hitters.[5] Interpretation must account for era-specific factors, as dead-ball era (pre-1920) averages dipped below 0.350 due to equipment and strategy, inflating relative value of later achievements.[12]Historical Development
Origins in Early Baseball Statistics
The foundations of slugging percentage trace back to the 1860s, when Henry Chadwick, the pioneering baseball statistician, introduced metrics that differentiated hit quality by the bases achieved, laying the groundwork for valuing extra-base power. Chadwick's system categorized hits as singles (1 base), doubles (2 bases), triples (3 bases), and home runs (4 bases), culminating in total bases as a core measure of a batter's capacity to generate offensive value through advancement and scoring opportunities. This approach arose amid baseball's formative years, where games featured frequent fielding errors (averaging 7.6 per game in 1871) and low run totals, making extra-base hits empirically rarer and more causally impactful for outcomes.[13] In 1867, Chadwick formalized an early slugging metric as total bases per game, published in The Ball Players’ Chronicle on September 19, dividing accumulated bases by games played to assess productivity independent of at-bats, which were not yet standardized. This primitive formulation prioritized hit potency over volume, contrasting with nascent hit-counting stats and reflecting first-principles recognition that bases earned directly influenced runs via linear progression around the diamond. By December 4, 1869, the New York Clipper reported "average total bases on hits to a game," establishing it as a recurring evaluative tool in contemporary analyses.[14][15] Though overshadowed by batting average (initially hits per game, refined to hits per at-bat by the 1870s), the total bases framework persisted as a causal benchmark for power hitting in an era dominated by contact-oriented play. Its empirical edge lay in capturing the multiplicative effect of extra bases on scoring probability, a principle evident in Chadwick's broader scorecard innovations that tracked hit types separately from the 1850s onward. This early emphasis on slugging metrics waned temporarily as statistical conventions favored simplicity, but it presaged modern refinements by highlighting how unweighted averages understate differential contributions to team success.[16]Formal Adoption and Standardization
The precursor to the modern slugging percentage, termed "total base average," was calculated identically to the current formula and appeared in print as early as September 21, 1884, in the Boston Daily Globe. This early usage divided total bases—awarding one for singles, two for doubles, three for triples, and four for home runs—by at-bats, providing a measure of batting power beyond simple average.[3] Although Henry Chadwick proposed a rudimentary version in the 1860s, dividing total bases by games played rather than at-bats, the shift to at-bats as the denominator enabled more precise evaluation of individual productivity. The term "slugging percentage" itself emerged later, gaining official recognition in the National League in 1923, when it was applied to season leaders such as Rogers Hornsby, who posted a .627 mark while leading the St. Louis Cardinals in offensive output.[17] This adoption reflected growing appreciation for metrics that weighted extra-base hits, amid an era of increasing home run emphasis following Babe Ruth's influence, though retrospective calculations confirm its applicability to earlier players like Ruth's .764 in the American League that year.[18] Full standardization across Major League Baseball occurred with the American League's official recognition in 1946, aligning both circuits in publishing the statistic routinely in guides and records. This uniformity elevated slugging percentage from an ad hoc newspaper tool to a core evaluative standard, facilitating cross-era comparisons and player scouting, as evidenced by its inclusion in league leaderboards thereafter.[19] By mid-century, it complemented batting average in official summaries, underscoring causal links between hit quality and run production without reliance on context-dependent factors like ballpark effects.[10]Application in Professional Baseball
Usage in Major League Baseball
In Major League Baseball, slugging percentage serves as an official statistic tracked and published by the league to evaluate hitters' power production, calculated as total bases divided by at-bats and displayed alongside metrics like batting average and on-base percentage on scoreboards, broadcasts, and official leaderboards.[1][20] Annual SLG leaders are determined for qualified players, typically requiring at least 3.1 plate appearances per team game to ensure statistical reliability, with values above .500 denoting above-average power and .600 or higher marking elite performance.[20] The metric integrates into broader offensive assessments, particularly through on-base plus slugging (OPS), which sums SLG with on-base percentage to approximate run creation and is prioritized by front-office executives for contract negotiations and trade evaluations, as evidenced by analyses of players like Aaron Judge, whose sustained high SLG has underpinned his valuation.[4][21] Unlike batting average, which treats all hits equally, SLG weights extra-base hits—doubles (2 bases), triples (3 bases), and home runs (4 bases)—to better capture causal contributions to scoring via harder contact and distance, making it a staple in scouting reports for identifying sluggers capable of driving in runs.[1] Though not the sole criterion, elevated SLG figures correlate strongly with awards recognizing offensive excellence, such as the Silver Slugger, where voters—managers and coaches—consider power stats reflecting a player's ability to generate extra bases, as SLG directly quantifies this over a full season.[22] In MVP balloting, SLG informs voters' emphasis on impactful hitters, with historical leaders like Babe Ruth (.689 career SLG) exemplifying how sustained power translates to league dominance, though modern analytics temper its standalone use by pairing it with context-adjusted variants to account for era-specific factors like ballpark effects.[21]Role in Player Evaluation and Scouting
Slugging percentage is a primary statistical tool in baseball scouting for assessing a hitter's power output, as it weights extra-base hits to reflect their greater contribution to run scoring compared to singles. Scouts review SLG from amateur, college, and minor league performances to project a prospect's ability to produce total bases, with values exceeding .450 often indicating above-average power potential that correlates with offensive value in professional play.[1][23] To refine this evaluation, scouts frequently compute isolated power (ISO), derived by subtracting batting average from SLG, which isolates extra-base hit frequency and provides a purer measure of raw power decoupled from mere contact hitting. This metric helps distinguish prospects whose SLG stems from genuine slugging ability rather than inflated singles rates, enabling more accurate tool grading on the standard 20-80 scouting scale where plus power (50-60 grade) typically aligns with ISO above .150.[23][24] In practice, MLB teams incorporate SLG and derived metrics like ISO into prospect rankings and draft decisions; for example, top power-hitting prospects in 2025 farm systems were highlighted for SLG figures over .550 in High-A ball, signaling tradeable assets for major league contention.[25] During player development, sustained high SLG in lower minors prompts promotions, as it empirically predicts adaptation to advanced pitching where power translates to higher run production.[24] Scouting reports thus cross-reference SLG with qualitative observations like bat speed and launch angle, but the statistic's emphasis on verifiable extra bases ensures objective benchmarking across evaluations.[26]Analytical Value and Comparisons
Advantages and Empirical Strengths
Slugging percentage provides a more comprehensive assessment of a batter's offensive contribution than batting average by weighting hits according to the bases gained, thereby emphasizing power hitting and extra-base production over mere contact.[27] This distinction allows evaluators to differentiate players who frequently advance runners into scoring position through doubles, triples, and home runs from those reliant on singles, which batting average treats equivalently.[28] For instance, a player with identical batting average but higher slugging percentage generates greater run expectancy per at-bat due to the increased leverage of multi-base hits.[29] Empirically, team slugging percentage exhibits a strong positive correlation with run production, with Pearson correlation coefficients typically ranging from 0.87 to 0.93 across Major League Baseball seasons, outperforming isolated batting average in predictive accuracy for scoring outcomes.[30] This relationship holds because extra-base hits directly amplify baserunner advancement and scoring probabilities, as quantified in linear weights models where doubles, triples, and home runs contribute 1.3 to 2.0 runs above average per event compared to singles.[31] Year-to-year stability further underscores its reliability; slugging percentage demonstrates higher correlation between consecutive seasons (approximately 0.316) than on-base percentage (0.098) or batting average, making it a superior prognosticator of sustained offensive value.[32] In player evaluation, slugging percentage's focus on total bases per at-bat aligns closely with causal drivers of team success, such as narrower run distributions and higher win percentages, where elevated slugging inversely correlates with scoring variance and enhances Pythagorean win projections.[33] Unlike batting average, which underweights power and overemphasizes low-impact singles, slugging's empirical edge in forecasting run prevention and production has been validated in sabermetric analyses, positioning it as a foundational metric in offensive hierarchies.[34]Limitations and Criticisms
Slugging percentage, while effective at quantifying extra-base power, excludes walks and hit-by-pitches from its calculation, as it divides total bases by at-bats rather than plate appearances. This omission fails to credit non-hit methods of reaching base, which empirically contribute substantially to run production; for instance, linear weights models assign walks a run value of approximately 0.30-0.35 runs above average, comparable to singles.[35] Consequently, SLG can overstate the value of players who generate power through high strikeout rates and low on-base percentages, as seen in cases like Adam Dunn's career .247/.364/.490 line where isolated power masked lower overall efficiency.[35] The metric's nomenclature is also criticized as misleading, since it is not a bounded percentage (0-100%) but an average of total bases per at-bat that routinely exceeds 1.000 for elite power hitters like Barry Bonds (.554 career SLG).[36][37] This can confuse casual observers, implying a proportional hitting efficiency akin to batting average rather than a power-weighted average. Furthermore, SLG does not adjust for contextual factors such as ballpark dimensions, where homer-friendly venues like Coors Field inflate figures by 20-30% compared to pitcher-friendly parks, or era-specific conditions like the dead-ball period's sub-.400 league SLG in 1908 versus .430+ in the live-ball era post-1920.[38] In small sample sizes, SLG exhibits high variance due to its dependence on rare events like home runs; regression analyses show it stabilizes only after 400-500 at-bats, rendering early-season or partial-career figures unreliable for prediction.[39] Modern sabermetrics further highlights its inferiority to run-value metrics like weighted on-base average (wOBA), which empirically correlates 0.90+ with run scoring versus SLG's 0.85, by assigning empirically derived weights to outcomes rather than arbitrary base multipliers (e.g., doubles at 2 bases versus ~1.25 run value).[35] These limitations underscore SLG's role as a supplementary rather than standalone evaluator, particularly as batted-ball data reveals luck components in singles-heavy SLG inflation via batting average on balls in play (BABIP).[39]Complementary Statistics and Modern Analytics
Slugging percentage measures power through total bases per at-bat but excludes non-hit ways of reaching base, such as walks and hit-by-pitches, necessitating complementary metrics like on-base percentage (OBP) to assess overall offensive value.[40] The combination of OBP and SLG yields on-base plus slugging (OPS), which empirically correlates more strongly with runs scored than either statistic alone, with historical team-level correlations reaching 0.95.[41] [42] This additive approach approximates run production because OBP captures reaching base frequency while SLG weights hit quality, though it overvalues singles relative to their run impact by double-counting them across the two components.[43] ![{\displaystyle {\text{RC}}={\frac {\times }{+}}}][center] In sabermetric advancements, weighted on-base average (wOBA) refines these inputs by linearly weighting all offensive outcomes—singles at about 0.9 runs, doubles at 1.3, triples at 1.6, home runs at 2.1, and walks at 0.7—based on their empirical contribution to scoring, outperforming OPS in predictive accuracy for individual and team run generation.[44] wOBA incorporates SLG's emphasis on extra bases but adjusts for context, such as ballpark effects, yielding a scale similar to OBP where league averages hover around 0.320 and elite marks exceed 0.400.[45] Variants like weighted runs created plus (wRC+) normalize wOBA to a 100 scale, park-adjusted, enabling cross-era comparisons of power-integrated offense.[46] Isolated power (ISO), derived as SLG minus batting average, isolates extra-base hits to quantify pure slugging without contact dependency, complementing SLG by highlighting power efficiency.[47] Statcast-era metrics extend this with expected SLG (xSLG), which regresses actual SLG toward outcomes predicted from exit velocity and launch angle on batted balls, distinguishing skill from luck in power realization— for instance, high-velocity pulls yielding projected SLG over 0.600.[48] These analytics integrate SLG into broader frameworks like wins above replacement (WAR), where offensive components weigh SLG-derived power against baserunning and defense for holistic player valuation.[49]Records and Notable Achievements
All-Time Career Leaders
Following Major League Baseball's integration of Negro Leagues statistics into its official records on May 28, 2024, Josh Gibson emerged as the all-time career leader in slugging percentage with a mark of .718, calculated over his documented at-bats in the Negro Leagues from 1920 to 1948.[50] This surpasses Babe Ruth's previous record of .690, established across 22 seasons primarily with the New York Yankees from 1914 to 1935.[51] The integration, covering 1920-1948 seasons, elevated several Negro Leagues players into the upper echelons of power-hitting metrics, reflecting their dominance in segregated professional play.[52] Prior to this update, Babe Ruth held the career slugging percentage lead, a position he maintained since his retirement, underscoring his revolutionary impact on offensive production through home runs and extra-base hits.[5] Post-integration rankings highlight a blend of early 20th-century icons, with Ted Williams (.634) and Lou Gehrig (.632) rounding out the top modern-era (post-1900) performers among players with at least 3,000 plate appearances.[5] Negro Leagues standouts like Mule Suttles (.620) and Turkey Stearnes (.616) also feature prominently, their stats now verified through extensive archival research by MLB's committee.[53] The table below lists the top career slugging percentage leaders as of the 2024 integration, qualified by a minimum of 2,500 at-bats to ensure statistical reliability across eras:| Rank | Player | SLG | At-Bats | Primary Leagues/Years |
|---|---|---|---|---|
| 1 | Josh Gibson | .718 | ~2,900 | Negro Leagues, 1920-1948 |
| 2 | Babe Ruth | .690 | 10,628 | AL/NL, 1914-1935 |
| 3 | Ted Williams | .634 | 9,792 | AL, 1939-1960 |
| 4 | Lou Gehrig | .632 | 9,665 | AL, 1923-1939 |
| 5 | Mule Suttles | .620 | ~3,600 | Negro Leagues, 1921-1944 |
Single-Season and Milestone Records
The highest single-season slugging percentage in Major League Baseball history, incorporating Negro Leagues statistics as officially recognized since 2024, is .974 by Josh Gibson of the Homestead Grays in 1937, achieved over 183 at-bats.[6] This mark surpasses previous leaders from the Negro Leagues, including Mule Suttles' .877 in 1926 with the Birmingham Black Barons and Charlie Smith's .874 in 1929 with the Atlantic City Bacharach Giants.[55] Gibson also posted .868 in 1943, ranking fourth all-time.[6] These records reflect play in segregated leagues with varying competition levels and statistical documentation, though MLB's integration validates their inclusion for comparative purposes.[50] In the post-integration era (since 1947), Barry Bonds holds the MLB single-season record with .863 in 2001 for the San Francisco Giants, over 476 at-bats, driven by 73 home runs and a .370 batting average.[56] This eclipsed Babe Ruth's long-standing modern benchmark of .847 in 1920 with the New York Yankees.[57] Bonds repeated elite power with .812 in 2004 and .799 in 2002, the only player with multiple .700-plus seasons in this period.[58] Other notable post-1947 performances include Ruth's .846 in 1921, Ted Williams' .735 in 1941, and Mark McGwire's .752 in 1998.[56]| Rank | Player | Year | SLG | At-Bats | Notes |
|---|---|---|---|---|---|
| 1 | Josh Gibson | 1937 | .974 | 183 | Negro Leagues (Homestead Grays)[6] |
| 2 | Mule Suttles | 1926 | .877 | 390 | Negro Leagues (Birmingham Black Barons)[55] |
| 3 | Charlie Smith | 1929 | .874 | 301 | Negro Leagues (Atlantic City Bacharach Giants)[55] |
| 4 | Josh Gibson | 1943 | .868 | 302 | Negro Leagues (Homestead Grays)[6] |
| 5 | Barry Bonds | 2001 | .863 | 476 | MLB (San Francisco Giants)[56] |