Hubbry Logo
Indicator diagramIndicator diagramMain
Open search
Indicator diagram
Community hub
Indicator diagram
logo
8 pages, 0 posts
0 subscribers
Be the first to start a discussion here.
Indicator diagram
Indicator diagram
from Wikipedia
Watt's indicator diagram
Indicator diagram for steam locomotive
Richard's indicator instrument of 1875

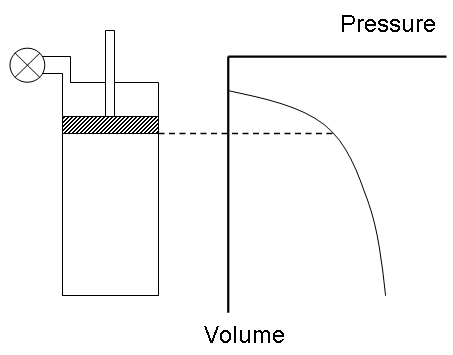
An indicator diagram is a chart used to measure the thermal, or cylinder, performance of reciprocating steam and internal combustion engines and compressors.[1] An indicator chart records the pressure in the cylinder versus the volume swept by the piston, throughout the two or four strokes of the piston which constitute the engine, or compressor, cycle. The indicator diagram is used to calculate the work done and the power produced in an engine cylinder[2] or used in a compressor cylinder.

History

[edit]

The indicator diagram was developed by James Watt and his employee John Southern to help understand how to improve the efficiency of steam engines.[3] In 1796, Southern developed the simple, but critical, technique to generate the diagram by fixing a board so as to move with the piston, thereby tracing the "volume" axis, while a pencil, attached to a pressure gauge, moved at right angles to the piston, tracing "pressure".[4]

The indicator diagram constitutes one of the earliest examples of statistical graphics. It may be significant that Watt and Southern developed the indicator diagram at roughly the same time that William Playfair (a former Boulton & Watt employee who continued an amicable correspondence with Watt) published The Commercial and Political Atlas, a book often cited as the first to employ statistical graphics.[5]

The gauge enabled Watt to calculate the work done by the steam while ensuring that its pressure had dropped to zero by the end of the stroke, thereby ensuring that all useful energy had been extracted. The total work could be calculated from the area between the "volume" axis and the traced line. The latter fact had been realised by Davies Gilbert as early as 1792 and used by Jonathan Hornblower in litigation against Watt over patents on various designs. Daniel Bernoulli had also had the insight about how to calculate work.[6]

Watt used the diagram to make radical improvements to steam engine performance and long kept it a trade secret. Though it was made public in a letter to the Quarterly Journal of Science in 1822,[7] it remained somewhat obscure, John Farey, Jr. only learned of it on seeing it used, probably by Watt's men, when he visited Russia in 1826.

In 1834, Émile Clapeyron used a diagram of pressure against volume to illustrate and elucidate the Carnot cycle, elevating it to a central position in the study of thermodynamics.[8]

Later instruments for steam engine (illus.) used paper wrapped around a cylindrical barrel with a pressure piston inside it, the rotation of the barrel coupled to the piston crosshead by a weight- or spring-tensioned wire.[9]

In 1869 the British marine engineer Nicholas Procter Burgh wrote a full book on the indicator diagram explaining the device step by step. He had noticed that "a very large proportion of the young members of the engineering profession look at an indicator diagram as a mysterious production."[10]

Indicators developed for steam engines were improved for internal combustion engines with their rapid changes in pressure, resulting from combustion, and higher speeds. In addition to using indicator diagrams for calculating power they are used to understand the ignition, injection timing and combustion events which occur near dead-center, when the engine piston and indicator drum are hardly moving. Much better information during this part of the cycle is obtained by offsetting the indicator motion by 90 degrees to the engine crank, giving an offset indicator diagram. The events are recorded when the velocity of the drum is near its maximum and are shown against crank-angle instead of stroke.[11]

E850 Lord Nelson, with an indicator shelter, c. 1926–1927

See also

[edit]

References

[edit]

Bibliography

[edit]
[edit]
Revisions and contributorsEdit on WikipediaRead on Wikipedia
from Grokipedia
An indicator diagram is a graphical chart that records the variation in pressure against volume (or piston displacement) within the cylinder of a reciprocating steam engine, internal combustion engine, or compressor throughout a complete working cycle, enabling the calculation of indicated power and assessment of thermal efficiency. Invented in the late 18th century by James Watt and refined by his associate John Southern around 1796, the indicator diagram originated as a tool for optimizing steam engine valve timing and performance during the Industrial Revolution, with early devices using a pressure-sensitive piston connected to a recording stylus on a rotating drum. The instrument, known as the steam engine indicator, produces a closed-loop curve where the area enclosed represents the net work done per cycle, typically measured in foot-pounds or joules, and the mean effective pressure (derived by dividing the area by the stroke length) serves as a key metric for engine output. In practice, indicator diagrams are obtained by attaching the indicator device to the cylinder's indicator cock, where a spring-loaded piston traces the pressure profile as the engine operates; modern digital variants employ pressure transducers and crank-angle encoders for precise data acquisition, often replacing mechanical systems in contemporary applications. Common types include the power card (full cycle for power calculation), draw card (admission and exhaust phases for valve analysis), compression diagram (intake and compression for scavenging efficiency), and light spring diagram (low-pressure details), each tailored to diagnose specific issues like faulty fuel injection, exhaust valve timing, or combustion deficiencies. Beyond steam engines, indicator diagrams are essential in marine diesel engines for routine performance monitoring—at regular intervals—to ensure compliance with sea trial baselines and prevent damage from anomalies such as low peak pressures (indicating poor ) or high compression ratios (suggesting carbon buildup). In internal combustion engines, they quantify indicated (IMEP) to evaluate volumetric efficiency and thermal losses, while in compressors, they assess polytropic efficiency by comparing actual versus ideal compression curves, aiding in design improvements and fault detection across reciprocating machinery.

Fundamentals

Definition and Purpose

An indicator diagram is a graphical representation plotting cylinder pressure against piston displacement or volume, serving to visualize the thermodynamic cycle in reciprocating engines and compressors. This chart captures the real-time variations in pressure and volume within the cylinder during operation, providing a direct empirical depiction of the engine's or compressor's internal processes. The primary purpose of an indicator diagram is to assess thermal efficiency, calculate mean effective pressure (MEP), determine indicated power, and identify faults such as valve timing issues or compression losses. By analyzing the enclosed area of the diagram, engineers can quantify the work done per cycle and evaluate overall cylinder performance without relying solely on external measurements. As the practical equivalent of idealized pressure-volume (PV) diagrams, indicator diagrams reveal the actual relationships during intake, compression, expansion, and exhaust phases, contrasting with theoretical models like the Otto or Diesel cycles by incorporating real-world deviations such as heat losses and friction. In standard representations, the vertical axis denotes pressure in bars or pounds per square inch (psi), while the horizontal axis indicates volume in cubic meters or piston stroke in millimeters.

Basic Principles

The indicator diagram, a graphical representation of versus (P-V) in a , is grounded in of , which relates the work done by the to changes in its and . Specifically, the net work output over a complete engine cycle is quantified by the area enclosed within the closed P-V loop, calculated as W=PdVW = \oint P \, dV, where the integral accounts for expansion work exceeding compression work. This principle allows the diagram to encapsulate the energy conversion process central to engine operation. In a four-stroke reciprocating engine cycle, the indicator diagram delineates the sequential stages of intake, compression, power (expansion), and exhaust. The intake stroke appears as a near-horizontal line at atmospheric pressure with increasing volume as the piston moves from top dead center (TDC) to bottom dead center (BDC); compression follows as a curve of rising pressure and decreasing volume toward TDC; the power stroke shows a sharp pressure rise due to combustion followed by expansion along a decreasing pressure line to BDC; and exhaust traces a line of slightly elevated pressure with increasing volume back to TDC. These segments collectively form the closed loop, illustrating the cyclic variation of pressure and volume that drives the engine. Ideal indicator diagrams, based on air-standard cycles like Otto or Diesel, assume reversible processes with no frictional losses, instantaneous combustion, and perfect insulation, yielding maximum possible work from the enclosed area. In contrast, actual diagrams exhibit deviations due to mechanical friction in piston rings and bearings, heat losses through cylinder walls and valves, and volumetric clearances that trap residual gases, all of which reduce the loop area and thermal efficiency. These real-world effects broaden the compression and expansion lines, lowering peak pressures relative to ideals. From the indicator diagram, key parameters reveal engine performance and efficiency: peak pressure marks the maximum value attained during combustion, indicating the intensity of the power stroke; compression ratio, defined as the ratio of maximum to minimum cylinder volume, governs the starting point of the expansion line and directly impacts cycle efficiency; and the slope of the expansion line, which approximates a polytropic process, reflects how closely the expansion adheres to adiabatic conditions, with steeper slopes signifying better retention of combustion heat. Higher compression ratios, typically 7:1 to 11:1 in spark-ignition engines, enhance these parameters but are limited by material constraints to avoid knocking.

History

Invention by James Watt

The indicator diagram originated from the efforts of James Watt and his assistant John Southern in the late 18th century, amid the burgeoning Industrial Revolution, where steam engines were pivotal for powering factories, mines, and transportation. Developed between approximately 1790 and 1796, the device addressed the need to empirically measure and visualize the performance of steam engines, enabling precise quantification of efficiency and work output in real-time operation. Its initial purpose was to record the variations within the during each of early engines, such as those derived from Newcomen's atmospheric , thereby calculating the mechanical work performed per cycle. This capability directly supported Watt's ongoing innovations, including the separate condenser introduced in his 1769 , which reduced consumption by preventing the from cooling during each ; the indicator allowed engineers to verify these improvements through graphical rather than estimates. By plotting against (proportional to ), it provided a direct means to assess energy transfer and identify inefficiencies like incomplete expansion or excessive back . The early featured a straightforward mechanical linkage: a small connected to the engine's main captured , transmitting it via a spring-loaded rod to a stylus or pencil that traced against a sheet of paper wrapped around a drum. The drum, in turn, was driven by a cord or linkage to the rod, ensuring the horizontal axis represented stroke position while the vertical axis indicated , yielding a closed-loop trace of the engine cycle. This compact apparatus, often portable and fitting in a wooden case, was calibrated with a mercury manometer for accuracy and could be attached to engines in the field. Although the core indicator mechanism built on Watt's pressure-measuring ideas from earlier patents, such as his 1782 specification for valve adjustments, the full recording diagram was refined and introduced commercially by Boulton & Watt in 1796 as a proprietary tool. It remained a closely guarded trade secret for decades, used internally to maintain competitive advantages in engine sales and maintenance contracts. The first public description appeared in 1822 as an anonymous account titled "Account of a Steam-Engine Indicator" by "H.H. junr." in the Quarterly Journal of Science, volume 13, page 95.

Evolution in Engine Technology

In the mid-19th century, indicator diagrams saw significant refinements for advanced steam engine designs, particularly compound and Corliss engines, building on earlier mechanical principles to accommodate higher pressures and multi-cylinder configurations. William McNaught's parallel-motion indicator, developed around 1842, marked a key improvement by enabling more accurate pressure-volume recordings in high-pressure compound engines, such as Woolf-type setups where separate diagrams could be taken from high- and low-pressure cylinders to analyze efficiency gains. This adaptation facilitated duty improvements from approximately 25 million foot-pounds per bushel of coal in simple engines to over 44 million in compounded versions by the 1840s. By the late 19th century, indicators were routinely applied to Corliss engines, which featured rotary valves for reduced clearance and better expansion control, allowing diagrams to reveal optimized cut-off points and minimize wire-drawing losses during admission and exhaust phases. The transition to internal combustion engines in the late 19th and early 20th centuries extended indicator diagram applications to Otto and Diesel cycles, where they helped diagnose combustion efficiency and valve timing in high-speed operations. In the 1890s, MAN Diesel & Turbo (then Maschinenfabrik Augsburg-Nürnberg) employed indicators during Rudolf Diesel's engine development, producing thousands of diagrams to refine compression ratios and ignition pressures in prototype four-stroke engines tested from 1897 onward. By the early 1900s, these tools were standardized for performance testing in both gasoline Otto engines and emerging Diesel variants, with the American Society of Mechanical Engineers (ASME) incorporating indicator-based protocols into its 1906 guidelines for engine trials to ensure consistent mean effective pressure calculations across manufacturers. Mid-20th-century advancements integrated indicator diagrams into reciprocating compressors for the oil and gas sector, where they became essential for monitoring cylinder performance in natural gas processing and pipeline boosting stations. During the post-World War II expansion of hydrocarbon extraction, diagrams revealed volumetric efficiency and interstage pressure drops in multi-stage units, aiding diagnostics for valve leaks and piston ring wear under high-pressure conditions typical of sour gas handling. Key milestones in the included the introduction of optical indicators around by Bertram Hopkinson, which used mirrors and to capture diagrams in high-speed internal engines, minimizing mechanical errors that plagued spring-loaded designs at over 1,000 rpm. By the 1950s, electronic indicators emerged, employing strain gauges and oscilloscopes for real-time transduction, further reducing and distortions to achieve accuracy within 1% of true in both engines and compressors.

Measurement Methods

Indicator Apparatus

The indicator apparatus, a key device for generating indicator diagrams in reciprocating engines, primarily consists of mechanical components that capture cylinder variations relative to displacement. At its core, the apparatus features a spring-loaded or diaphragm connected to the engine's cylinder via a pipe, which senses changes; a stylus or pen that traces these variations; and a rotating drum wrapped with recording paper, synchronized to the piston's motion through a linkage to the engine's crosshead or crankshaft. The deflects the against the spring's resistance, translating the motion to the stylus, while the drum's rotation—typically driven by a cord or chain—produces the pressure-volume trace. Traditional mechanical indicators evolved from James Watt's original design around 1793, which used a small brass cylinder with a solid-head piston, a spiral spring resisting motion, and a pointer for scale reading, later adapted for continuous recording on paper. By the early 1900s, the Crosby indicator, patented in 1882 and refined in models like the New Engine Indicator (1903), represented a significant advancement with its external or internal double-wound springs encircling the piston rod, allowing quick changes for different pressure scales, and a pantograph-like mechanism to amplify the stylus motion. These devices operated by connecting the piston to the cylinder head valve, where gas pressure moved the piston upward against the calibrated spring, with the stylus scribing on paper as the drum revolved in proportion to the engine stroke. Calibration of mechanical indicators focused on the springs and motion scaling to ensure accurate pressure representation. Springs were precisely calibrated for specific ranges, such as up to 300 lb/sq.in (about 21 bar) in Crosby variants, with markings indicating maximum pressure ratings and adjustments via threaded caps or washers to align the atmospheric line. For stroke scaling, reduction gears or wheels—such as the Star Improved Reducing Wheel (1910)—employed pulleys or bevel gears to proportion long engine strokes (e.g., 12 to 72 inches) to the drum's limited travel (typically 1.5 to 2 inches), preventing distortion in the trace. Early electronic variants emerged in the mid-20th century, transitioning from mechanical tracing to electrical signals for improved precision at higher speeds. These devices incorporated strain gauge sensors mounted in the cylinder head to measure pressure-induced deformation, converting it to electrical resistance changes via a Wheatstone bridge circuit, which were then amplified and displayed as traces on an oscilloscope. Introduced around the 1950s for research in aerospace and high-performance engines, such indicators offered dynamic ranges up to 100 bar and faster response times than mechanical springs, though they required careful calibration to account for temperature effects on gauge sensitivity.

Procedure for Obtaining Diagrams

Obtaining an indicator diagram requires careful preparation to ensure the engine operates under stable conditions, minimizing variables that could distort the pressure-volume trace. The engine should be at a steady load and speed, with reciprocating machines like marine diesel engines run at consistent RPM and fuel rates to achieve representative data. For shipboard applications, the vessel must be on an even keel in calm seas to avoid extraneous motions affecting the diagram. Prior to attachment, the engine is warmed up to its normal operating temperature, and indicator valves or cocks are inspected for leaks or blockages, with connections verified for integrity. The core steps involve attaching the indicator apparatus to the cylinder port and capturing traces synchronized with piston motion. First, the indicator cock is opened briefly to blow through the cylinder, clearing soot or condensates with 2-3 firing strokes. The mechanical indicator is then fastened securely to the port, with a taut cord or mechanical linkage connected to synchronize the recording drum's rotation with the piston stroke, ensuring the trace aligns centrally on the diagram paper. A baseline atmospheric pressure line is recorded by closing the cock and allowing the stylus to trace for 1-2 drum revolutions. To capture the main diagram, the cock is reopened, the stylus pressed lightly against the paper, and the cord pulled or drive engaged to record the full cycle over 2-3 strokes, after which the cock is closed and the linkage disconnected. Multiple traces are taken across different loads and speeds for comprehensive assessment, including a compression line by repeating the process with fuel cut-off to isolate non-firing events. Safety protocols are essential due to the high temperatures and pressures in reciprocating cylinders. Personnel must wear personal protective equipment, including heat-resistant gloves, eye protection, and safety footwear, while using insulated tools to handle hot surfaces and avoid burns. Low-pressure starts are recommended initially to prevent sudden pressure surges damaging the indicator, and exposure of the instrument to excessive heat is limited to preserve calibration accuracy. Throughout the process, operating conditions such as RPM, load, and fuel consumption rate are meticulously recorded to contextualize the diagrams. Following capture, the diagrams undergo post-processing to validate and quantify the data. Faulty traces, such as those showing irregular shapes due to leaks or improper synchronization, are discarded, and usable cards are often enlarged for clarity. The enclosed area of the diagram is measured using a planimeter to determine mean effective pressure, with the stylus and drum cleaned and lubricated afterward to maintain the indicator's condition for future use. In modern digital variants, data from transducers is transferred to software for automated analysis, but traditional mechanical methods emphasize manual verification.

Types of Diagrams

Power Cards

A power card is a type of indicator diagram that captures the pressure-volume relationship throughout a complete cycle in reciprocating engines, encompassing compression, expansion, exhaust, and , primarily to determine indicated horsepower. The diagram is generated using an indicator instrument connected to the cylinder's indicator valve, where a drum rotates synchronously with the engine's piston movement—once per cycle in mechanical setups or via digital transducers tracking crankshaft angle in modern systems—allowing a stylus or sensor to trace the full pressure trace as a closed loop on a chart or digital display. Key characteristics include an upper closed loop representing the power stroke, where pressure peaks during combustion and expansion before dropping, and a lower loop depicting the exhaust and intake phases with relatively lower pressures; in two-stroke engines, the diagram exhibits a more compact single-loop profile due to overlapping strokes, whereas four-stroke engines show a broader trace reflecting the doubled revolution per cycle. Power cards serve as a baseline for engine tuning by providing insights into combustion efficiency and overall cycle performance, and they help detect operational issues such as blow-by from worn piston rings or inadequate scavenging in the exhaust-intake process. Other card types, like draw cards, supplement power cards by isolating specific phases for deeper analysis.

Draw and Compression Cards

Draw cards are specialized indicator diagrams that capture the pressure-volume relationship during the non-power strokes of the engine cycle, specifically the exhaust and intake phases, with fuel supply cut off to eliminate combustion effects. By isolating these strokes and minimizing or zeroing compression and expansion influences, draw cards enable precise measurement of pumping work losses, which represent the energy expended to expel exhaust gases and draw in fresh charge. These diagrams are generated using an indicator apparatus connected to the cylinder indicator valve, with the fuel pump disengaged and the recording drum adjusted—often through partial rotation or specific valve configurations—to trace only the relevant strokes. The enclosed area in the diagram is negative relative to the atmospheric line, signifying the net work input required for pumping operations. In ideal conditions, the draw card exhibits a nearly rectangular shape, reflecting consistent pressure during intake and exhaust with minimal losses. Deviations, such as distorted shapes, expanded loops, or reduced heights, indicate problems like valve timing errors, exhaust leaks, or excessive back pressure. Compression cards, also known as motored diagrams, are obtained similarly with no fuel injection, focusing on the intake and compression phases to evaluate cylinder condition without interference from combustion. They provide insights into ring wear, valve timing accuracy, and overall sealing integrity by plotting the pressure buildup from intake to top dead center. The generation process involves shutting off the fuel supply and synchronizing the indicator drum in phase with the piston motion to record the full motored cycle, often at reduced engine speed for clarity. Characteristic features include an exponential pressure rise during compression, culminating in a peak that should align closely with expected values for the engine design. Irregularities, such as a flattened curve or lower peak pressure, signal issues like worn piston rings, leaky valves, or mistimed intake/exhaust events. Unlike power cards that encompass the complete cycle for overall output assessment, draw and compression cards isolate auxiliary loops to diagnose efficiency losses in non-power phases.

Light Spring Diagrams

Light spring diagrams are indicator diagrams taken using a lighter spring in the indicator mechanism to measure low-pressure variations, particularly during the exhaust and scavenging phases in two-stroke engines or the intake and exhaust in four-stroke engines. This allows for detailed analysis of low-pressure events that a standard spring might not resolve accurately. Obtained by replacing the regular spring with a light one and recording during normal or motored operation with the drum synchronized to the piston, these diagrams highlight subtle pressure differences in the lower range. Key features include traces of exhaust valve opening and closing, scavenge port timing, and back pressure effects, with ideal shapes showing smooth transitions and minimal fluctuations. Deviations, such as sudden drops or irregular waves, can indicate exhaust valve faults, turbocharger issues, or poor scavenging efficiency. Light spring diagrams complement other types by providing insights into auxiliary systems and low-pressure performance, aiding in the diagnosis of issues not visible in higher-pressure recordings like power or compression cards.

Analysis and Interpretation

Key Features and Shapes

Indicator diagrams typically exhibit distinct visual characteristics that reflect the thermodynamic cycle of reciprocating engines. In a normal power card, the compression curve appears smooth and gradual, rising as the piston moves toward top dead center, while the expansion curve shows a steep initial drop following combustion, indicative of rapid pressure release. The exhaust line remains relatively flat, representing consistent back pressure during the exhaust stroke, and the overall loop displays hysteresis, where the compression and expansion paths do not coincide due to heat transfer and frictional effects. The diagram's horizontal axis measures piston stroke in millimeters, providing a linear representation of volume change, whereas the vertical axis records pressure variations, scaled proportionally to the indicator spring constant, often in units like bar per millimeter. Abnormal shapes in indicator diagrams serve as diagnostic indicators of engine malfunctions. Triangular peaks on the expansion curve often signal misfiring, where incomplete causes erratic pressure rather than a smooth power . A hooked appearance in the exhaust line suggests late valve closing, leading to and distorted pressure . Similarly, a flat-topped compression curve points to worn or poor piston rings, resulting in insufficient sealing and reduced pressure buildup. Several factors influence the shape and features of indicator diagrams beyond standard operation. Clearance volume, the residual space in the cylinder at top dead center, affects the starting point of compression and can alter curve steepness if excessive. In two-stroke engines, port timing governs scavenging and exhaust processes, potentially causing irregular loops if mistimed. Supercharging introduces elevated intake pressures, which elevate the baseline and modify the compression profile, often resulting in higher peak pressures and shifted hysteresis.

Work Calculation and Performance Metrics

The indicated work per cycle in an engine cylinder is calculated as the integral of pressure with respect to volume over the engine cycle, representing the net work done by the gases on the piston: W=PdVW = \oint P \, dV This integral corresponds to the area enclosed by the indicator diagram on a pressure-volume plot. In practice, the area is measured using a planimeter, typically yielding a value in square millimeters, and then converted to actual work in joules by multiplying by the vertical scale factor (pressure per unit length, e.g., in pascals per millimeter) and the horizontal scale factor (volume per unit length, e.g., in cubic meters per millimeter). The mean effective pressure (MEP), a key performance metric, is derived as the indicated work divided by the swept volume of the cylinder: MEP=WVs\text{MEP} = \frac{W}{V_s} where VsV_s is the displaced volume. From the diagram directly, MEP can be computed as the product of the planimeter-measured area and the vertical scale factor, divided by the product of the diagram length and the horizontal scale factor, yielding MEP in units such as bars or pascals. This provides a normalized measure of cylinder pressure effectiveness, independent of engine size. For example, in a typical diesel engine diagram with an area of 90 mm², a vertical scale of 10 bar/mm, a horizontal length of 50 mm, and a horizontal scale of 0.002 m³/mm, MEP approximates 18 bar. Indicated power (IP), the total power developed inside the cylinders, is calculated using MEP as: IP=MEP×L×A×N1.2\text{IP} = \frac{\text{MEP} \times L \times A \times N}{1.2} where MEP is in bars, LL is the stroke length in meters, AA is the piston area in square meters, and NN is the engine speed in revolutions per minute; the result is in kilowatts for a single-cylinder four-stroke engine (multiply by the number of cylinders for multi-cylinder engines). The factor 1.2 accounts for the 4-stroke cycle (power stroke every two revolutions) and unit conversions (bar to pascals and joules to kilowatts). Adjustments are needed for engine type: in two-stroke engines, every revolution produces a power stroke (use 0.6 instead of 1.2). For instance, a single-cylinder four-stroke diesel engine with MEP of 15 bar, L=0.5L = 0.5 m, A=0.00785A = 0.00785 m², and N=1500N = 1500 rpm yields an IP of approximately 74 kW. Efficiency metrics derived from these calculations assess overall . Indicated quantifies conversion to indicated work and is given by: ηith=IPm˙f×CV\eta_{ith} = \frac{\text{IP}}{\dot{m}_f \times \text{CV}} where m˙f\dot{m}_f is the in kg/s and CV is the calorific value in J/kg, typically yielding values of 35-45% in modern diesel . Mechanical , which accounts for and pumping losses, is the of brake power (measured at the ) to indicated power: ηm=BPIP\eta_m = \frac{\text{BP}}{\text{IP}} often ranging from 80-90% in well-designed reciprocating engines. These metrics enable direct evaluation of thermodynamic and mechanical losses from indicator diagram data.

Applications

In Reciprocating Engines

In reciprocating steam engines, indicator diagrams are essential for evaluating operational efficiency by assessing the cut-off point, where steam admission to the cylinder ceases, allowing engineers to optimize expansion and reduce steam consumption. The diagrams reveal the pressure-volume relationship during the expansion stroke, enabling adjustments to valve timing for improved performance. Additionally, superheated steam produces distinct indicator diagrams characterized by a steeper pressure drop during expansion compared to saturated steam, due to reduced cylinder condensation and enhanced energy transfer to the piston. Historically, these diagrams were widely employed in 19th-century locomotives on railways such as the early American and British networks, where they facilitated performance testing to diagnose issues like valve leaks or uneven power delivery. For internal combustion reciprocating engines, indicator diagrams play a key role in maintenance and optimization, particularly in large marine diesel engines like those from MAN B&W, where they help achieve cylinder balance by comparing mean effective pressures across units to ensure even load distribution and prevent mechanical stress. In automotive applications, these diagrams aid engine development and tuning processes by analyzing combustion phasing and pressure profiles. Diagnostic applications of indicator diagrams in reciprocating engines focus on pinpointing inefficiencies in cycle processes. In two-stroke engines, common in , the diagrams identify scavenge efficiency by examining pressure traces during the scavenging phase, where low exhaust pressures or incomplete charge replacement indicate poor port timing or blower performance, potentially leading to reduced power and increased fuel use. Similarly, shifts in peak pressure location on the diagram signal deviations in fuel injection timing; an advanced peak suggests early injection causing knocking, while a retarded one points to delayed combustion, allowing technicians to recalibrate injectors for optimal ignition and reduced emissions. Standardized procedures govern the use of indicator diagrams in reciprocating engines, with ISO 3046 specifying methods for power calculation based on diagram areas to determine indicated power under defined ambient conditions, ensuring consistent performance ratings across manufacturers. In marine settings, these diagrams are routinely taken every 800 hours of operation on ships to monitor cylinder condition and compare against baseline sea trial data, facilitating proactive maintenance to sustain engine reliability. Such calculations, as outlined in performance analysis techniques, integrate diagram-derived mean pressures with engine geometry to yield precise work outputs.

In Compressors and Pumps

In reciprocating compressors, indicator diagrams, particularly compression cards, are employed to evaluate , defined as the of actual of gas compressed to the theoretical displacement . The area enclosed by the compression on the pressure- (P-V) represents the effective compression work, allowing of by comparing the inducted gas against losses due to clearance, re-expansion, and . Deviations in the , such as reduced areas or irregular shapes, indicate inefficiencies; for instance, flutter manifests as oscillations in the trace during intake or discharge phases, signaling unstable plate movement that reduces . Similarly, intercooler leaks in multi-stage compressors alter the by causing premature equalization between stages, visible as flattened expansion lines or unexpected drops in the low- cylinder's card. For positive displacement pumps, hydraulic indicator diagrams plot hydraulic pressure against time or plunger position to assess performance in reciprocating types like diaphragm or plunger pumps. These diagrams reveal slip, the unintended backflow through clearances or valves, by showing discrepancies between theoretical and actual pressure profiles during suction and discharge strokes; volumetric efficiency, akin to the capacity factor (actual delivered volume divided by theoretical displacement), is derived from the diagram's enclosed area, typically reduced by 3-5% under standard conditions due to slip. Cavitation effects appear as abrupt pressure spikes or drops below vapor pressure during the suction phase, indicating vapor bubble formation and implosion that erodes components; mitigation involves monitoring net positive inlet pressure (NPIP) to exceed the net positive suction head required (NPSHR). Key performance metrics from these diagrams include the capacity factor, which quantifies slip as the ratio of actual to theoretical volume, often below 100% due to leaks and compressibility. Polytropic efficiency is determined from the polytropic exponent n in the relation P1V1n=P2V2nP_1 V_1^n = P_2 V_2^n, where the diagram's curve slope yields n via discharge temperature measurements, enabling assessment of deviation from ideal compression paths. In industrial applications, indicator diagrams facilitate analysis of reciprocating compressors in oil and gas pipelines for capacity optimization and fault detection, and in refrigeration systems to ensure efficient gas handling under varying loads. The American Petroleum Institute (API) Standard 618 outlines requirements for performance testing, including indicator diagram acquisition during mechanical running and aerodynamic tests to verify efficiency and detect anomalies in petroleum, chemical, and gas services.

Limitations and Modern Developments

Traditional Limitations

Traditional mechanical indicator diagrams, reliant on mechanical components such as drums, pencils, and springs, suffer from inherent accuracy limitations due to dynamic forces in reciprocating engines. Mechanical inertia in the recording drum and linkage causes lag in tracing pressure-volume relationships, particularly at higher engine speeds, resulting in distorted or incomplete diagrams, such as a single line instead of a full loop. Spring hysteresis, where the spring's response varies between loading and unloading cycles, further introduces variability in pressure measurements, exacerbated by high temperatures that alter spring calibration and deform traces. Additionally, engine vibrations distort the stylus path, leading to irregular shapes and reduced precision in capturing peak pressures or mean effective pressures. Practical challenges compound these accuracy issues, making traditional indicators labor-intensive and operationally cumbersome. Taking diagrams requires manual attachment of the indicator to the cylinder head, precise timing with engine strokes, and skilled operators to handle the mechanical setup, often necessitating partial engine slowdown or shutdown to avoid excessive inertia errors. Without specialized multi-port manifolds, measurements are limited to one cylinder at a time, prolonging the process for multi-cylinder engines and increasing the risk of inconsistent conditions across units. Environmental factors, such as elevated temperatures in the cylinder vicinity, can warp mechanical parts and paper cards, while dust contamination—common in marine settings—fouls linkages and reduces trace clarity. Prior to the 1980s, reliance on these mechanical methods led to infrequent testing due to their inefficiency and subjectivity in interpretation by onboard mechanics, often resulting in overlooked performance degradation. In high-speed engines operating above 1000 RPM, rapid cycle times amplify inertia and vibration effects, rendering diagrams unreliable for precise diagnostics, with errors in top dead center positioning alone causing up to 8% deviation in heat release calculations.

Digital Alternatives

Contemporary electronic indicators have largely supplanted mechanical systems for capturing indicator diagrams in reciprocating engines, utilizing piezoelectric sensors to measure in real time. These sensors, such as those developed by Kistler, convert mechanical stress from pressure variations into electrical charges, high-fidelity without the mechanical linkages of traditional indicators. Sampling rates typically reach 100 kHz, providing detailed resolution of combustion events even at high engine speeds. Software platforms facilitate advanced of these digital waveforms, transforming raw into processed indicator for . Tools like AVL IndiCom enable comprehensive , including calculations and cycle averaging, while incorporating AI-based for automatic fault detection, such as misfires or issues, by identifying anomalies in diagram shapes. Key advantages of these digital alternatives include the ability to perform continuous monitoring during operation, eliminating the need for disassembly required in traditional methods, and seamless integration with control units (ECUs) for and alerts. They also offer superior accuracy, often achieving 0.1% full-scale precision in measurements under dynamic conditions. Adoption of electronic indicator systems has become standard in modern marine engines, such as those from Wärtsilä, where integrated diagnostics like the UNIC system leverage cylinder pressure data for ongoing performance optimization since the early 2000s. In legacy systems, hybrid approaches combine electronic sensors with existing mechanical setups to facilitate gradual upgrades.

References

Add your contribution
Related Hubs
User Avatar
No comments yet.