Recent from talks
Regression analysis
Knowledge base stats:
Talk channels stats:
Members stats:
Regression analysis
In statistical modeling, regression analysis is a statistical method for estimating the relationship between a dependent variable (often called the outcome or response variable, or a label in machine learning parlance) and one or more independent variables (often called regressors, predictors, covariates, explanatory variables or features).
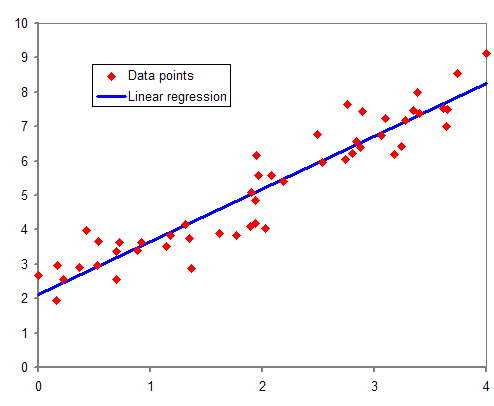
The most common form of regression analysis is linear regression, in which one finds the line (or a more complex linear combination) that most closely fits the data according to a specific mathematical criterion. For example, the method of ordinary least squares computes the unique line (or hyperplane) that minimizes the sum of squared differences between the true data and that line (or hyperplane). For specific mathematical reasons (see linear regression), this allows the researcher to estimate the conditional expectation (or population average value) of the dependent variable when the independent variables take on a given set of values. Less common forms of regression use slightly different procedures to estimate alternative location parameters (e.g., quantile regression or Necessary Condition Analysis) or estimate the conditional expectation across a broader collection of non-linear models (e.g., nonparametric regression).
Regression analysis is primarily used for two conceptually distinct purposes. First, regression analysis is widely used for prediction and forecasting, where its use has substantial overlap with the field of machine learning. Second, in some situations regression analysis can be used to infer causal relationships between the independent and dependent variables. Importantly, regressions by themselves only reveal relationships between a dependent variable and a collection of independent variables in a fixed dataset. To use regressions for prediction or to infer causal relationships, respectively, a researcher must carefully justify why existing relationships have predictive power for a new context or why a relationship between two variables has a causal interpretation. The latter is especially important when researchers hope to estimate causal relationships using observational data.
The earliest regression form was seen in Isaac Newton's work in 1700 while studying equinoxes, being credited with introducing "an embryonic linear regression analysis" as "Not only did he perform the averaging of a set of data, 50 years before Tobias Mayer, but by summing the residuals to zero he forced the regression line to pass through the average point. He also distinguished between two inhomogeneous sets of data and might have thought of an optimal solution in terms of bias, though not in terms of effectiveness." He previously used an averaging method in his 1671 work on Newton's rings, which was unprecedented at the time.
The method of least squares was published by Legendre in 1805, and by Gauss in 1809. Legendre and Gauss both applied the method to the problem of determining, from astronomical observations, the orbits of bodies about the Sun (mostly comets, but also later the then newly discovered minor planets). Gauss published a further development of the theory of least squares in 1821, including a version of the Gauss–Markov theorem.
The term "regression" was coined by Francis Galton in the 19th century to describe a biological phenomenon. The phenomenon was that the heights of descendants of tall ancestors tend to regress down towards a normal average (a phenomenon also known as regression toward the mean). For Galton, regression had only this biological meaning, but his work was later extended by Udny Yule and Karl Pearson to a more general statistical context. In the work of Yule and Pearson, the joint distribution of the response and explanatory variables is assumed to be Gaussian. This assumption was weakened by R.A. Fisher in his works of 1922 and 1925. Fisher assumed that the conditional distribution of the response variable is Gaussian, but the joint distribution need not be. In this respect, Fisher's assumption is closer to Gauss's formulation of 1821.
In the 1950s and 1960s, economists used electromechanical desk calculators to calculate regressions. Before 1970, it sometimes took up to 24 hours to receive the result from one regression.
Regression methods continue to be an area of active research. In recent decades, new methods have been developed for robust regression, regression involving correlated responses such as time series and growth curves, regression in which the predictor (independent variable) or response variables are curves, images, graphs, or other complex data objects, regression methods accommodating various types of missing data, nonparametric regression, Bayesian methods for regression, regression in which the predictor variables are measured with error, regression with more predictor variables than observations, and causal inference with regression. Modern regression analysis is typically done with statistical and spreadsheet software packages on computers as well as on handheld scientific and graphing calculators.
Hub AI
Regression analysis AI simulator
(@Regression analysis_simulator)
Regression analysis
In statistical modeling, regression analysis is a statistical method for estimating the relationship between a dependent variable (often called the outcome or response variable, or a label in machine learning parlance) and one or more independent variables (often called regressors, predictors, covariates, explanatory variables or features).
The most common form of regression analysis is linear regression, in which one finds the line (or a more complex linear combination) that most closely fits the data according to a specific mathematical criterion. For example, the method of ordinary least squares computes the unique line (or hyperplane) that minimizes the sum of squared differences between the true data and that line (or hyperplane). For specific mathematical reasons (see linear regression), this allows the researcher to estimate the conditional expectation (or population average value) of the dependent variable when the independent variables take on a given set of values. Less common forms of regression use slightly different procedures to estimate alternative location parameters (e.g., quantile regression or Necessary Condition Analysis) or estimate the conditional expectation across a broader collection of non-linear models (e.g., nonparametric regression).
Regression analysis is primarily used for two conceptually distinct purposes. First, regression analysis is widely used for prediction and forecasting, where its use has substantial overlap with the field of machine learning. Second, in some situations regression analysis can be used to infer causal relationships between the independent and dependent variables. Importantly, regressions by themselves only reveal relationships between a dependent variable and a collection of independent variables in a fixed dataset. To use regressions for prediction or to infer causal relationships, respectively, a researcher must carefully justify why existing relationships have predictive power for a new context or why a relationship between two variables has a causal interpretation. The latter is especially important when researchers hope to estimate causal relationships using observational data.
The earliest regression form was seen in Isaac Newton's work in 1700 while studying equinoxes, being credited with introducing "an embryonic linear regression analysis" as "Not only did he perform the averaging of a set of data, 50 years before Tobias Mayer, but by summing the residuals to zero he forced the regression line to pass through the average point. He also distinguished between two inhomogeneous sets of data and might have thought of an optimal solution in terms of bias, though not in terms of effectiveness." He previously used an averaging method in his 1671 work on Newton's rings, which was unprecedented at the time.
The method of least squares was published by Legendre in 1805, and by Gauss in 1809. Legendre and Gauss both applied the method to the problem of determining, from astronomical observations, the orbits of bodies about the Sun (mostly comets, but also later the then newly discovered minor planets). Gauss published a further development of the theory of least squares in 1821, including a version of the Gauss–Markov theorem.
The term "regression" was coined by Francis Galton in the 19th century to describe a biological phenomenon. The phenomenon was that the heights of descendants of tall ancestors tend to regress down towards a normal average (a phenomenon also known as regression toward the mean). For Galton, regression had only this biological meaning, but his work was later extended by Udny Yule and Karl Pearson to a more general statistical context. In the work of Yule and Pearson, the joint distribution of the response and explanatory variables is assumed to be Gaussian. This assumption was weakened by R.A. Fisher in his works of 1922 and 1925. Fisher assumed that the conditional distribution of the response variable is Gaussian, but the joint distribution need not be. In this respect, Fisher's assumption is closer to Gauss's formulation of 1821.
In the 1950s and 1960s, economists used electromechanical desk calculators to calculate regressions. Before 1970, it sometimes took up to 24 hours to receive the result from one regression.
Regression methods continue to be an area of active research. In recent decades, new methods have been developed for robust regression, regression involving correlated responses such as time series and growth curves, regression in which the predictor (independent variable) or response variables are curves, images, graphs, or other complex data objects, regression methods accommodating various types of missing data, nonparametric regression, Bayesian methods for regression, regression in which the predictor variables are measured with error, regression with more predictor variables than observations, and causal inference with regression. Modern regression analysis is typically done with statistical and spreadsheet software packages on computers as well as on handheld scientific and graphing calculators.
Recent media