
Community hub
Recent from talks
Contribute something
Nothing was collected or created yet.
Beaufort scale
View on Wikipedia

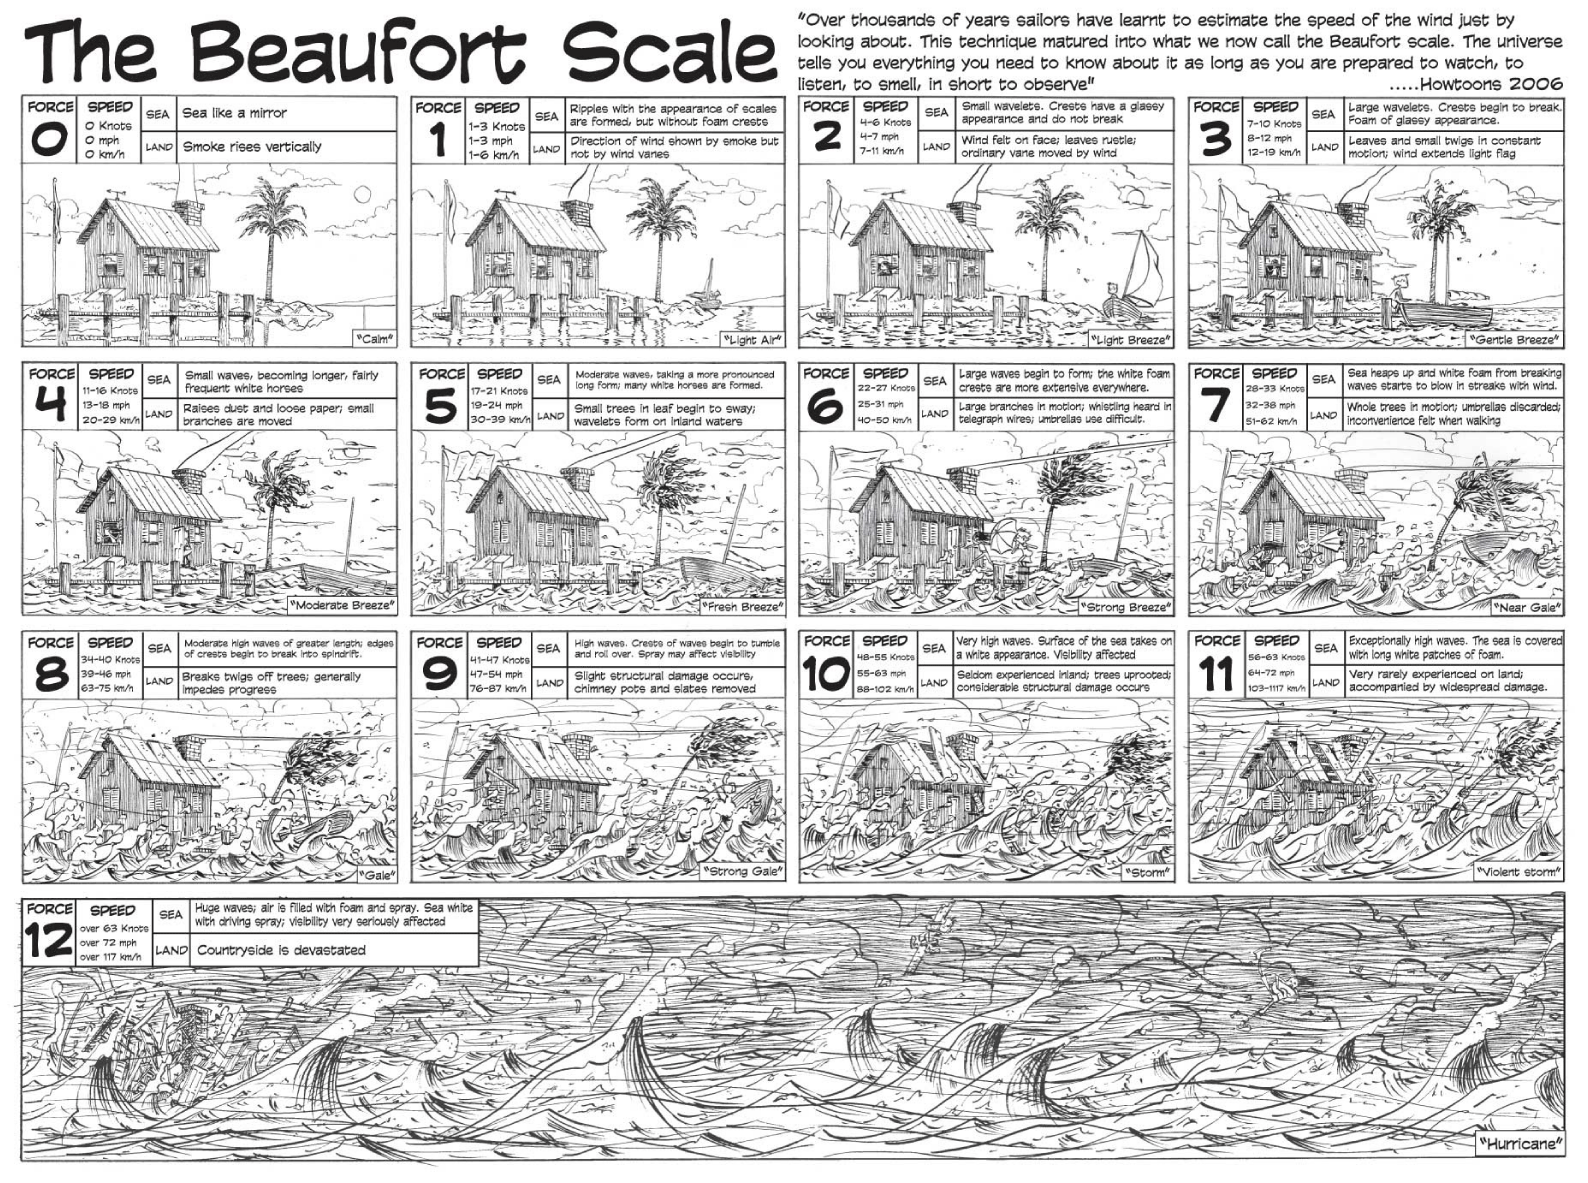
The Beaufort scale (/ˈboʊfərt/ BOH-fərt) is an empirical measure that relates wind speed to observed conditions at sea or on land. Its full name is the Beaufort wind force scale. It was devised in 1805 by Francis Beaufort, a hydrographer in the Royal Navy. It was officially adopted by the Royal Navy and later spread internationally.
History
[edit]
The scale that carries Beaufort's name had a long and complex evolution from the previous work of others (including Daniel Defoe the century before). In the 18th century, naval officers made regular weather observations, but there was no standard scale and so they could be very subjective — one man's "stiff breeze" might be another's "soft breeze"—: Beaufort succeeded in standardising a scale.[1] The scale was devised in 1805 by Francis Beaufort (later Rear Admiral), a hydrographer and a Royal Navy officer, while serving on HMS Woolwich, and refined until he was Hydrographer of the Navy in the 1830s, when it was adopted officially. It was first used during the 1831-1836 "Darwin voyage" of HMS Beagle under Captain Robert FitzRoy, who was later to set up the first Meteorological Office in Britain giving regular weather forecasts.[2]
The initial scale of 13 classes (zero to 12) did not reference wind speed numbers, but related qualitative wind conditions to effects on the sails of a frigate, then the main ship of the Royal Navy, from "just sufficient to give steerage" to "that which no canvas sails could withstand".[3]
The scale was made a standard for ship's log entries on Royal Navy vessels in the late 1830s and, in 1853, the Beaufort scale was accepted as generally applicable at the First International Meteorological Conference in Brussels.[1]
In 1916, to accommodate the growth of steam power, the descriptions were changed to how the sea, not the sails, behaved and extended to land observations. Anemometer rotations to scale numbers were standardised only in 1923. George Simpson, CBE (later Sir George Simpson), director of the UK Meteorological Office, was responsible for this and for the addition of the land-based descriptors.[2] The measures were slightly altered some decades later to improve its utility for meteorologists. Nowadays, meteorologists typically express wind speed in kilometres or miles per hour or, for maritime and aviation purposes, knots, but Beaufort scale terminology is still sometimes used in weather forecasts for shipping[4] and the severe weather warnings given to the public.[5]

Wind speed on the modern Beaufort scale is based on the empirical relationship:[6]

where v is the equivalent wind speed at 10 metres above the sea surface and B is Beaufort scale number. For example, B = 9.5 is related to 24.5 m/s which is equal to the lower limit of "10 Beaufort". Using this formula the highest winds in hurricanes would be 23 in the scale. F1 tornadoes on the Fujita scale and T2 TORRO scale also begin roughly at the end of level 12 of the Beaufort scale, but are independent scales, although the TORRO scale wind values are based on the 3/2 power law relating wind velocity to Beaufort force.[7]
Wave heights in the scale are for conditions in the open ocean, not along the shore.
Modern scale
[edit]The table below details the contemporary use of the scale.
| Beaufort number |
Description | Wind speed | Wave height |
Sea conditions | Land conditions | Sea conditions (photo) |
Associated warning flag |
|---|---|---|---|---|---|---|---|
| 0 | Calm | < 1 knot < 1 mph < 1 km/h 0–0.2 m/s |
0 ft 0 m |
Sea like a mirror | Smoke rises vertically | 
|
|
| 1 | Light air | 1–3 knots 1–3 mph 1–5 km/h 0.3–1.5 m/s |
0–1 ft 0–0.3 m |
Ripples with appearance of scales are formed, without foam crests | Direction shown by smoke drift but not by wind vanes | 
|
|
| 2 | Light breeze | 4–6 knots 4–7 mph 6–11 km/h 1.6–3.3 m/s |
1–2 ft 0.3–0.6 m |
Small wavelets still short but more pronounced; crests have a glassy appearance but do not break | Wind felt on face; leaves rustle; wind vane moved by wind | 
|
|
| 3 | Gentle breeze | 7–10 knots 8–12 mph 12–19 km/h 3.4–5.4 m/s |
2–4 ft 0.6–1.2 m |
Large wavelets; crests begin to break; foam of glassy appearance; perhaps scattered white horses | Leaves and small twigs in constant motion; light flags extended | 
|
|
| 4 | Moderate breeze | 11–16 knots 13–18 mph 20–28 km/h 5.5–7.9 m/s |
3.5–6 ft 1–2 m |
Small waves becoming longer; fairly frequent white horses | Raises dust and loose paper; small branches moved | 
|
|
| 5 | Fresh breeze | 17–21 knots 19–24 mph 29–38 km/h 8–10.7 m/s |
6–10 ft 2–3 m |
Moderate waves taking a more pronounced long form; many white horses are formed; chance of some spray | Small trees in leaf begin to sway; crested wavelets form on inland waters | 
|
|
| 6 | Strong breeze | 22–27 knots 25–31 mph 39–49 km/h 10.8–13.8 m/s |
9–13 ft 3–4 m |
Large waves begin to form; the white foam crests are more extensive everywhere; probably some spray | Large branches in motion; whistling heard in telegraph wires; umbrellas used with difficulty | 
|

|
| 7 | Moderate gale, near gale |
28–33 knots 32–38 mph 50–61 km/h 13.9–17.1 m/s |
13–19 ft 4–5.5 m |
Sea heaps up and white foam from breaking waves begins to be blown in streaks along the direction of the wind; spindrift begins to be seen | Whole trees in motion; inconvenience felt when walking against the wind | 
|
|
| 8 | Gale, fresh gale |
34–40 knots 39–46 mph 62–74 km/h 17.2–20.7 m/s |
18–25 ft 5.5–7.5 m |
Moderately high waves of greater length; edges of crests break into spindrift; foam is blown in well-marked streaks along the direction of the wind | Twigs break off trees; generally impedes progress | 
|
|
| 9 | Strong/severe gale | 41–47 knots 47–54 mph 75–88 km/h 20.8–24.4 m/s |
23–32 ft 7–10 m |
High waves; dense streaks of foam along the direction of the wind; sea begins to roll; spray affects visibility | Slight structural damage (chimney pots and slates removed) | 
|
|
| 10 | Storm,[12] whole gale |
48–55 knots 55–63 mph 89–102 km/h 24.5–28.4 m/s |
29–41 ft 9–12.5 m |
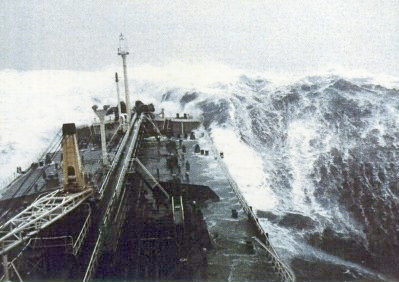
Very high waves with long overhanging crests; resulting foam in great patches is blown in dense white streaks along the direction of the wind; on the whole the surface of the sea takes on a white appearance; rolling of the sea becomes heavy; visibility affected | Seldom experienced inland; trees uprooted; considerable structural damage | 
|

|
| 11 | Violent storm | 56–63 knots 64–72 mph 103–117 km/h 28.5–32.6 m/s |
37–52 ft 11.5–16 m |
Exceptionally high waves; small- and medium-sized ships might be for a long time lost to view behind the waves; sea is covered with long white patches of foam; everywhere the edges of the wave crests are blown into foam; visibility affected | Very rarely experienced; accompanied by widespread damage | 
|
|
| 12 | Hurricane-force[12] | ≥ 64 knots ≥ 73 mph ≥ 118 km/h ≥ 32.7 m/s |
≥ 46 ft ≥ 14 m |
The air is filled with foam and spray; sea is completely white with driving spray; visibility very seriously affected | Devastation | 
|
|
The Beaufort scale is neither an exact nor an objective scale; it was based on visual and subjective observation of a ship and of the sea. The corresponding integral wind speeds were determined later, but conversions have not been made official.
Extended scale
[edit]The Beaufort scale was extended in 1946 when forces 13 to 17 were added.[1] However, forces 13 to 17 were intended to apply only to special cases, such as tropical cyclones. Nowadays, the extended scale is used in Taiwan,[13] mainland China[14] and Vietnam,[15] which are often affected by typhoons. Internationally, the World Meteorological Organization Manual on Marine Meteorological Services (2012 edition) defined the Beaufort Scale only up to force 12 and there was no recommendation on the use of the extended scale.[16]
| Beaufort number |
Wind speed |
|---|---|
| 13 | 72–80 knots 83–92 mph 133–148 km/h |
| 14 | 81–89 knots 93–103 mph 149–165 km/h |
| 15 | 90–99 knots 104–114 mph 166–183 km/h |
| 16 | 100–108 knots 115–125 mph 184–200 km/h |
| 17 | > 108 knots 125 mph 200 km/h |
Use
[edit]The scale is used in the Shipping Forecasts broadcast on BBC Radio 4 in the United Kingdom, and in the Sea Area Forecast from Met Éireann, the Irish Meteorological Service. Met Éireann issues a "Small Craft Warning" if winds of Beaufort force 6 (mean wind speed exceeding 22 knots) are expected up to 10 nautical miles offshore. Other warnings are issued by Met Éireann for Irish coastal waters, which are regarded as extending 30 miles out from the coastline, and the Irish Sea or part thereof.
"Gale Warnings" are issued if winds of Beaufort force 8 are expected. "Strong Gale Warnings" are issued if winds of Beaufort force 9 or frequent gusts of at least 52 knots are expected. "Storm Force Warnings" are issued if Beaufort force 10 or frequent gusts of at least 61 knots are expected. "Violent Storm Force Warnings" are issued if Beaufort force 11 or frequent gusts of at least 69 knots are expected. "Hurricane Force Warnings" are issued if winds of greater than 64 knots are expected.[citation needed]
This scale is widely used in the Netherlands, Germany,[18] Greece, China, Taiwan, Hong Kong, Malta, and Macau, although with some differences between them. Taiwan uses the Beaufort scale with the extension to 17 noted above. China also switched to this extended version without prior notice on the morning of 15 May 2006,[19] and the extended scale was immediately put to use for Typhoon Chanchu. Hong Kong and Macau retain force 12 as the maximum.[citation needed]
In the United States of America, winds of force 6 or 7 result in the issuance of a small craft advisory, with force 8 or 9 winds bringing about a gale warning, force 10 or 11 a storm warning ("a tropical storm warning" being issued instead of the latter two if the winds relate to a tropical cyclone), and force 12 a hurricane-force wind warning (or hurricane warning if related to a tropical cyclone). A set of red warning flags (daylight) and red warning lights (night time) is displayed at shore establishments which coincide with the various levels of warning.[citation needed]
In Canada, maritime winds forecast to be in the range of 6 to 7 are designated as "strong"; 8 to 9 "gale force"; 10 to 11 "storm force"; 12 "hurricane force". Appropriate wind warnings are issued by Environment Canada's Meteorological Service of Canada: strong wind warning, gale (force wind) warning, storm (force wind) warning and hurricane-force wind warning. These designations were standardised nationally in 2008, whereas "light wind" can refer to 0 to 12 or 0 to 15 knots and "moderate wind" 12 to 19 or 16 to 19 knots, depending on regional custom, definition or practice. Prior to 2008, a "strong wind warning" would have been referred to as a "small craft warning" by Environment Canada, similar to US terminology. (Canada and the USA have the Great Lakes in common.)[citation needed]
Weather scale
[edit]Beaufort's name was also attached to the Beaufort scale for weather reporting:
| Symbol | Interpretation |
|---|---|
| a | active |
| b | blue sky |
| c | detached clouds |
| d | drizzling rain |
| f | fog |
| g | dark, gloomy |
| h | hail |
| l | lightning |
| m | misty (hazy) |
| o | overcast |
| p | passing showers |
| q | squally |
| r | rain |
| s | snow |
| t | thunder |
| u | ugly (threatening) |
| v | visibility (unusual transparency) |
| w | wet, dew |
In this scale the weather designations could be combined, and reported, for example, as "s.c." for snow and detached cloud or "g.r.q." for dark, rain and squally.[20]
See also
[edit]References
[edit]- Huler, Scott (2004). Defining the Wind: The Beaufort Scale, and How a 19th-Century Admiral Turned Science into Poetry. Crown. ISBN 1-4000-4884-2.
- ^ a b c Saucier, Walter Joseph (1955). Principles of Meteorological Analysis. Chicago: The University of Chicago Press. OCLC 1082907714., reprinted in 2003 by Dover Publications.
- ^ a b "National Meteorological Library and Archive Fact sheet 6 – The Beaufort Scale" (PDF). Met Office. Archived from the original (PDF) on 2 October 2012. Retrieved 13 May 2011.
- ^ Oliver, John E. (2005). Encyclopedia of world climatology. Springer.
- ^ McIlveen, Robin (1991). Fundamentals of Weather and Climate. Cheltenham, England: Stanley Thornes. p. 40. ISBN 978-0-7487-4079-6.
- ^ Hay, William W. (2016). Experimenting on a Small Planet: A History of Scientific Discoveries, a Future of Climate Change and Global Warming (second ed.). Cham, Switzerland: Springer Verlag. p. 26. ISBN 978-3-319-27402-7.
- ^ Beer, Tom (1997). Environmental Oceanography. CRC Press. ISBN 0-8493-8425-7.
- ^ Maiden, Terence. "T-Scale: Origins and Scientific Basis". TORRO. Archived from the original on 5 February 2012. Retrieved 4 January 2012.
- ^ "The Beaufort Scale". RMetS. Retrieved 6 July 2021.
- ^ "Beaufort wind force scale". Met Office. Retrieved 27 November 2015.
- ^ "Beaufort Scale". Royal Meteorological Society. Retrieved 27 November 2015.
- ^ "Beaufort Scale". Encyclopædia Britannica. Retrieved 27 November 2015.
- ^ a b The names "storm" and "hurricane" on the Beaufort scale refer only to wind strength, and do not necessarily mean that other severe weather (for instance, a thunderstorm or tropical cyclone) is present. To avoid confusion, strong wind warnings will often speak of e.g. "hurricane-force winds".
- ^ "FAQ for Marine: 2. Beaufort Wind Scale Table?". Central Weather Administration. 14 August 2024. Retrieved 7 September 2024.
- ^ "天气预报基本术语" [Basic terminology for weather forecast] (PDF). China Meteorological Administration (in Chinese). p. 10. Retrieved 7 September 2024.
- ^ "Quyết định số 18/2021/QĐ-TTg của Thủ tướng Chính phủ: Quy định về dự báo, cảnh báo, truyền tin thiên tai và cấp độ rủi ro thiên tai" [Decision No. 18/2021/QĐ-TTg of the Prime Minister: Regulations on forecasting, warning, communication of natural disaster and natural disaster risk levels]. Vietnam Government Portal (in Vietnamese). p. 60. Retrieved 7 September 2024.
- ^ Manual on Marine Meteorological Services: Volume I – Global Aspect (PDF). World Meteorological Organization. 2012. Archived from the original (PDF) on 5 May 2017.
- ^ "JetStream Max: Wind and Sea Scales". National Oceanic and Atmospheric Administration. Retrieved 10 December 2023.
- ^ "Wetterlexikon - Beaufort-Skala" (in German). Deutscher Wetterdienst. Archived from the original on 12 December 2013. Retrieved 14 February 2014.
- ^ "昨日实行新标准"珍珠"属强台风_新闻中心_新浪网". news.sina.com.cn.
- ^ "The Times". The Times. 29 April 1873. p. 10. ISSN 0140-0460. Retrieved 3 July 2020.
External links
[edit]- National Meteorological Library and Archive Archived 13 November 2017 at the Wayback Machine fact sheet on the history of the Beaufort Scale, including various scales and photographic depictions of the sea state.
- Film of Wind Scale
- Historical Wind Speed Equivalents Of The Beaufort Scale
- Howtoons Poster showing effects on land/sea effects at each step.
- Beaufort scale, cites the original definition formula
- Ireland's Beaufort was Windscale Inventor—by Dr John de Courcy Ireland
- The Beaufort Scale and Weather Diaries of Rear Admiral Sir Francis Beaufort—The history of the Beaufort Scale
- Radio interview with Scott Huler
- Beaufort wind force scale. Met Office
- US Economic Costs of High Winds at NOAA Economics
Beaufort scale
View on GrokipediaHistory and Development
Origins in the Early 19th Century
Francis Beaufort, born in 1774 in Navan, County Meath, Ireland, was a prominent British Royal Navy officer and hydrographer whose career spanned over five decades. Entering the Navy at age 13 in 1787, he served in various capacities, including commanding frigates during the Napoleonic Wars, and advanced to the rank of rear admiral in 1846. Appointed Hydrographer of the Navy in 1829, Beaufort oversaw the production of accurate nautical charts and promoted scientific observation at sea, reflecting his commitment to empirical methods in navigation and meteorology.[4] In 1805, while serving as commander of the 44-gun frigate HMS Woolwich, Beaufort devised a personal scale for assessing wind force at sea, comprising 13 ordinal levels numbered from 0 (calm) to 13 (hurricane). This system categorized winds based on their effects on a fully rigged man-of-war's sails and rigging, rather than instrumental measurements, providing a practical means to gauge strain on ship structures under varying conditions. The scale's design emphasized observable impacts to ensure reliability for mariners without access to anemometers.[4] Beaufort's primary motivation was to introduce uniformity in wind reporting within naval logs, where subjective terms like "fresh breeze" or "stiff gale" led to inconsistencies that hindered navigation, tactical decisions, and historical weather analysis. By standardizing descriptions tied to physical effects on vessels, the scale enabled more precise recording of conditions for both operational use and long-term meteorological study. He first implemented it in his personal log aboard HMS Woolwich on 13 January 1806, marking its inaugural application during routine voyages.[5] The scale remained a private tool until gaining official traction in the late 1830s. On 28 December 1838, the British Admiralty issued a memorandum mandating its use for wind force entries in all Royal Navy ships' logs, representing its initial formal publication and integration into standard naval practice. This directive, circulated under Beaufort's influence as Hydrographer, ensured widespread adoption within the fleet and laid the groundwork for broader scientific dissemination.[4]Standardization and International Adoption
The scale was revised in 1874 by the International Meteorological Committee to account for changes in the rigging of modern warships, ensuring its continued relevance for naval use and promoting uniformity in international weather reporting.[4] In 1903, a formula relating Beaufort force (B) to wind speed (V in knots) was added: V = 1.87 × √(B3).[4] Admiral Robert FitzRoy, a protégé of Francis Beaufort and founder of the British Meteorological Department in 1854, played a pivotal role in promoting the scale's use through systematic weather observations and storm warnings, embedding it in early national meteorological practices.[3] In 1906, meteorologist George Simpson adapted the scale for land observations by describing wind effects on terrestrial features.[4] In 1926, the International Meteorological Committee established a uniform set of anemometer-based wind speed equivalents for the Beaufort numbers, providing numerical correlations that enhanced its precision for global telegraphic exchanges.[6] The scale's international spread accelerated with its formal adoption by the International Meteorological Organization in 1939, which endorsed it as a standard for wind force estimation at a 6-meter anemometer height and standardized sea state descriptions.[4] In 1946, the International Meteorological Organization (predecessor to the WMO) further standardized it through revised equivalents, extending the scale to forces 13–17 for extreme conditions such as tropical cyclones and ensuring consistency in coded marine observations.[7] Minor refinements occurred in the 1970s, particularly in 1970 when the World Meteorological Organization updated the wind speed equivalents to better align with modern anemometry and reporting protocols, promoting greater accuracy in global datasets.[8]Scale Description
Core Scale Levels (0-12)
The core Beaufort scale encompasses levels 0 through 12, offering a standardized system for estimating wind force through observable environmental effects rather than direct measurement. Originally devised by Sir Francis Beaufort in 1805 for British naval use, the scale emphasized the amount of sail a frigate could carry under given conditions, providing sailors with a practical, instrument-free method to assess wind strength.[4] Subsequent revisions, particularly the international adoption in 1939 following George Simpson's 1906 proposal, shifted the focus from ship-handling specifics to broader sea-state disturbances, such as wave height, foam patterns, and spray, while incorporating land-based indicators for wider applicability.[4] This evolution made the scale a versatile tool for visual estimation in maritime and terrestrial settings, relying on qualitative cues like ripple formation, whitecap frequency, and structural impacts.[9] The following table outlines the core levels, with descriptive terms, sea disturbance effects, and equivalent land observations, drawn from standardized meteorological specifications. These indicators enable observers to gauge wind force by noting progressive increases in wave complexity at sea—from calm mirrors to foam-filled chaos—and escalating terrestrial responses, from smoke direction to widespread structural failure.[9][4]| Beaufort Number | Descriptive Term | Sea Disturbance Effects | Land Effects |
|---|---|---|---|
| 0 | Calm | Sea like a mirror, with no visible motion. | Smoke rises vertically; calm conditions with no perceptible wind. |
| 1 | Light Air | Ripples form with a scale-like appearance, but no foam crests develop. | Direction shown by smoke drift, but not by wind vanes; leaves do not move. |
| 2 | Light Breeze | Small wavelets form, short but pronounced, with glassy crests that do not break. | Wind felt on face; leaves rustle; ordinary vanes moved by wind. |
| 3 | Gentle Breeze | Large wavelets appear; crests begin to break, forming foam of glassy appearance, with scattered white horses. | Leaves and small twigs in constant motion; wind extends light flags. |
| 4 | Moderate Breeze | Small waves become larger; fairly frequent white horses (breaking crests). | Raises dust and loose paper; small branches moved; heavy flags flap limply. |
| 5 | Fresh Breeze | Moderate waves take a pronounced long form; many white horses form, with chance of spray. | Small trees in leaf begin to sway; wind felt strongly on face. |
| 6 | Strong Breeze | Large waves begin to form; white foam crests become more extensive, with some spray. | Large branches in motion; whistling heard in wires; umbrellas hard to use. |
| 7 | Near Gale | Sea heaps up; white foam from breaking waves blown in streaks along wind direction. | Whole trees in motion; walking against wind becomes inconvenient. |
| 8 | Gale | Moderately high waves of greater length; crests break into spindrift, foam in well-marked streaks. | Twigs break off trees; progress generally impeded; flags whip straight out. |
| 9 | Strong Gale | High waves; dense streaks of foam along wind; crests topple, tumble, and roll over; spray may reduce visibility. | Slight structural damage, such as removal of chimney pots and slates. |
| 10 | Storm | Very high waves with long overhanging crests; dense white foam patches blown along wind; sea surface whitish; tumbling heavy and shock-like; visibility affected. | Trees uprooted; considerable structural damage; seldom experienced inland. |
| 11 | Violent Storm | Exceptionally high waves; sea covered with long white foam patches along wind; wave crests blown into froth; visibility greatly reduced. | Widespread damage; very rarely experienced on land. |
| 12 | Hurricane | Air filled with foam and spray; sea completely white with driving spray; visibility very seriously affected. | Severe and widespread damage to structures and vegetation. |
Wind Speed Correlations
The quantitative wind speed equivalents for the Beaufort scale were first established in 1926 through analysis of anemometer data by meteorologist G.C. Simpson, who correlated the original empirical force levels with measured velocities at a height of approximately 6 meters. These equivalents provided a standardized numerical framework for the scale's descriptive categories. In 1946, the International Meteorological Organization (IMO), predecessor to the World Meteorological Organization (WMO), refined these correlations, adopting a set of values based on improved instrumentation and international consensus, which remain the operational standard under WMO Code 1100.[10][11][12] These wind speed values represent the 10-minute average speed, measured at a standard height of 10 meters above the surface in open terrain or over water, to ensure consistency across observations. This averaging period smooths out short-term gusts, providing a reliable mean for comparison with the scale's visual cues. The relationship between Beaufort force number and equivalent wind speed (in m/s at 10 m height) follows a non-linear power law, approximated by the equation which captures the scale's empirical design where higher force levels correspond to disproportionately greater speeds and environmental impacts.[5][13]/04%3A_Atmospheric_Influences/4.4%3A_Measurement_of_Wind) The following table summarizes the wind speed ranges for Beaufort forces 0 through 12, as defined by these standards:[7]| Beaufort Force | Wind Speed (knots) | Wind Speed (mph) | Wind Speed (km/h) |
|---|---|---|---|
| 0 (Calm) | <1 | <1 | <1 |
| 1 (Light air) | 1–3 | 1–3 | 1–5 |
| 2 (Light breeze) | 4–6 | 4–7 | 6–11 |
| 3 (Gentle breeze) | 7–10 | 8–12 | 12–19 |
| 4 (Moderate breeze) | 11–16 | 13–18 | 20–28 |
| 5 (Fresh breeze) | 17–21 | 19–24 | 29–38 |
| 6 (Strong breeze) | 22–27 | 25–31 | 39–49 |
| 7 (Near gale) | 28–33 | 32–38 | 50–61 |
| 8 (Gale) | 34–40 | 39–46 | 62–74 |
| 9 (Strong gale) | 41–47 | 47–54 | 75–88 |
| 10 (Storm) | 48–55 | 55–63 | 89–102 |
| 11 (Violent storm) | 56–63 | 64–72 | 103–117 |
| 12 (Hurricane) | 64–71 | 73–82 | 118–132 |
Extended Scale Levels (13-17)
The extended Beaufort scale was developed in 1944 by the International Meteorological Organization (predecessor to the World Meteorological Organization) to address the limitations of the original scale in describing extreme wind conditions encountered in tropical cyclones, such as hurricanes and typhoons.[4] These additions, levels 13 through 17, extend the "Hurricane" category originally designated for force 12 (redefined to 64–71 knots), providing a framework for winds of exceptional intensity beyond the standard operational range.[14] Unlike the core levels (0-12), which offer distinct observational criteria across various environments, the extended levels primarily emphasize maritime observations in rare, high-wind scenarios, with all classified under the "Hurricane" term to denote their severity.[5] At these levels, sea conditions become extraordinarily chaotic, characterized by devastating effects that severely impair visibility and navigation. The following table outlines the extended levels with sea disturbance effects and wind speed ranges (10-minute average at 10 m height), based on standardized specifications. Land effects are not formally defined due to rarity on land.[9][4]| Beaufort Number | Descriptive Term | Sea Disturbance Effects | Wind Speed (knots) | Wind Speed (mph) | Wind Speed (km/h) |
|---|---|---|---|---|---|
| 13 | Hurricane | The sea is completely covered with long white patches of foam and spray. Visibility greatly reduced. | 72–80 | 83–92 | 133–148 |
| 14 | Hurricane | The sea, completely white, is covered with great patches of foam and spray driven along the direction of the wind. Everywhere the edges of the wave crests are blown into froth. Visibility much reduced. | 81–89 | 93–102 | 150–165 |
| 15 | Hurricane | The sea is completely white with driving spray and streaks of foam. Visibility very seriously affected. | 90–99 | 104–114 | 167–185 |
| 16 | Hurricane | The air is filled with foam and spray. Sea completely white. Very low visibility. | 100–108 | 115–124 | 185–200 |
| 17 | Hurricane | The sea is everywhere white with driving spray. Enormous wave heights with massive breaking crests. Visibility nearly zero. | ≥109 | ≥125 | ≥201 |
Applications
Maritime Observations
The Beaufort scale originated as a tool for mariners to estimate wind force at sea by observing the effects on the ocean surface, such as wave formation and foam, enabling assessments without relying on instruments like anemometers. This visual method focuses on sea state indicators, including the height and length of waves, the presence of whitecaps (breaking crests forming foam), and the extent of spray or spindrift carried by the wind. For instance, at moderate levels, observers note frequent white horses on small waves becoming more pronounced, while stronger conditions feature dense streaks of foam and reduced visibility due to airborne spray. These observations provide a practical means for estimating wind intensity in open water, where direct measurements may be impractical. In sailing, navigation, and shipping, the Beaufort scale plays a key role in recording wind conditions in logbooks, which historically standardized entries to support route planning, sail adjustments, and overall safety. Developed in 1805 by Royal Navy officer Francis Beaufort, it was mandated for British Navy ship logs in 1838 to ensure consistent descriptions of wind force, allowing captains to compare conditions across voyages and optimize vessel handling under sail. These logbook notations, often detailing sea state alongside position and course, facilitated long-term analysis for navigation strategies and weather pattern recognition in shipping operations. Even today, such records contribute to maritime databases used for forecasting and incident review. Historically, the scale was first systematically applied during the 1831–1836 voyage of HMS Beagle, commanded by Robert FitzRoy and organized under Beaufort's influence as Hydrographer of the Navy, where it aided in consistent weather logging while charting South American coasts and the Galapagos Islands. Charles Darwin, recommended through scientific networks influenced by Beaufort and selected by FitzRoy as a naturalist companion, benefited from these standardized observations during the expedition, which supported both navigational decisions and scientific documentation of environmental conditions. In modern contexts, Beaufort scale assessments integrate with technologies like GPS for precise positioning and radar for detecting wave patterns or nearby vessels, enhancing situational awareness in dynamic sea environments where visual cues complement electronic data. For safety, maritime authorities issue warnings based on Beaufort levels, particularly advising small vessels to avoid operations at force 8 or higher, where moderately high waves with breaking crests and significant spray pose risks of capsizing or loss of control. Gale warnings at force 8 (winds 34–40 knots) are broadcast for coastal and offshore areas, urging small craft to seek shelter, as sea heaps up with foam streaks reducing visibility and stability. At these levels and above, protocols emphasize reduced speed, altered courses, and emergency preparations to mitigate hazards for recreational and fishing boats.Terrestrial and Weather Observations
The Beaufort scale was adapted for terrestrial use in the early 20th century to facilitate non-marine wind observations, with descriptions extended to include effects on land features such as smoke, foliage, and structures in 1906.[11] This "weather scale" version emphasized visual cues observable from the ground, enabling consistent reporting without instruments, and was further standardized in 1926 with internationally agreed wind speed equivalents.[11] By the mid-20th century, these land-based criteria were integrated into synoptic weather reports, where observers coded wind force using the scale to contribute to global meteorological analyses. For levels 0 through 12, the terrestrial adaptation correlates wind force to environmental impacts on land, prioritizing observable phenomena like vegetation movement and structural effects over maritime indicators. The following table summarizes these equivalents, drawing from standardized descriptions:| Beaufort Force | Description | Wind Speed (knots) | Terrestrial Effects |
|---|---|---|---|
| 0 | Calm | <1 | Smoke rises vertically; no perceptible motion.[15] |
| 1 | Light air | 1–3 | Smoke shows wind direction; weather vanes inactive.[15] |
| 2 | Light breeze | 4–6 | Wind felt on face; leaves rustle; vanes move slightly.[15] |
| 3 | Gentle breeze | 7–10 | Leaves and small twigs in constant motion; light flags extend.[15] |
| 4 | Moderate breeze | 11–16 | Dust and loose paper raised; small branches sway.[15] |
| 5 | Fresh breeze | 17–21 | Small trees in leaf begin to sway; crested wavelets on inland waters.[16] |
| 6 | Strong breeze | 22–27 | Large branches in motion; whistling in wires; umbrellas hard to control.[16] |
| 7 | Near gale | 28–33 | Whole trees in motion; walking against wind difficult.[16] |
| 8 | Gale | 34–40 | Twigs break from trees; progress impeded by wind.[16] |
| 9 | Strong gale | 41–47 | Widespread structural damage, such as slates removed from roofs; chimney pots dislodged.[16] |
| 10 | Storm | 48–55 | Trees uprooted; considerable damage to buildings; rare inland.[16] |
| 11 | Violent storm | 56–63 | Widespread devastation to structures and vegetation.[16] |
| 12 | Hurricane | 64+ | Extreme destruction, with near-total leveling of weaker constructions.[16] |