
Community hub
Recent from talks
Contribute something
Nothing was collected or created yet.
Circular error probable
View on WikipediaThis article possibly contains original research. (June 2024) |

Circular error probable (CEP),[1] also circular error probability[2] or circle of equal probability,[3] is a measure of a weapon system's precision in the military science of ballistics. It is defined as the radius of a circle, centered on the aimpoint, that is expected to enclose the landing points of 50% of the rounds; said otherwise, it is the median error radius, which is a 50% confidence interval.[1][4] That is, if a given munitions design has a CEP of 10 m, when 100 munitions are targeted at the same point, an average of 50 will fall within a circle with a radius of 10 m about that point.
An associated concept, the DRMS (distance root mean square), calculates the square root of the average squared distance error, a form of the standard deviation. Another is the R95, which is the radius of the circle where 95% of the values would fall, a 95% confidence interval.
The concept of CEP also plays a role when measuring the accuracy of a position obtained by a navigation system, such as GPS or older systems such as LORAN and Loran-C.
Concept
[edit]

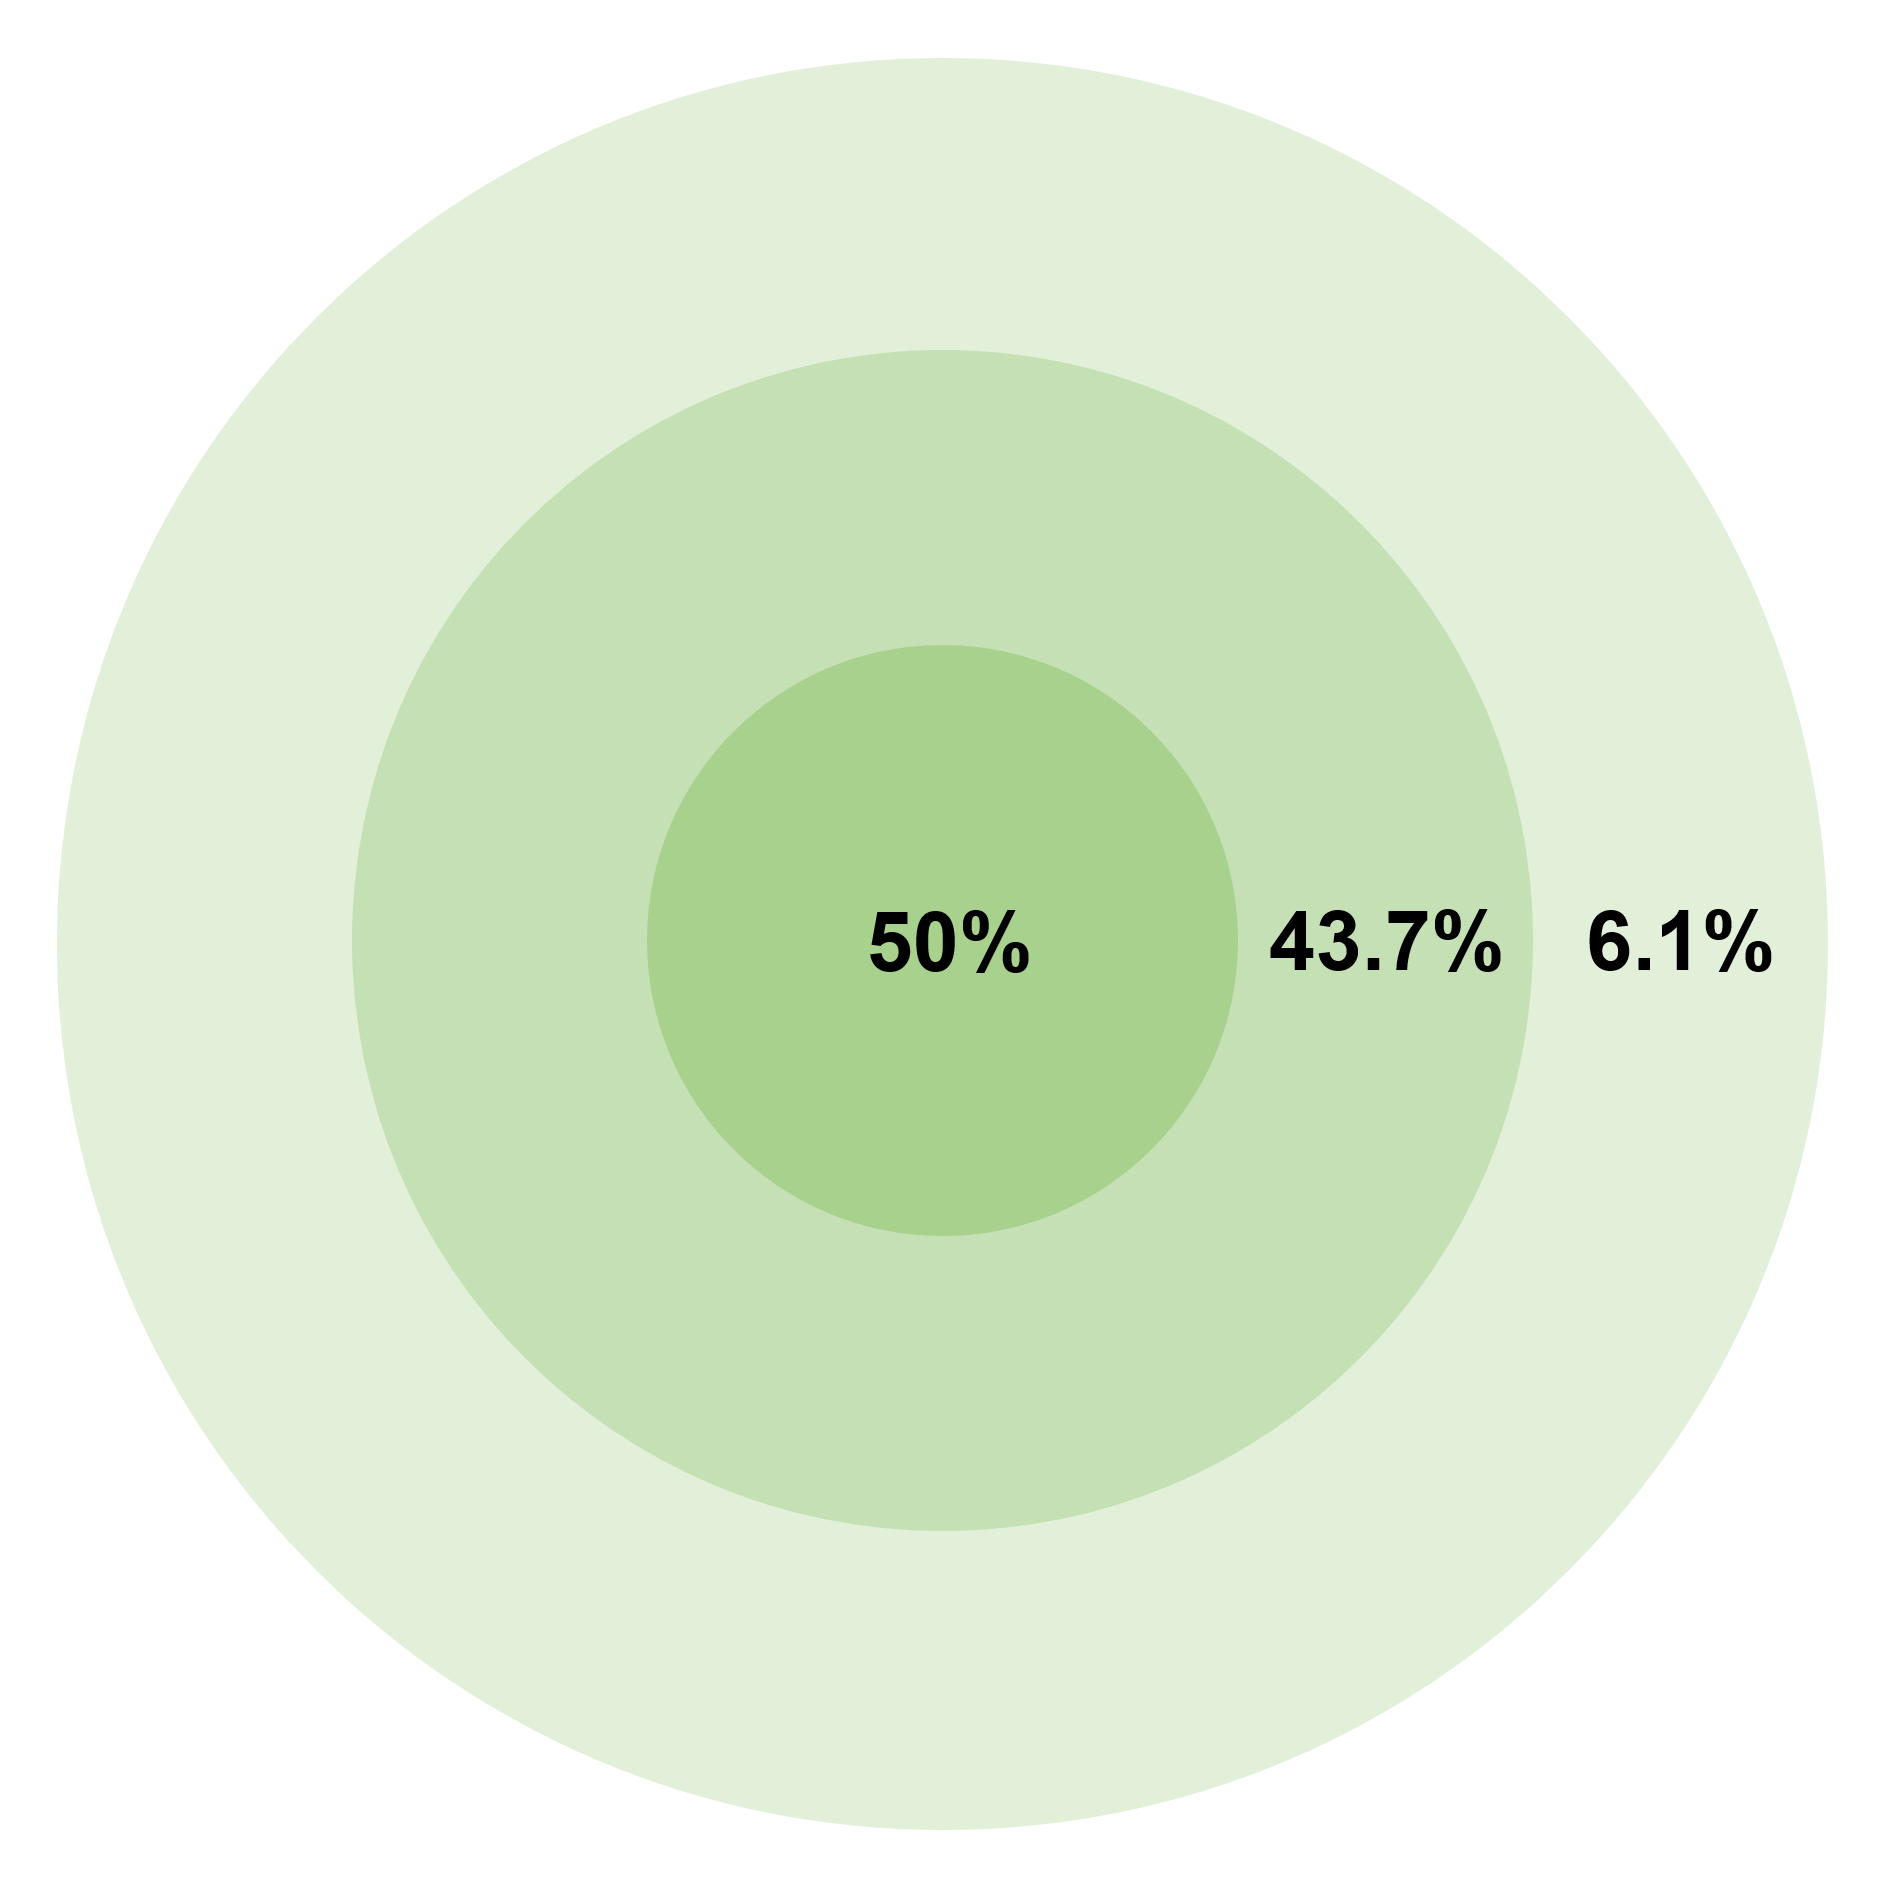
The original concept of CEP was based on a circular bivariate normal distribution (CBN) with CEP as a parameter of the CBN just as μ and σ are parameters of the normal distribution. Munitions with this distribution behavior tend to cluster around the mean impact point, with most reasonably close, progressively fewer and fewer further away, and very few at long distance. That is, if CEP is n metres, 50% of shots land within n metres of the mean impact, 43.7% between n and 2n, and 6.1% between 2n and 3n metres, and the proportion of shots that land farther than three times the CEP from the mean is only 0.2%.
CEP is not a good measure of accuracy when this distribution behavior is not met. Munitions may also have larger standard deviation of range errors than the standard deviation of azimuth (deflection) errors, resulting in an elliptical confidence region. Munition samples may not be exactly on target, that is, the mean vector will not be (0,0). This is referred to as bias.
To incorporate accuracy into the CEP concept in these conditions, CEP can be defined as the square root of the mean square error (MSE). The MSE will be the sum of the variance of the range error plus the variance of the azimuth error plus the covariance of the range error with the azimuth error plus the square of the bias. Thus the MSE results from pooling all these sources of error, geometrically corresponding to radius of a circle within which 50% of rounds will land.
Several methods have been introduced to estimate CEP from shot data. Included in these methods are the plug-in approach of Blischke and Halpin (1966), the Bayesian approach of Spall and Maryak (1992), and the maximum likelihood approach of Winkler and Bickert (2012). The Spall and Maryak approach applies when the shot data represent a mixture of different projectile characteristics (e.g., shots from multiple munitions types or from multiple locations directed at one target).
Conversion
[edit]While 50% is a very common definition for CEP, the circle dimension can be defined for percentages. Percentiles can be determined by recognizing that the horizontal position error is defined by a 2D vector which components are two orthogonal Gaussian random variables (one for each axis), assumed uncorrelated, each having a standard deviation . The distance error is the magnitude of that vector; it is a property of 2D Gaussian vectors that the magnitude follows the Rayleigh distribution, with scale factor . The distance root mean square (DRMS), is and doubles as a sort of standard deviation, since errors within this value make up 63% of the sample represented by the bivariate circular distribution. In turn, the properties of the Rayleigh distribution are that its percentile at level is given by the following formula:


![{\displaystyle F\in [0\%,100\%]}](https://wikimedia.org/api/rest_v1/media/math/render/svg/9008238d27c0e720af3dcce3bc4b398ac593530d)

or, expressed in terms of the DRMS:

The relation between and are given by the following table, where the values for DRMS and 2DRMS (twice the distance root mean square) are specific to the Rayleigh distribution and are found numerically, while the CEP, R95 (95% radius) and R99.7 (99.7% radius) values are defined based on the 68–95–99.7 rule:


| Measure of | Probability |
|---|---|
| DRMS | 63.213... |
| CEP | 50 |
| 2DRMS | 98.169... |
| R95 | 95 |
| R99.7 | 99.7 |

We can then derive a conversion table to convert values expressed for one percentile level, to another.[5][6] Said conversion table, giving the coefficients to convert into , is given by:


| From to | RMS () | CEP | DRMS | R95 | 2DRMS | R99.7 |
|---|---|---|---|---|---|---|
| RMS () | 1.00 | 1.18 | 1.41 | 2.45 | 2.83 | 3.41 |
| CEP | 0.849 | 1.00 | 1.20 | 2.08 | 2.40 | 2.90 |
| DRMS | 0.707 | 0.833 | 1.00 | 1.73 | 2.00 | 2.41 |
| R95 | 0.409 | 0.481 | 0.578 | 1.00 | 1.16 | 1.39 |
| 2DRMS | 0.354 | 0.416 | 0.500 | 0.865 | 1.00 | 1.21 |
| R99.7 | 0.293 | 0.345 | 0.415 | 0.718 | 0.830 | 1.00 |


For example, a GPS receiver having a 1.25 m DRMS will have a 1.25 m × 1.73 = 2.16 m 95% radius.
See also
[edit]References
[edit]- ^ a b Circular Error Probable (CEP), Air Force Operational Test and Evaluation Center Technical Paper 6, Ver 2, July 1987, p. 1
- ^ Nelson, William (1988). "Use of Circular Error Probability in Target Detection". Bedford, MA: The MITRE Corporation; United States Air Force. Archived (PDF) from the original on October 28, 2014.
- ^ Ehrlich, Robert (1985). Waging Nuclear Peace: The Technology and Politics of Nuclear Weapons. Albany, NY: State University of New York Press. p. 63.
- ^ Payne, Craig, ed. (2006). Principles of Naval Weapon Systems. Annapolis, MD: Naval Institute Press. p. 342.
- ^ Frank van Diggelen, "GPS Accuracy: Lies, Damn Lies, and Statistics", GPS World, Vol 9 No. 1, January 1998
- ^ Frank van Diggelen, "GNSS Accuracy – Lies, Damn Lies and Statistics", GPS World, Vol 18 No. 1, January 2007. Sequel to previous article with similar title [1] [2]
Further reading
[edit]- Blischke, W. R.; Halpin, A. H. (1966). "Asymptotic Properties of Some Estimators of Quantiles of Circular Error". Journal of the American Statistical Association. 61 (315): 618–632. doi:10.1080/01621459.1966.10480893. JSTOR 2282775.
- Grubbs, F. E. (1964). "Statistical measures of accuracy for riflemen and missile engineers". Ann Arbor, ML: Edwards Brothers. Ballistipedia pdf
- MacKenzie, Donald A. (1990). Inventing Accuracy: A Historical Sociology of Nuclear Missile Guidance. Cambridge, Massachusetts: MIT Press. ISBN 978-0-262-13258-9.
- Spall, James C.; Maryak, John L. (1992). "A Feasible Bayesian Estimator of Quantiles for Projectile Accuracy from Non-iid Data". Journal of the American Statistical Association. 87 (419): 676–681. doi:10.1080/01621459.1992.10475269. JSTOR 2290205.
- Winkler, V. and Bickert, B. (2012). "Estimation of the circular error probability for a Doppler-Beam-Sharpening-Radar-Mode," in EUSAR. 9th European Conference on Synthetic Aperture Radar, pp. 368–71, 23/26 April 2012. ieeexplore.ieee.org
- Wollschläger, Daniel (2014), "Analyzing shape, accuracy, and precision of shooting results with shotGroups". Reference manual for shotGroups
External links
[edit]Circular error probable
View on GrokipediaDefinition and Fundamentals
Core Definition
Circular error probable (CEP) is a probabilistic measure of accuracy in two-dimensional targeting or positioning systems, defined as the radius of a circle centered on the target point (or aim point) that is expected to enclose 50% of the impacts or measurement errors from a set of shots or observations.[2] This metric quantifies the precision of systems such as munitions, navigation devices, or sensors by focusing on the central tendency of error dispersion in a plane.[4] The 50% probability threshold in CEP corresponds to the median radial error, interpreting the value as the distance within which half of all errors occur, providing a robust indicator of typical performance that is less sensitive to outliers than mean-based measures.[5] Under standard statistical assumptions, such as those involving a bivariate normal distribution for error coordinates, this radius captures the core spread of impacts around the intended point.[2] For instance, in missile testing, a CEP of 100 meters means that approximately half of the warheads from multiple launches would land within a 100-meter radius of the designated aim point, aiding evaluators in assessing system reliability without requiring exhaustive data on every shot.[2] This approach simplifies the communication of accuracy for military and engineering applications. CEP was first formalized in the mid-20th century as a tool for evaluating bombing accuracy, with early applications during World War II where bomber precision was measured in feet using this metric—for example, an average CEP of 1,200 feet in 1943.[6]Underlying Assumptions
The circular error probable (CEP) metric is predicated on the assumption that the errors in the crossrange (x) and downrange (y) directions are independent and follow normal distributions, collectively forming a bivariate normal distribution for the impact points.[7][8] This bivariate normality arises from the central limit theorem, as the cumulative effects of multiple independent random variables—such as guidance, atmospheric, and launch perturbations—tend toward a Gaussian form.[7] Independence between the x and y components, typically indicated by a correlation coefficient of zero, is essential for the validity of this model, ensuring that deviations in one direction do not influence the other.[8][9] A key requirement for CEP is circular symmetry in the error distribution, which implies equal variances (and thus equal standard deviations) in the x and y directions.[7][8] This symmetry results in a radially uniform probability density around the center, akin to the Rayleigh distribution as a special case of the bivariate normal when the mean is at the origin and correlation is absent.[9] Without this equal-variance condition, the distribution becomes elliptical, complicating the direct application of standard CEP formulas and requiring adjustments for ellipticity.[8] CEP assumes that individual shots or measurements are independent, with errors drawn from the same underlying distribution without autocorrelation or clustering effects.[8] Moreover, it exclusively models random errors, necessitating the prior correction or removal of any systematic biases, such as consistent guidance offsets or environmental drifts, to isolate the stochastic component.[7][9] Failure to address these biases can inflate the apparent CEP, as they shift the entire distribution away from the intended center.[8] The target point serves as the true mean of the error distribution, positioned at the origin (0,0) after bias corrections, ensuring that the CEP radius encapsulates the probabilistic spread around this central aim.[7][8] This centering aligns with the metric's focus on random dispersion relative to the expected impact location.[9]Historical Development
Origins in Ballistics
The circular error probable (CEP), defined as the radius of a circle centered on the aim point expected to enclose 50% of bomb impacts, emerged during World War II as a key metric for quantifying the accuracy of aerial bombing conducted by Allied forces against German targets. Operations research teams analyzed bomb impact data from these campaigns to measure dispersion patterns, deriving CEP from statistical analysis of bomb dispersion patterns assuming bivariate normal distributions, providing a practical way to evaluate the effectiveness of unguided munitions under combat conditions. This approach was particularly vital for assessing the performance of systems like the Norden bombsight, which in prewar tests achieved a CEP of approximately 150 feet (46 meters), though actual wartime results were significantly poorer due to factors such as weather and flak.[10] Initial CEP calculations relied heavily on empirical data gathered from range tests and operational bombing runs, allowing analysts to derive accuracy estimates without relying on advanced statistical models that would come later. These methods involved plotting impact points from repeated firings or drops to determine the 50% containment radius, offering a straightforward tool for ballistics experts to compare weapon systems and refine targeting procedures. During the war, such evaluations highlighted the limitations of conventional bombing, with average CEPs of approximately 1,200 feet (366 meters) for Eighth Air Force high-altitude daylight raids in 1943.[11] Following World War II, the U.S. military formally adopted CEP in the 1950s as a standard for evaluating emerging guided munitions, building on wartime data to support the development of more precise artillery and missile systems. This post-war integration marked a shift toward systematic accuracy assessments in munitions testing, with CEP becoming embedded in military doctrine for ballistic applications.[12]Evolution in Modern Systems
During the Cold War, circular error probable (CEP) became a central metric in the testing and evaluation of intercontinental ballistic missiles (ICBMs) and submarine-launched ballistic missiles (SLBMs) by both the United States and the Soviet Union, spanning the 1960s to the 1980s. Advancements in guidance systems, such as inertial navigation improvements, enabled significant reductions in CEP values, transitioning from initial figures in the kilometers range during early deployments to hundreds of meters by the late Cold War period. For instance, U.S. Minuteman III ICBM upgrades in the 1970s reduced CEP from approximately 183 meters to 120 meters, enhancing targeting precision against hardened sites. Similarly, Soviet ICBM programs, including the SS-18 and SS-19 models, incorporated accuracy enhancements that lowered CEP to around 500 meters or better by the 1980s, as assessed in U.S. intelligence evaluations. These developments were integral to strategic deterrence testing at facilities like Vandenberg Air Force Base for the U.S. and Plesetsk Cosmodrome for the USSR, where CEP served as a key performance indicator for warhead delivery reliability.[13][14][15] Following the Cold War, the 1990s marked a pivotal shift in CEP application with the integration of Global Positioning System (GPS) technology into munitions, dramatically improving accuracy in conventional warfare. This evolution was prominently demonstrated during the 1991 Gulf War, where GPS- and laser-guided smart bombs achieved CEPs under 10 meters, a stark improvement over the roughly 100-meter CEPs of unguided munitions used in prior conflicts. The deployment of systems like the GBU-12 Paveway II laser-guided bomb allowed coalition forces to precisely strike Iraqi targets, such as armored columns and command centers, with minimal collateral damage compared to earlier dumb bomb deliveries. This incorporation of satellite navigation not only refined CEP as a benchmark for precision-guided munitions but also set the stage for its broader adoption in post-Cold War military doctrines.[12][16] By 2025, CEP remains a standard metric in the evaluation of hypersonic weapon systems within U.S. Department of Defense (DoD) assessments, reflecting ongoing refinements for high-speed, maneuverable platforms. DoD reports on programs like the Conventional Prompt Strike and Hypersonic Attack Cruise Missile emphasize CEP to quantify terminal accuracy against time-sensitive targets, often targeting sub-10-meter performance despite atmospheric challenges. These evaluations, detailed in annual testing summaries and congressional briefings, underscore CEP's enduring role in verifying the operational viability of hypersonics amid global competition.Mathematical Foundations
Bivariate Normal Distribution Model
The circular error probable (CEP) is fundamentally underpinned by a statistical model that treats impact errors in two dimensions as arising from a bivariate normal distribution. In this framework, the errors in the orthogonal directions—typically denoted as crossrange (x) and downrange (y)—are modeled as jointly normally distributed random variables with their mean vector centered at the target point, assumed to be the origin (0, 0) in the absence of bias. This centering reflects the ideal case where the expected impact location coincides with the aim point.[9] The distribution is characterized by a 2×2 covariance matrix that captures the variances in the x and y directions (σ_x² and σ_y²) along with the covariance between them (σ_xy). This matrix encapsulates the spread and any linear dependence in the error components, allowing for elliptical contours of equal probability density. For scenarios exhibiting circular symmetry, such as isotropic error distributions common in certain ballistics applications, the model simplifies by assuming equal variances (σ_x = σ_y = σ), resulting in a rotationally invariant distribution where the probability contours form perfect circles.[17][9] A key assumption in the standard CEP model is that the x and y errors are uncorrelated, corresponding to a correlation coefficient ρ = 0 between the components. This independence simplifies the joint probability density function and aligns with empirical observations in many unbiased, symmetric systems, where crossrange and downrange deviations do not systematically influence each other. Under these conditions, the bivariate normal reduces to a product of two independent univariate normals when σ_x = σ_y.[17][9] The 50% containment probability central to CEP is derived from the cumulative distribution function (CDF) of this joint bivariate normal distribution, integrated over the disk of radius r centered at the mean. Specifically, the CDF evaluates the probability that the Euclidean distance from the target (√(x² + y²)) is less than or equal to r, yielding the proportion of impacts expected within that circle. For the isotropic, uncorrelated case, this integral corresponds to the CDF of a Rayleigh distribution, providing a direct probabilistic interpretation of the containment radius.[17][9]Calculation Formulas
The circular error probable (CEP) for a system modeled by a bivariate normal distribution with equal standard deviations σ_x = σ_y = σ and no bias is derived from the Rayleigh distribution of the radial error r. The cumulative probability that the radial error is less than or equal to r is given by the integral Setting this equal to 0.5 for the 50% probability level and solving yields so CEP ≈ 1.177 σ.[7] For the more general case of unequal standard deviations σ_x and σ_y (assuming σ_x ≥ σ_y, no bias, and independence), there is no closed-form expression, but an approximation is CEP ≈ \sqrt{\sigma_x^2 + \sigma_y^2} \left(1 - \frac{v}{9}\right)^{3/2}, where v = 2 \frac{\sigma_x^4 + \sigma_y^4}{(\sigma_x^2 + \sigma_y^2)^2}. This formula, based on the Wilson–Hilferty approximation to the chi-square distribution, provides estimates with errors typically under 2% for cases where the standard deviations differ by less than two orders of magnitude.[2] An empirical method to compute CEP from a sample of n impact points involves first centering the data on the sample mean (x̄, ȳ), calculating the radial distances ρ_i = √((x_i - x̄)² + (y_i - ȳ)²) for each point i, and then taking the median of these distances as the estimate of CEP; this non-parametric approach directly approximates the 50% containment radius without assuming the distributional form.[2] When data is limited or the distribution deviates from bivariate normality, Monte Carlo simulations can be used for non-parametric estimation: generate many simulated impact points from the fitted model parameters, compute the smallest radius enclosing 50% of the points for each simulation, and average these radii to obtain the CEP, providing robust validation of parametric approximations.[2]Conversions and Comparisons
Relation to Standard Deviations
The circular error probable (CEP) exhibits a direct proportional relationship to the standard deviation σ in the underlying bivariate normal distribution model, assuming isotropic errors where the variances in the x and y directions are equal (σ_x = σ_y = σ). In this case, the radial error follows a Rayleigh distribution, leading to the conversion CEP ≈ 1.177 σ, where σ represents the common one-dimensional standard deviation. This factor arises from solving for the median radial distance in the distribution.[7] To derive this relation, consider the probability density function of the isotropic bivariate normal distribution centered at the origin: f(x, y) = (1/(2π σ²)) exp(-(x² + y²)/(2 σ²)). Transforming to polar coordinates (r, θ), the joint density becomes f(r, θ) = (r / σ²) exp(-r² / (2 σ²)) for r ≥ 0 and 0 ≤ θ < 2π, which is the Rayleigh distribution for r. The cumulative distribution function is F(r) = ∫_0^r (t / σ²) exp(-t² / (2 σ²)) dt = 1 - exp(-r² / (2 σ²)). Setting F(CEP) = 0.5 yields exp(-CEP² / (2 σ²)) = 0.5, so CEP² / (2 σ²) = ln(2), and CEP = σ √(2 ln 2) ≈ 1.177 σ. Equivalently, since the squared normalized radial distance (r/σ)² follows a chi-squared distribution with 2 degrees of freedom, the factor 1.177 is the square root of the median of this chi-squared distribution, which is 2 ln 2 ≈ 1.3863.[18] More generally, for uncorrelated errors without assuming isotropy, CEP ≈ 0.833 RMS, where RMS (or distance root mean square, DRMS) = √(σ_x² + σ_y²) is the root mean square radial error. This provides a scale-independent estimate that weights the combined variances. For the special case of equal standard deviations, this reduces to the isotropic formula above, as RMS = √2 σ.[19] The multiplier relating CEP to σ generalizes to other containment probabilities p via the Rayleigh CDF, where the radius R_p satisfying P(r ≤ R_p) = p is R_p = σ √(-2 ln(1 - p)). The table below lists key multipliers for common p values in accuracy assessments:| Probability p | Multiplier k_p ≈ √(-2 ln(1 - p)) | Example R_p (for σ = 1) |
|---|---|---|
| 0.50 | 1.177 | 1.177 |
| 0.90 | 2.146 | 2.146 |
| 0.95 | 2.448 | 2.448 |
| 0.99 | 3.039 | 3.039 |
Differences from Other Error Metrics
Circular error probable (CEP) differs from root mean square (RMS) error, particularly in the context of two-dimensional accuracy measures like distance root mean square (DRMS), which is defined as and represents the square root of the average squared distance from the mean.[20] While CEP specifies the radius enclosing 50% of the error points under a bivariate normal distribution, DRMS as a radial measure encloses approximately 65% of the points, providing a less probabilistic but more statistically averaged view of error magnitude. This makes DRMS useful for quantifying overall error dispersion without tying directly to a containment probability, though it requires assumptions about error isotropy for interpretability in navigation systems.[20] In contrast, the R95 metric defines the radius of a circle enclosing 95% of the impact points or position fixes, approximately 2.1 times the CEP value for isotropic errors.[20] This higher confidence level positions R95 as a more conservative measure compared to CEP's median focus, often equating to about 2.45 times the common standard deviation in each axis for normal distributions. R95 is particularly valued in applications requiring assurance of coverage, such as high-confidence targeting where missing a target is costly. The linear error probable (LEP) serves as a one-dimensional counterpart to CEP, representing half the length of the interval containing 50% of the fixes along a single axis, typically 0.675 times the standard deviation in that dimension.[21] Unlike CEP's radial application in planar scenarios, LEP is suited for range-only or linear accuracy assessments, such as along a flight path, without extending to cross-track errors. CEP is generally preferred for evaluating accuracy against circular targets in ballistics and navigation due to its intuitive median representation, whereas R95 is favored for safety margins in munitions to ensure broader coverage and minimize risks like collateral damage.[20]| Metric | Pros | Cons |
|---|---|---|
| CEP | High interpretability as a simple 50% containment radius; computationally straightforward for circular symmetry. | Less conservative, only covers half the errors; sensitive to non-normal distributions.[20] |
| RMS (DRMS) | Balances errors across axes for average magnitude; foundational for deriving other metrics like CEP.[21] | Less intuitive probability (∼65% containment); requires squaring and averaging, increasing computational steps. |
| R95 | Provides high-confidence (95%) enclosure for risk-averse applications; aligns with safety standards.[20] | More data-intensive to estimate accurately; overestimates for skewed errors, leading to conservative designs. |