
Community hub
Recent from talks
Contribute something
Nothing was collected or created yet.
Computer network diagram
View on WikipediaA computer network diagram is a schematic depicting the nodes and connections amongst nodes in a computer network or, more generally, any telecommunications network. Computer network diagrams form an important part of network documentation.
Symbolization
[edit]
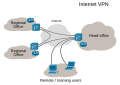
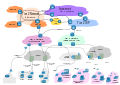
Readily identifiable icons are used to depict common network appliances, e.g. routers, and the style of lines between them indicates the type of connection. Clouds are used to represent networks external to the one pictured for the purposes of depicting connections between internal and external devices, without indicating the specifics of the outside network. For example, in the hypothetical local area network pictured to the right, three personal computers and a server are connected to a switch; the server is further connected to a printer and a gateway router, which is connected via a WAN link to the Internet.[1]
Depending on whether the diagram is intended for formal or informal use, certain details may be lacking and must be determined from context. For example, the sample diagram does not indicate the physical type of connection between the PCs and the switch, but since a modern LAN is depicted, Ethernet may be assumed. If the same style of line was used in a WAN (wide area network) diagram, however, it may indicate a different type of connection.
At different scales diagrams may represent various levels of network granularity. At the LAN level, individual nodes may represent individual physical devices, such as hubs or file servers, while at the WAN level, individual nodes may represent entire cities. In addition, when the scope of a diagram crosses the common LAN/MAN/WAN boundaries, representative hypothetical devices may be depicted instead of showing all actually existing nodes. For example, if a network appliance is intended to be connected through the Internet to many end-user mobile devices, only a single such device may be depicted for the purposes of showing the general relationship between the appliance and any such device.
Cisco symbolization
[edit]Cisco uses its own brand of networking symbols. Since Cisco has a large Internet presence and designs a broad variety of network devices, its list of symbols ("Network Topology Icons") is exhaustive.[2]
Topology
[edit]The physical network topology can be directly represented in a network diagram, as it is simply the physical graph represented by the diagrams, with network nodes as vertices and connections as undirected or direct edges (depending on the type of connection).[3] The logical network topology can be inferred from the network diagram if details of the network protocols in use are also given.
Gallery
[edit]-
-

-
 Overlay network collapsed
 -
 Overlay network broken-up
 -
 xDSL to Internet connectivity
 -
 Triple play illustration
 -
 Internet Distribution and Core
 -
 Internet, Access to core


See also
[edit]References
[edit]- ^ Stephen McQuerry (29 May 2008). "Chapter 1: Building a Simple Network". Network World. Archived from the original on 8 July 2013. Retrieved 16 May 2012.
- ^ "Network Topology Icons". Cisco. Retrieved 16 May 2012.
- ^ "Network Infrastructure". Microsoft. 2012-07-18. Retrieved 16 May 2012.
Computer network diagram
View on GrokipediaOverview
Definition and Purpose
A computer network diagram is a visual representation of a computer or telecommunications network's structure, depicting the devices, connections, and data flow paths within the system.[1][6] These diagrams serve essential purposes in network design and management, including planning layouts to optimize resource allocation, troubleshooting connectivity issues by identifying potential failure points, documenting infrastructure for ongoing maintenance, and communicating designs to stakeholders for collaborative decision-making.[7][8][3] By providing a clear schematic overview, network diagrams simplify the understanding of complex systems, facilitate assessments of scalability for future expansions, and support compliance with regulatory standards such as ISO/IEC 27001, which requires documented network controls to ensure information security.[8][9][10][11] In enterprise environments, they are commonly applied during initial network deployments to map out configurations, system upgrades to evaluate impacts, and audits to verify operational integrity.[3][7]Historical Development
The origins of computer network diagrams trace back to the late 1960s, during the planning and initial development of the ARPANET, the precursor to the modern Internet. Early diagrams consisted of simple hand-drawn sketches mapping host connections and potential topologies, such as Larry Roberts' rough sketch of ARPANET's possible structure, which visualized node interconnections across U.S. research institutions.[12] These rudimentary representations, often created by researchers at organizations like the RAND Corporation and ARPA, focused on illustrating packet-switching concepts and geographical layouts to facilitate collaboration among distributed computing sites.[13] In the 1970s and 1980s, the adoption of layered architectural models profoundly shaped network diagramming practices. The OSI Reference Model, developed through international efforts starting in 1977 and formalized in ISO 7498 by 1984, introduced a seven-layer abstraction that encouraged diagrams to depict network functions hierarchically, separating physical connections from higher-level protocols.[14] Similarly, the TCP/IP protocol suite, which replaced the ARPANET's NCP in 1983, promoted four-layer diagrams illustrating data encapsulation and protocol interactions, influencing visual standards for representing end-to-end communication flows.[15] This era marked a shift from ad hoc sketches to structured, layered visuals that emphasized modularity and interoperability in growing networks. The 1990s brought standardization efforts that professionalized network diagrams, with industry leaders like Cisco Systems contributing iconic symbol sets for common hardware. As Cisco expanded in the early 1990s, its vector icons for routers, switches, and hubs became widely adopted in documentation and design tools, providing consistent visual shorthand for complex topologies.[5] Concurrently, ITU-T recommendations in the Z-series, particularly enhancements to Message Sequence Charts (MSC) during the decade, formalized diagrammatic notations for protocol interactions and system behaviors in telecommunications networks.[16] Post-2000 advancements integrated network diagrams with digital authoring tools, emphasizing scalability through vector-based formats. The acquisition and evolution of Microsoft Visio in 2000 solidified its role as a premier vector diagramming application, enabling dynamic, resolution-independent representations of large-scale networks.[17] Key milestones included the 2000s rise of UML extensions for network modeling, which adapted class and deployment diagrams to analyze distributed system performance and architecture.[18] These developments transformed diagrams from static illustrations into interactive, model-driven artifacts supporting simulation and automation.Elements and Symbols
Standard Components
Computer network diagrams universally incorporate core components to represent the essential elements of a network infrastructure. These include devices such as routers, switches, and endpoints like personal computers (PCs) and servers, which serve as nodes facilitating data processing and transmission.[19] Connections are depicted as lines or arcs symbolizing physical cables or wireless links between devices, while labels provide identifying details such as IP addresses and port numbers to clarify network addressing and access points.[6] Standard conventions govern the visual representation of these components to ensure clarity and consistency across diagrams. Devices are typically illustrated using simple shapes, such as rectangles for general endpoints and switches or circles for routers, promoting abstract and memorable iconography without unnecessary detail.[19] Lines represent connections, with variations in thickness indicating link speeds and colors distinguishing types, for example, blue for copper Ethernet cabling and red for fiber optic or alert conditions.[6] Annotations, including text labels for protocols like VLAN tags, are added adjacent to components to denote operational specifics such as media types or performance metrics.[20] Layered elements from the OSI model are represented in diagram annotations to highlight functional abstractions, particularly the physical, data link, and network layers. The physical layer is shown through cabling and hardware connections, the data link layer via switches and VLAN configurations, and the network layer with routers and IP subnet delineations.[6] These representations, aligned with the OSI reference model defined in ISO/IEC 7498-1, aid in distinguishing physical from logical aspects by emphasizing layer-specific emphases in component depiction.[21] Best practices for standard components emphasize scalability and readability through grouping and explanatory aids. External networks or complex segments are often abstracted using cloud symbols to simplify large-scale views, while enclosures group related devices into functional blocks like security zones.[22] Legends are included to define all shapes, lines, colors, and annotations, ensuring diagrams remain interpretable regardless of the viewer's familiarity.[20]Specialized Symbol Sets
Specialized symbol sets extend the foundational elements of computer network diagrams by providing industry-specific or vendor-defined libraries tailored to particular technologies, devices, or architectures. These sets enable more precise representations in diagrams, such as those depicting proprietary hardware or cloud services, while maintaining compatibility with standard components like nodes and connections.[5] Cisco offers one of the most comprehensive specialized symbol libraries for network diagramming, featuring globally recognized icons for its hardware and software. The library includes symbols for routers (often depicted with arrowhead shapes indicating data flow), firewalls (represented by brick wall patterns symbolizing barriers), and VoIP devices (shown as telephone or endpoint icons). These are distributed through Cisco's official Visio stencil files, which support detailed topology illustrations.[23][24] Other notable specialized sets include Microsoft Visio's built-in networking shapes, which have been available since the software's early versions in the 1990s and encompass icons for various network elements like servers, hubs, and wireless access points.[25] For cloud environments, Amazon Web Services (AWS) provides architecture icons launched in December 2011, designed specifically for diagramming services such as EC2 instances, S3 buckets, and VPCs in cloud-based network layouts.[26] Additionally, symbols aligned with IEEE 802 standards, particularly for wireless technologies like 802.11 (Wi-Fi), are used in diagrams to denote access points, antennas, and signal propagation, drawing from the physical and MAC layer specifications outlined in the standards.[27][28] Adoption of these specialized sets faces interoperability challenges, as varying formats across vendors can complicate integration in multi-tool environments. XML-based formats like Scalable Vector Graphics (SVG) address this by enabling scalable, portable sharing of symbols without loss of detail, facilitating their use across diagramming software.[29] Tools like Lucidchart exemplify practical application through custom shape libraries, where users import SVG files or Visio stencils to create symbols for hybrid cloud environments, such as combining on-premises servers with AWS or Azure components in a single diagram.[30][31]Diagram Types
Physical Diagrams
Physical network diagrams provide a visual representation of the tangible components and layout of a computer network, focusing on the actual hardware devices, their physical interconnections, and spatial arrangements. These diagrams map out the precise placement of equipment such as servers, routers, switches, and workstations, along with the routes of cabling like Ethernet cables or fiber optics, ensuring an accurate depiction of the network's physical topology at the OSI model's Layer 1.[32][33] Key elements in physical diagrams include detailed illustrations of rack layouts, where servers and networking gear are mounted within cabinets, showing port assignments and cable terminations for clarity during maintenance. Distance measurements between devices, environmental considerations such as power sources and cooling systems, and specific media types (e.g., copper versus multimode fiber) are also incorporated to reflect real-world installations. A legend typically accompanies the diagram to explain symbols, colors, and icons representing components like switch stacks or individual ports.[32][34] These diagrams are essential for use cases such as installation planning in data centers, where they facilitate cable management and adherence to standards like TIA-942, which outlines requirements for telecommunications infrastructure including pathways, spaces, and cabling to ensure reliability and scalability. In office environments, they support inventory management by tracking device locations and connections, while in troubleshooting scenarios, they enable quick identification of physical faults like faulty cables or overloaded racks.[33][35] The primary advantages of physical diagrams lie in their high accuracy for hardware-related tasks, allowing teams to plan capacity expansions or optimize layouts for efficiency, such as minimizing cable lengths to reduce signal degradation. However, they have limitations, including the need for frequent manual updates in dynamic environments, which can be labor-intensive without automation tools, and they do not address software configurations or data flows, unlike complementary logical diagrams that abstract functional relationships.[32][34]Logical Diagrams
Logical network diagrams represent the functional and abstract organization of network traffic and protocols, focusing on data flow, addressing schemes, and logical groupings such as subnets and VLANs, while excluding details about physical hardware or cabling layouts.[36][37] These diagrams emphasize how information moves through the network via software-defined paths and configurations, often diverging from the actual physical topology to highlight virtual or protocol-based interactions.[38] By abstracting away tangible elements, they provide a high-level view suitable for understanding network behavior at the protocol and configuration levels.[39] Key elements in logical network diagrams include representations of protocol stacks, such as IP routing paths that illustrate how packets are forwarded between logical segments; security zones, where firewalls act as boundaries to enforce access controls; and virtual connections, exemplified by VPN tunnels that secure data transmission across remote sites.[40][39] These components are depicted using standardized notations for logical entities like IP addresses, VLAN identifiers, and routing protocols, enabling visualization of data transmission without reference to device locations or wiring.[40] Logical network diagrams find application in security auditing to verify policy enforcement and identify vulnerabilities, and software-defined networking (SDN) design to map control plane abstractions over data flows.[41][42] In SDN contexts, they outline the separation of control and data planes, aiding in the orchestration of virtual overlays.[42] One advantage of logical diagrams is their utility in troubleshooting software and configuration issues, as they clearly delineate data paths and protocol interactions for rapid diagnosis.[33] However, a limitation is their tendency to oversimplify hardware constraints, such as bandwidth limitations or physical bottlenecks, which physical diagrams address by providing the underlying hardware context in a single complementary view.[33]Network Topologies
Common Topologies
A computer network topology refers to the arrangement of various elements (links, nodes, etc.) in a computer network, which can be represented physically or logically in diagrams.[43] Common topologies include bus, star, ring, mesh, and hybrid, each offering distinct structural characteristics that influence performance, reliability, and scalability.[44] Bus topology employs a linear backbone cable, known as the bus, to which all devices connect via taps or connectors, enabling shared medium access for data transmission.[45] This design simplifies installation with minimal cabling requirements and low cost, making it suitable for small-scale networks.[46] However, it suffers from a single point of failure—if the backbone cable breaks, the entire network fails—and is prone to collisions in high-traffic scenarios due to the shared medium, limiting scalability for larger or busier environments.[44] Historically, bus topology formed the basis of early Ethernet implementations, such as 10BASE5 standardized in IEEE 802.3 in 1983, which used thick coaxial cable for 10 Mbps transmission over up to 500 meters.[47] The original Ethernet concept, introduced in the 1976 paper by Metcalfe and Boggs, relied on this bus structure for distributed packet switching in local networks.[48] Star topology centers around a hub, switch, or router to which each node connects individually via dedicated links, forming a star-like pattern that centralizes data routing.[49] Its advantages include straightforward fault isolation—issues with one node do not affect others—and ease of expansion by adding connections to the central device, contributing to its prevalence in modern local area networks (LANs).[50] A key drawback is dependency on the central hub; its failure disrupts the whole network, though redundant hubs can mitigate this.[51] This topology dominates contemporary Ethernet LANs, as specified in IEEE 802.3 standards for twisted-pair cabling (e.g., 10BASE-T and later), enabling efficient switched networking at speeds up to 100 Gbps or more.[47] Ring topology arranges devices in a closed loop, where data circulates unidirectionally, often using a token-passing mechanism to control access and prevent collisions.[52] Benefits include predictable performance with equal access opportunities for all nodes and no contention-based delays, supporting consistent throughput in medium-sized networks.[53] Disadvantages arise from its vulnerability to disruptions—a single link or node failure can break the ring, halting traffic until repaired, though dual-ring configurations (e.g., for redundancy) address this partially.[54] It gained prominence in the 1980s through IBM's Token Ring, introduced in 1984 and standardized as IEEE 802.5 in 1989, operating at 4 or 16 Mbps over shielded twisted-pair wiring in logical ring over physical star wiring.[55] Mesh topology interconnects every device (full mesh) or a subset (partial mesh) directly with multiple paths, providing inherent redundancy and fault tolerance.[56] Advantages encompass high reliability—traffic reroutes around failures—and robust security due to dedicated links, ideal for critical applications requiring uninterrupted connectivity.[57] However, it demands significant cabling, configuration complexity, and cost, scaling poorly beyond small networks without partial implementations.[58] In wide area networks (WANs), partial mesh variants appear in protocols like Border Gateway Protocol (BGP), where internal BGP (iBGP) traditionally requires full-mesh peering among routers to exchange routing information, though route reflection relaxes this for larger scales as outlined in RFC 2796.[59] Hybrid topology integrates elements from multiple topologies, such as combining star and bus (star-bus) structures, to leverage their respective strengths for customized network designs.[60] This approach offers flexibility, enhanced scalability, and optimized performance by adapting to specific needs, like using a central bus for backbone connectivity with star-configured endpoints for local segments.[61] Drawbacks include increased design complexity and potential single points of failure inherited from component topologies, necessitating careful planning.[62] Hybrid configurations are emerging in 5G networks to integrate industrial Ethernet with mobile infrastructure, enabling hybrid topologies that support time-sensitive applications through combined wired and wireless elements, as explored in integration scenarios for factory automation.[63]Visual Representations
Visual representations of network topologies in computer network diagrams follow established conventions to clearly illustrate the arrangement of nodes and connections, ensuring clarity and standardization across documentation and design practices. The bus topology is typically depicted as a single horizontal line representing the backbone cable, with nodes connected via vertical taps or short lines branching off from it, symbolizing the shared medium where all devices access the common line.[5] In contrast, the star topology is shown with a central hub or switch icon at the core, from which straight lines radiate outward like spokes to connect peripheral nodes, emphasizing the point-to-point links from the center.[5] The ring topology appears as a closed circular loop of lines encircling the nodes, indicating the sequential connection where data circulates unidirectionally or bidirectionally around the circle.[5] For mesh topologies, diagrams use intersecting lines to connect multiple nodes directly to one another, often in a grid-like pattern for full mesh or selectively for partial mesh, highlighting the multiple redundant paths available.[5] To enhance these basic depictions and convey additional operational details, diagrams incorporate directional arrows along connection lines to indicate data flow, such as unidirectional arrows in ring topologies or bidirectional ones in mesh setups to show traffic directionality.[64] In mesh representations, redundancy is visually emphasized by drawing dual or multiple parallel lines between nodes, illustrating backup paths that maintain connectivity if a link fails. For scalability in large networks, icons like cloud symbols or abbreviated clusters represent aggregated groups of nodes, avoiding the need to detail every individual connection in expansive diagrams. Examples of these conventions appear in simple sketches, such as a bus diagram where multiple computer icons tap into a straight horizontal backbone line, demonstrating easy expansion but potential single-point failure at the cable ends.[5] A detailed star diagram might feature a switch icon in the center with labeled lines extending to endpoint devices like printers and servers, common in office LANs.[67] Ring diagrams often show nodes equally spaced around a loop, as in token ring networks, while mesh examples use crisscrossing lines for high-reliability setups like internet backbones.[5] Real-world applications include campus network diagrams, where star topologies connect buildings to a central data center, visualized with radiating lines from a core router to distributed switches across the site.[5] Depicting complex hybrid topologies, which combine elements like star-bus or mesh-ring, presents challenges in avoiding visual clutter, as overlapping lines and numerous nodes can obscure key relationships and make the diagram difficult to interpret.[68] To address this, digital formats employ layering techniques, where users toggle visibility of connection subsets, or zooming features to focus on specific sections without overwhelming the viewer.[69] These methods ensure that even intricate representations remain navigable, supporting effective analysis and troubleshooting in professional network documentation.[9]Creation and Tools
Manual Methods
Manual methods for creating computer network diagrams rely on traditional drafting techniques, employing basic analog tools to sketch representations of network components and connections. These approaches were the primary means of documentation in the early days of networking, allowing engineers to visualize topologies and layouts without computational aids.[70] Essential tools and materials include graph paper for precise alignment of elements, rulers for straight lines representing connections, and stencils for consistent shapes such as circles or rectangles to depict devices like routers and servers. Colored pencils can further enhance clarity by differentiating elements, for instance, using green to indicate active links and red for inactive ones. These materials facilitate hand-drawn diagrams that capture both physical and logical aspects of small to medium-sized networks.[71][72] The process begins with inventorying all network components, such as devices and their interconnections, followed by sketching an outline of the overall layout on paper. Next, add symbols for devices and lines for links, ensuring minimal crossings to maintain readability; label each element with details like IP addresses or port numbers. Finally, iterate by reviewing and refining the sketch for accuracy and legibility, a method particularly suited for brainstorming sessions or documenting simple networks.[73] Historically, manual diagramming predominated before the widespread adoption of software in the 1990s, as exemplified by Robert Metcalfe's hand-drawn Ethernet diagram in 1976, which illustrated early network concepts through simple sketches. These techniques remain relevant today for on-site troubleshooting, where quick whiteboard sketches enable rapid visualization of issues in real-time field scenarios.[70][74] Despite their accessibility, manual methods are time-consuming for large-scale networks and susceptible to scaling errors, as proportional representation becomes challenging without aids. To improve legibility, employ standardized scales—such as 1:100 for device spacing—and consistent line weights to distinguish link types, though these approaches often give way to software alternatives for complex environments.[75]Software and Automation
Software tools have revolutionized the creation and maintenance of computer network diagrams by providing intuitive interfaces, automation capabilities, and integration options that surpass traditional manual methods. These applications enable users to visualize complex network architectures efficiently, supporting both simple sketches and enterprise-scale representations. Among the most widely adopted software solutions is Microsoft Visio, first launched in 1992 as a diagramming tool that introduced drag-and-drop interfaces for creating network diagrams with predefined stencils for devices like routers and switches. Visio's network diagramming features include shape libraries compliant with standards such as Cisco icons, allowing users to build layered diagrams representing physical and logical topologies. Lucidchart, introduced in 2010, offers a cloud-based platform emphasizing collaborative editing for network diagrams, where multiple users can contribute in real-time via web browsers without requiring software installation. Its features include automated shape alignment and data linking, which dynamically update diagrams based on imported network data sources. Recent AI advancements include Lucid AI for text-to-diagram generation, such as creating flowcharts from prompts, introduced around 2023.[76] For open-source alternatives, draw.io (now part of diagrams.net), available since 2008, provides a free, browser-based tool for generating network diagrams with extensive template libraries and export options, making it accessible for individual users and small teams. It supports integration with storage services like Google Drive and OneDrive, facilitating version control for diagram evolution. Key features across these tools include auto-generation of diagrams from network scans, such as importing data via SNMP protocols to automatically populate device inventories and connections. Real-time updates are enabled through APIs that sync with live network monitoring systems, ensuring diagrams reflect current configurations without manual intervention. Additionally, export functionalities support formats like PDF for documentation and SVG for scalable vector graphics in presentations. Advanced automation extends to integrations with discovery tools like SolarWinds Network Topology Mapper, which uses active scanning to generate baseline diagrams that can be imported into diagramming software for ongoing maintenance. Configuration management platforms such as Ansible further automate diagram creation by parsing infrastructure-as-code definitions to produce visual representations of deployment states. Post-2020 developments have incorporated AI-assisted layout algorithms in tools like Lucidchart and Visio, which optimize node placement and routing paths based on graph theory to reduce visual clutter in large-scale diagrams; for example, Microsoft Visio integrated Copilot AI in 2024 for enhanced diagramming assistance.[77] When selecting software for network diagramming, organizations consider factors such as cost—ranging from free options like draw.io to subscription-based models in Lucidchart starting at $9.00 per user monthly (as of November 2025)—compatibility with vendor-specific integrations like Cisco's network management APIs, and scalability to handle diagrams for networks exceeding thousands of nodes in enterprise environments. These criteria ensure the tool aligns with operational needs, from ad-hoc visualizations to automated, compliance-driven documentation.References
- https://www.cisco.com/c/en/[us](/page/United_States)/about/brand-center/network-topology-icons.html
- https://www.microsoft.com/en-[us](/page/United_States)/microsoft-365/business-insights-ideas/resources/tips-for-mapping-your-network-diagram