
Community hub
Recent from talks
Contribute something
Nothing was collected or created yet.
Tiled web map
View on WikipediaThis article may rely excessively on sources too closely associated with the subject, potentially preventing the article from being verifiable and neutral. (December 2019) |

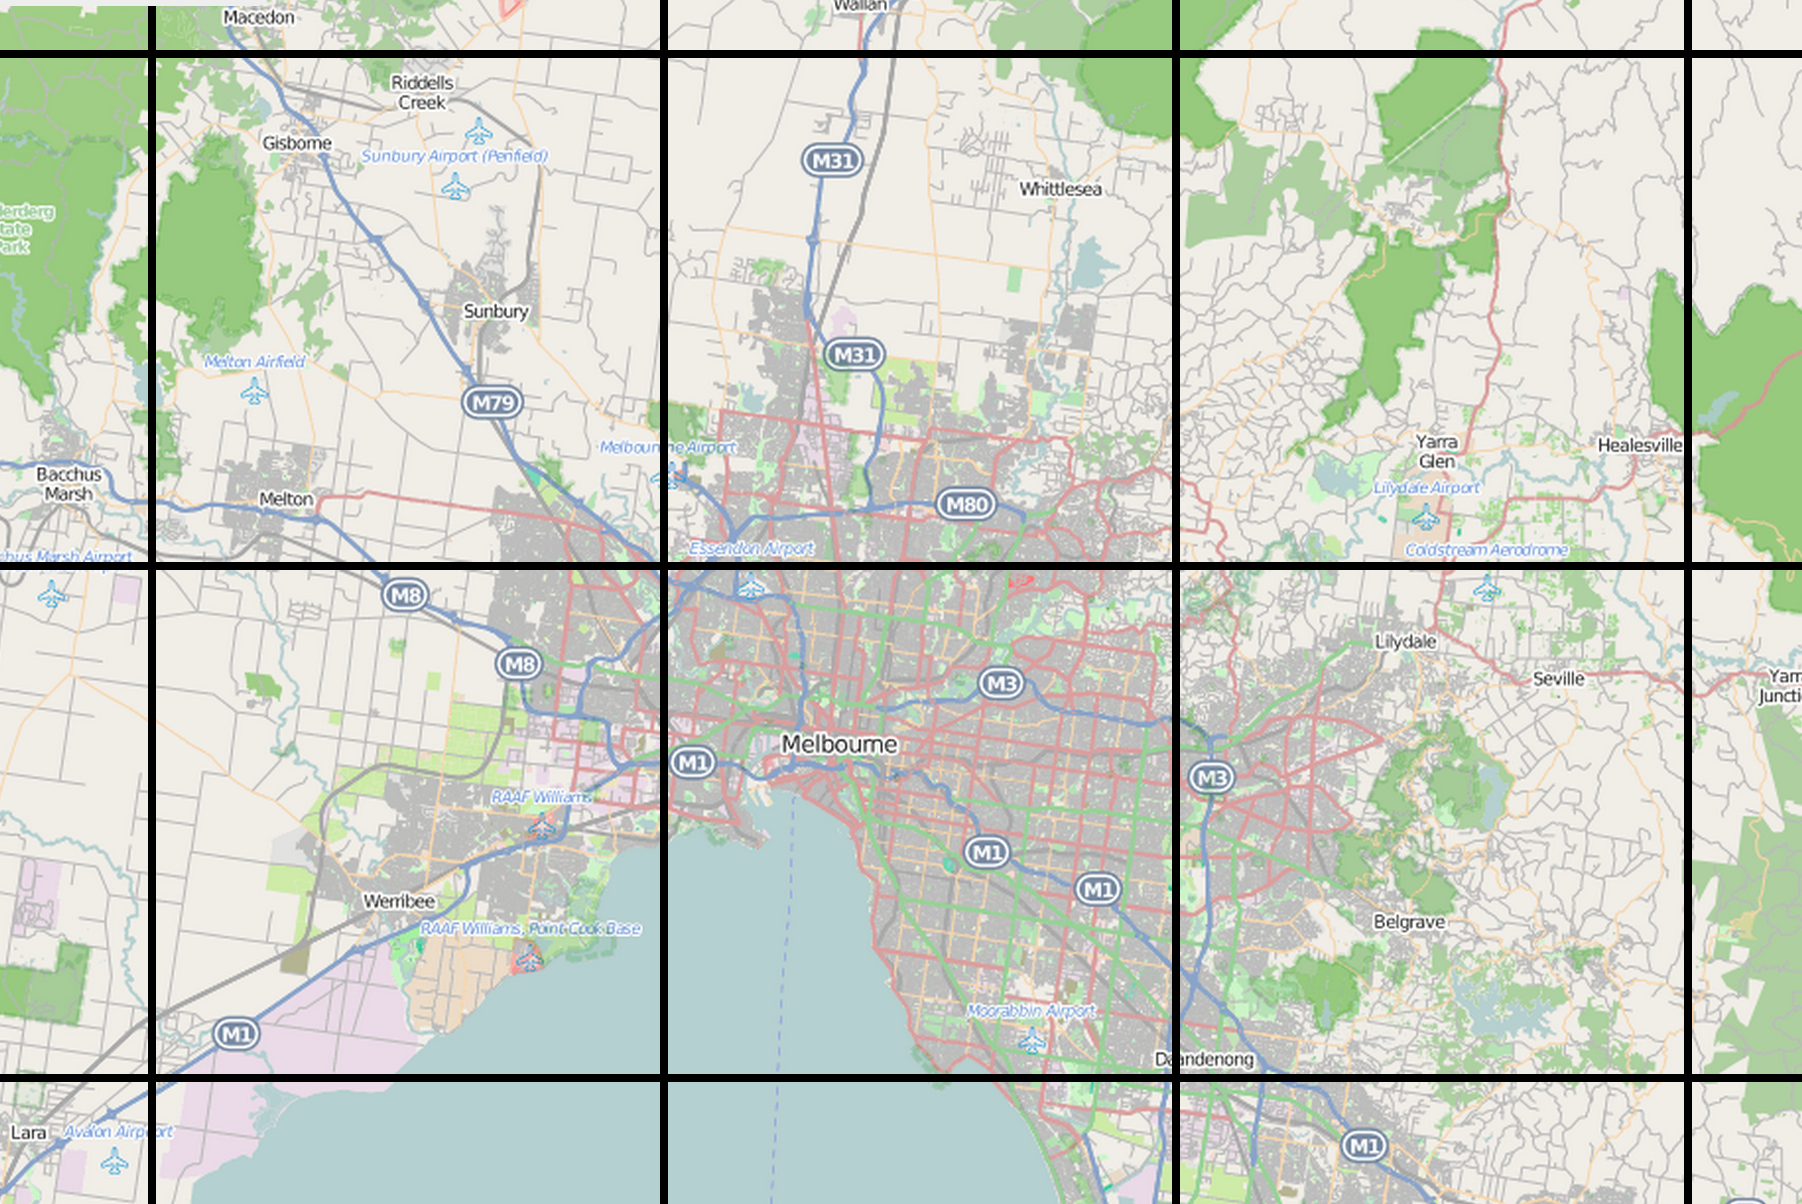
A tiled web map or tile map (also known as slippy map[1] in OpenStreetMap), is a web map displayed by seamlessly joining dozens of individually requested data files, called "tiles". It is the most popular way to display and navigate maps, replacing other methods such as Web Map Service (WMS) which typically display a single large image, with arrow buttons to navigate to nearby areas. Google Maps was one of the first major mapping sites to use this technique. The first tiled web maps used raster tiles, before the emergence of vector tiles.
There are several advantages to tiled maps. Each time the user pans, most of the tiles are still relevant, and can be kept displayed, while new tiles are fetched. This greatly improves the user experience, compared to fetching a single map image for the whole viewport. It also allows individual tiles to be pre-computed, a task easy to parallelize. Also, displaying rendered images served from a web server is less computationally demanding than rendering images in the browser, a benefit over technologies such as Web Feature Service (WFS). While many map tiles are in raster format (a bitmap file such as PNG or JPEG), the number of suppliers of vector tiles is growing. Vector tiles are rendered by the client browser, which can thus add a custom style to the map. Vector map tiles may also be rotated separately from any text overlay so that the text remains readable.
Defining a tiled web map
[edit]
Properties of tiled web maps that require convention or standards include the size of tiles, the numbering of zoom levels, the projection to use, the way individual tiles are numbered or otherwise identified, and the method for requesting them.
Most tiled web maps follow certain Google Maps conventions:
- Tiles are 256x256 pixels
- At the outer most zoom level, 0, the entire world can be rendered in a single map tile.
- Each zoom level doubles in both dimensions, so a single tile is replaced by 4 tiles when zooming in. This means that about 22 zoom levels are sufficient for most practical purposes.
- The Web Mercator projection is used, with latitude limits of around 85 degrees.
The de facto OpenStreetMap standard, known as Slippy Map Tilenames[2] or XYZ,[3] follows these and adds more:
- An X and Y numbering scheme
- PNG images for tiles
- Images are served through a Web server, with a URL like
http://.../Z/X/Y.png, where Z is the zoom level, and X and Y identify the tile.
Tile numbering schemes
[edit]There are three main numbering schemes in use:[4]
- Google Maps / OpenStreetMap: (0 to 2zoom-1, 0 to 2zoom-1) for the range (−180, +85.0511) - (+180, −85.0511)
- Tile Map Service: (0 to 2zoom-1, 2zoom-1 to 0) for the range (−180, +85.0511) - (+180, −85.0511). (That is, the same as the previous with the Y value flipped.)
- QuadTrees, used by Microsoft.
Standards
[edit]Several standards exist:
- Tile Map Service: an early standard supported by OpenLayers. One difference is the y axis is positive northwards in TMS, and southwards in OpenStreetMap.
- Web Map Tile Service: a more recent Open Geospatial Consortium (OGC) standard.
- The de facto XYZ standard referred to above.
- TileJSON: a lightweight JSON description of all the parameters associated with a web map, created by Mapbox.[5]
- Bing Maps Tile System,[6] using Quadkeys for addressing.
Client libraries
[edit]To display a tiled map in a browser usually requires the support of a web mapping framework. This framework handles the retrieval of tiles, display, caching, and user navigation. Popular frameworks for tiled maps include Google Maps API, OpenLayers and Leaflet.
References
[edit]- ^ "OpenStreetMap wiki".
- ^ "Slippy map tilenames - OpenStreetMap Wiki". wiki.openstreetmap.org. Retrieved 2015-06-10.
- ^ "tmcw/xyz_vs_tms.md". GitHub Gists. Retrieved 2015-06-10.
- ^ "Tiles à la Google Maps: Coordinates, Tile Bounds and Projection - conversion to EPSG:900913 (EPSG:3785) and EPSG:4326 (WGS84)". www.maptiler.com. Retrieved 2022-03-01.
- ^ "An Open Platform: TileJSON". mapbox.com. Retrieved 2017-01-05.
- ^ "Bing Maps Tile System". msdn.microsoft.com. Retrieved 2015-06-10.
External links
[edit]Tiled web map
View on Grokipedia{z}/{x}/{y}.[png](/page/PNG) for raster formats or Mapbox Vector Tiles (MVT) for vector ones, with coordinates calculated from latitude/longitude to ensure alignment; this allows browsers to cache tiles and fetch only visible portions, reducing bandwidth and latency.[2][1]
Key standards from the Open Geospatial Consortium (OGC) include the Web Map Tile Service (WMTS), which defines protocols for accessing pre-generated georeferenced tiles over HTTP, and the Two Dimensional Tile Matrix Set (TMS), which specifies tiling schemes for interoperability in geospatial applications.[5][6] Raster tiles deliver static imagery (e.g., PNG or JPEG) suited for basemaps, while vector tiles enable dynamic styling and interactivity on the client side using libraries like Leaflet or Mapbox GL JS, supporting advanced features such as 3D extrusion and real-time updates.[1][2] These elements make tiled web maps essential for services like Bing Maps, which employs a quadkey system for tile addressing, and platforms handling billions of geospatial queries daily.[3]
Fundamentals
Definition and Purpose
A tiled web map is a method for rendering interactive geographic maps in web browsers by dividing the Earth's surface into a grid of small, fixed-size tiles—typically 256×256 pixels—pre-rendered as raster images (e.g., PNG or JPEG) or vector data and dynamically loaded and assembled as users interact with the map. This approach, also known as a slippy map, allows for seamless display of large-scale maps without loading entire images at once, instead fetching only the tiles corresponding to the current viewport.[7] The primary purpose of tiled web maps is to enable efficient delivery and rendering of map data over the internet, particularly for applications requiring real-time interaction, such as navigation systems, geographic information systems (GIS), and location-based services. By loading only visible tiles on demand, this technique minimizes bandwidth consumption, reduces latency, and supports scalability for global datasets, making it feasible to handle vast amounts of geospatial information without overwhelming client devices or servers.[8][1] Key benefits include support for smooth zooming and panning through multi-level tile pyramids, which provide progressively detailed views at different scales, and the ability to overlay vector data for enhanced interactivity, such as custom markers or routes. This architecture facilitates global coverage by pre-generating or caching tiles in a standardized grid, using tile numbering schemes as a mechanism for precise retrieval. Tiled web maps have been foundational to services like Google Maps, introduced in 2005 to revolutionize online navigation with its tile-based slippy interface, and OpenStreetMap, which adopted the approach from 2006 onward to deliver crowdsourced mapping data efficiently.[9][4][10]Historical Development
The roots of tiled web mapping technology trace back to pre-web geographic information systems (GIS) developed in the 1970s, which laid the groundwork for spatial data handling and visualization. Pioneering efforts included the Canada Geographic Information System (CGIS), operational from 1971, which enabled land-use analysis through vector data overlays, and the ODYSSEY GIS at Harvard Laboratory, initiated in the mid-1970s for vector-based polygon processing.[11] These systems emphasized computational mapping but were limited to mainframe environments without web integration. By the 1990s, the rise of the World Wide Web introduced early web GIS using static images embedded in HTML pages, often generated server-side with tools like Esri's ArcIMS or MapServer. A seminal example was the Xerox PARC Map Viewer in 1993, the first interactive web-based map, which rendered GIF images dynamically via Perl scripts to support basic querying and zooming.[12] These static approaches, however, suffered from slow reloads and limited interactivity, setting the stage for tiled innovations.[13] The pivotal shift to dynamic tiled web mapping occurred in the mid-2000s, driven by advancements in web technologies. The introduction of Asynchronous JavaScript and XML (AJAX) in 2005 enabled seamless client-server communication, allowing maps to load image tiles incrementally without full page refreshes. This technique was exemplified by the launch of Google Maps in February 2005, which divided maps into small raster tiles (typically 256x256 pixels) served over HTTP, revolutionizing user experience with smooth panning and zooming known as "slippy maps." Microsoft Virtual Earth, released in 2005 and updated in 2006, further popularized the slippy map concept by integrating aerial imagery with tiled rendering, influencing competitors to adopt similar architectures. Concurrently, OpenStreetMap (OSM), founded in 2004, embraced tiled rendering in 2006 using early tile schemes later formalized in the Tile Map Service (TMS) specification to support crowdsourced data visualization, fostering open-source alternatives to proprietary systems.[13] In the 2010s, tiled web mapping evolved from predominantly raster-based tiles to hybrid raster-vector approaches, enhancing flexibility and performance. Raster tiles dominated the 2000s for their simplicity in pre-rendering styled images, but vector tiles—encoding raw geometric data in formats like Mapbox Vector Tile (introduced around 2010)—gained traction for enabling client-side styling and interactivity via WebGL. This transition supported scalable, customizable maps, as seen in platforms like Mapbox and Google Maps adopting vector rendering. The proliferation of mobile web access post-2010, fueled by smartphones and responsive design, further drove responsive tiling to optimize bandwidth and rendering on varied devices, reducing data loads for on-the-go users. Standardization efforts by the World Wide Web Consortium (W3C) in the 2010s, including the Maps for HTML Community Group chartered in 2013, aimed to integrate native map elements into HTML5, promoting interoperable tiled map widgets without proprietary plugins.[14][15] In the 2020s, vector tiles became the predominant format for tiled web maps, offering superior performance and customization. Major platforms, including OpenStreetMap, deployed vector tiles in July 2025, while collaborative initiatives like Overture Maps integrated open datasets into tiled formats to support advanced geospatial applications.[16][17]Technical Components
Tile Generation Process
The tile generation process for tiled web maps involves preparing geographic data from vector or raster sources into discrete tiles, which can be either raster images or vector-encoded data, typically using specialized map servers or libraries. This can occur through pre-generation, where tiles are computed and stored in advance for static maps with infrequent updates, or on-the-fly rendering, which dynamically produces tiles in response to user requests for more current or customized data. Pre-generation is common for base layers like those from OpenStreetMap, enabling faster client-side loading, while on-the-fly approaches suit dynamic content such as real-time traffic overlays.[18][19] The process for raster tiles follows a series of key steps to transform raw data into usable image tiles. First, data ingestion loads sources such as shapefiles, GeoJSON files, or spatial databases like PostGIS, which store vector features (e.g., roads, buildings) or raster imagery (e.g., satellite photos). Second, the data undergoes projection transformation, often converting to Web Mercator (EPSG:3857) to align with standard web map schemes. Third, rasterization renders the projected data into images at multiple zoom levels, applying styling rules for symbology, labels, and colors to simulate different scales—from global overviews at low zoom to street-level detail at high zoom. Finally, the rendered images are divided into a grid of fixed-size tiles, usually 256x256 pixels, and stored in formats like hierarchical directories or single-file databases.[20][21] For vector tiles, the process differs by avoiding rasterization and instead focusing on partitioning and encoding vector data for client-side rendering. After data ingestion and projection transformation similar to raster tiles, vector features are generalized or simplified based on zoom levels to manage complexity and file size. The data is then sliced into spatial extents corresponding to the tile grid, with features within each extent encoded into a binary format such as Mapbox Vector Tiles (MVT), which uses Protocol Buffers to store geometries, attributes, and metadata efficiently. This enables dynamic styling, interactivity, and scalability without pre-rendering images.[22][23] Libraries such as Mapnik and GDAL are widely used for raster tile tasks, with Mapnik excelling in vector rendering through XML-based stylesheets that define layers and visual rules, and GDAL handling raster processing via utilities like gdal2tiles for efficient pyramid generation across zoom levels. For vector tiles, tools like Tippecanoe convert GeoJSON or other vector sources into MVT tiles, while Planetiler generates large-scale tilesets from OpenStreetMap data. Output tiles are typically compressed images in PNG or JPEG formats for raster tiles to balance quality and file size, supporting transparency in PNG for overlay compatibility, whereas vector tiles use compact binary formats like .pbf. For storage, the MBTiles specification packages tiles into a single SQLite database file, facilitating offline access and efficient querying by zoom, column, and row coordinates, and supports both raster and vector tiles.[20][21][24][25] Generating tiles for large-scale coverage presents significant challenges, particularly with global datasets that can require billions of tiles—for instance, covering Earth at 20 zoom levels exceeds 10^12 tiles, demanding substantial computational resources and storage. Handling such volumes often involves distributed processing or cloud-based pipelines to manage time and cost, while updating tiles for dynamic data like traffic or weather requires strategies to invalidate and regenerate only affected regions without full recomputation.[26][27]Coordinate Systems and Projections
Tiled web maps predominantly employ the Web Mercator projection, designated as EPSG:3857, which serves as the de facto standard due to its seamless integration with spherical Earth models and straightforward mathematical operations that facilitate uniform square tiling across global extents.[28] This projection, also known as Pseudo-Mercator or Spherical Mercator, treats the Earth as a sphere with a radius of approximately 6,378,137 meters, enabling efficient rendering of web-based maps by services such as Google Maps and OpenStreetMap.[29] Its conformality preserves local shapes and angles, making it suitable for interactive navigation, though it introduces scale distortions that increase toward the poles.[30] In this coordinate system, geographic coordinates in latitude (φ) and longitude (λ) are transformed into planar pixel coordinates for tiling purposes, primarily using spherical Mercator formulas to support global views without singularities at the equator. The easting (x) coordinate is derived simply as , where is the Earth's spherical radius and is the longitude in radians; the northing (y) follows the Mercator-specific formula , projecting the spherical surface onto a plane.[29] These transformations yield meters-based coordinates ranging from approximately -20,037,508 to +20,037,508 in both x and y directions, covering the valid extent from 85.051° N to 85.051° S latitude.[31] Pixel coordinates within the map view are then scaled relative to the tile grid, allowing seamless subdivision for rendering. Zoom levels in tiled web maps operate on discrete scales that progressively refine detail, with each increment in zoom level doubling the resolution by quadrupling the number of tiles—resulting in tiles along each side of the global grid for standard 256×256 pixel tiles.[31] The ground resolution, or meters per pixel, at a given latitude varies longitudinally and is calculated as , where is latitude in radians; at the equator and zoom 0, this yields about 156,543 meters per pixel, halving with each zoom increase.[29] This hierarchical structure ensures consistent pixel-to-world scaling, with tile numbering schemes indexing these coordinates to enable efficient retrieval and caching of specific map sections.[31] Despite its prevalence, the Web Mercator projection exhibits significant limitations, particularly severe area distortions near the poles where high-latitude regions like Greenland appear disproportionately enlarged compared to equatorial areas.[32] The projection's validity is restricted to latitudes below approximately ±85°, beyond which tiles become infinitely stretched, rendering polar regions impractical for accurate representation in standard tiled schemes.[30] For non-interactive applications or thematic mapping requiring minimal distortion, alternatives such as the Plate Carrée (equirectangular) projection under EPSG:4326 are preferred, as they maintain equal degrees per pixel across the globe without meridional convergence, though they sacrifice shape preservation.[32]Tile Numbering Schemes
The XYZ numbering scheme is the de facto standard for identifying tiles in web mapping services, employing three integer coordinates: z for zoom level, x for the horizontal column index, and y for the vertical row index. This scheme divides the world map into a grid where, at zoom level z, the total number of tiles is in both the x and y dimensions, covering the full extent from longitude -180° to +180° and latitude approximately -85.0511° to +85.0511°. The origin (0,0) is positioned at the northwest corner of the map, with x values increasing eastward (rightward) and y values increasing southward (downward), aligning with typical screen coordinate systems.[31][29] To derive tile coordinates from geographic longitude () and latitude () in degrees, the coordinates are first converted to radians and mapped using the Spherical Mercator projection (EPSG:3857). The x coordinate is calculated as: The y coordinate uses the inverse Mercator formula: These formulas ensure tiles align precisely with the projection's grid, enabling seamless stitching across the map.[31][29] A key variation is the Tile Map Service (TMS) scheme, defined by the OSGeo community, which mirrors the XYZ grid size and zoom structure but inverts the y-axis: the origin is at the southwest corner, with y increasing northward (upward). To convert between XYZ and TMS y-coordinates at a given zoom z, the relation is . Services like Google Maps and Bing Maps adhere strictly to the XYZ scheme with its northwest origin, while OpenStreetMap also uses XYZ but handles antimeridian wrapping (longitude ±180°) consistently to avoid discontinuities in tile requests.[29] Tiles are requested over HTTP using a simple RESTful URL pattern, typicallyhttps://example.com/{z}/{x}/{y}.png or similar extensions like .jpg, where the path segments directly encode the coordinates. This hierarchical structure supports efficient caching in content delivery networks (CDNs), as identical requests can be served from edge caches, reducing latency and bandwidth for repeated views of the same tile across users or sessions.[33][31]
Standards and Interoperability
Core Web Standards
Tiled web maps rely on core web standards to ensure efficient delivery, rendering, and interaction with map tiles across diverse browsers and devices. The Hypertext Transfer Protocol (HTTP) forms the backbone for requesting and serving these tiles, with HTTP/1.1 providing foundational mechanisms for persistent connections and basic caching to reduce latency in tile fetches.[34] HTTP/2 extends this by introducing multiplexing, allowing multiple tile requests to be handled concurrently over a single connection, which is particularly beneficial for loading numerous small tile images without the head-of-line blocking issues of HTTP/1.1.[35] HTTP/3, standardized in 2022 and based on QUIC, further improves performance by enabling faster connection establishment and better handling of packet loss, commonly recommended for tile services as of 2025.[36] Caching directives such as Cache-Control headers specify expiration times for stored tiles, enabling browsers to reuse them without repeated server queries, while Entity Tags (ETags) facilitate validation of cached content to avoid unnecessary downloads if tiles remain unchanged.[37][38] Image formats standardized for the web are critical for balancing quality, file size, and browser compatibility in tiled maps. The Portable Network Graphics (PNG) format is widely used for its lossless compression and support for transparency, ensuring crisp rendering of map features like labels and overlays without artifacts.[39] WebP, developed by Google, offers superior compression for both lossy and lossless images compared to PNG or JPEG, reducing tile sizes by up to 34% while maintaining visual fidelity, and has been supported in major browsers since the early 2010s (e.g., Chrome from 2013).[40][41] This format is increasingly adopted in web mapping applications to accelerate loading times, as demonstrated in 3D tile streaming where WebP enables faster performance over traditional formats.[42] Accessibility standards ensure that tiled web maps are usable by people with disabilities, aligning with the Web Content Accessibility Guidelines (WCAG) 2.1, which emphasize perceivable, operable, understandable, and robust content.[43] For map interactions, WCAG principles guide keyboard navigation, sufficient color contrast for visual elements, and scalable text for zoom controls to support users with motor or visual impairments. The Accessible Rich Internet Applications (ARIA) suite complements this by defining roles and attributes for dynamic content, such as applying role="img" to tile containers or aria-live regions to announce updates like pan or zoom events, enabling screen readers to convey map changes effectively.[44][45] These techniques promote compliance with WCAG success criteria, such as 1.4.10 (Reflow) for responsive map layouts and 2.1.1 (Keyboard) for operable controls.[46] Security protocols safeguard tile delivery and prevent vulnerabilities in cross-origin scenarios. HTTPS is enforced for all tile resources to avoid mixed-content warnings, where an HTTPS-hosted map page attempts to load HTTP tiles, potentially exposing users to interception; browsers block such insecure requests to maintain end-to-end encryption.[47][48] Cross-Origin Resource Sharing (CORS) policies, implemented via headers like Access-Control-Allow-Origin, regulate tile loading from external domains, allowing web applications to fetch tiles securely while restricting unauthorized access and mitigating risks like data exfiltration.[49] In practice, map services configure CORS to permit specific origins, ensuring tiles integrate seamlessly into client-side applications without compromising browser sandboxing.[50]Common Tiling Protocols
The Web Map Tile Service (WMTS), standardized by the Open Geospatial Consortium (OGC) in 2010, defines a protocol for serving pre-rendered or dynamically generated map tiles over the web to improve performance and scalability compared to on-the-fly rendering.[51] It employs XML-based documents to describe service capabilities, including supported layers, styles, formats, and tile matrix sets that specify the hierarchical structure of tiles at various scales and resolutions.[5] The core GetTile operation allows clients to request specific tiles via HTTP GET requests, using parameters such as layer identifier, style, tile matrix set, matrix level, row, and column to retrieve images in formats like PNG or JPEG.[51] The Tile Map Service (TMS), developed by the Open Source Geospatial Foundation (OSGeo) and finalized in version 1.0 around 2007, provides a simpler, RESTful protocol for accessing tiled map data through a pyramid of multi-resolution images.[52] Servers expose tile resources via straightforward URL patterns, such as /{version}/{tileset}/{z}/{x}/{y}.{format}, where z, x, and y denote zoom level, column, and row, respectively, enabling direct HTTP requests without complex parameter encoding.[52] Although TMS has been largely superseded by the more comprehensive WMTS for broader interoperability, it remains in use for its lightweight implementation in open-source mapping applications and caching systems.[53] Vector tiles, governed by the Mapbox Vector Tile specification released in 2015 (version 2.0), introduce a binary-encoded format known as Mapbox Vector Tile (MVT) for delivering geospatial vector data in a tiled structure, contrasting with traditional raster tiles.[22] The MVT format uses Protocol Buffers to pack layers of geometric features, attributes, and extents into compact tiles, typically following the XYZ tiling scheme, which supports efficient transmission and parsing.[22] This approach enables dynamic client-side styling and rendering, where applications can apply custom visualizations, filters, and interactions to the raw vector data without server-side dependencies, enhancing flexibility for interactive web maps.[54] More recent OGC standards, such as OGC API - Tiles (adopted 2022) and OGC API - Maps Part 1: Core (approved 2024), provide modern RESTful APIs for accessing and serving tiled geospatial data, including both raster and vector tiles. These build on concepts from WMTS and the OGC Two Dimensional Tile Matrix Set, emphasizing machine-readable metadata and integration with broader OGC API ecosystem for enhanced web-based interoperability as of 2025.[55][56] These protocols promote interoperability through OGC compliance, allowing multi-vendor systems to exchange tiled map data seamlessly; for instance, WMTS services can integrate with Web Map Service (WMS) endpoints to combine cached tiles with dynamic, on-demand rendering in hybrid scenarios.[5][57]Implementation Approaches
Client-Side Rendering Techniques
Client-side rendering in tiled web maps primarily relies on browser technologies to fetch, position, and display image or vector tiles dynamically as users interact with the map. The Canvas API enables efficient overlaying of tiles by drawing them directly onto a 2D context, allowing for pixel-level manipulation and smooth compositing of multiple layers without the overhead of individual DOM elements.[58] In contrast, SVG supports vector-based rendering for scalable graphics, preserving quality during zooms but incurring higher performance costs for large numbers of elements due to DOM integration.[59] For slippy maps, DOM-based grids position tiles as<img> elements in a responsive layout, with JavaScript handling events like wheel for zooming and drag for panning to update tile visibility and fetch new ones.[58]
Optimization techniques enhance rendering efficiency by anticipating user actions and reducing visual artifacts. Preloading adjacent tiles via JavaScript prefetching ensures seamless panning by loading tiles outside the current viewport in advance, minimizing delays during movement.[60] Mipmapping generates multi-resolution tile variants to enable smooth zooming, where lower-resolution mip levels are used during transitions to avoid aliasing and improve frame rates.[59] WebGL extends these capabilities for 3D and tilt views, as implemented in libraries like CesiumJS, which renders tiled geospatial data on a globe using hardware-accelerated shaders for high-fidelity, interactive 3D scenes.[61]
Interactivity is facilitated through JavaScript event listeners that support multi-touch gestures on devices, such as pinch-to-zoom and swipe-to-pan, integrated with tile coordinate calculations for responsive feedback.[62] For vector tiles, libraries like Mapbox GL JS apply dynamic styling via JSON specifications, allowing real-time theme changes and feature queries for hover effects or clicks without reloading raster images.[62]
Performance benchmarks emphasize low-latency tile handling to maintain fluid interactions; vector tiles typically outperform raster for dynamic zooms by requiring fewer requests (1-2 vs. up to 40 tiles).[63] WebGL-based renderers can manage over 100,000 elements per viewport at 60 fps, supporting 100+ tiles simultaneously in complex scenes.[59]
Server-Side Infrastructure
The server-side infrastructure for tiled web maps typically revolves around tile servers that process spatial data to generate and serve map tiles efficiently. These servers often leverage databases like PostGIS within PostgreSQL to handle spatial queries and produce vector tiles using functions such as ST_AsMVT and ST_AsMVTGeom, which clip geometries to tile bounds in projections like EPSG:3857.[64][65] Implementations can use lightweight frameworks in languages like Python for minimal HTTP services that convert XYZ tile requests into SQL queries, or Go-based servers like pg_tileserv that directly execute SQL and return Mapbox Vector Tiles (MVT) with configurable parameters for resolution and feature limits.[64][66] For storage, cloud object stores such as Amazon S3 are commonly used to cache pre-generated tiles, enabling scalable access while reducing database load.[67] To handle high volumes of requests, scaling mechanisms distribute load across multiple instances. Load balancers, such as Amazon Elastic Load Balancing, route traffic to clusters of EC2 instances running tile servers, automatically failing over to healthy nodes.[68] Content Delivery Networks (CDNs) like Amazon CloudFront further optimize global distribution by caching tiles at edge locations, minimizing latency for users worldwide.[68][67] Batch updates to tile sets are managed through job queues, where a central processor analyzes CDN logs and propagates changes to storage backends like S3, ensuring consistency without overwhelming rendering resources.[68] Tile generation can occur dynamically or via precomputed pyramids, depending on traffic and update frequency. Dynamic rendering, as in TileServer GL, uses engines like MapLibre GL Native to rasterize vector tiles on-demand, supporting formats like PNG and PBF without upfront processing, though it increases CPU demands for concurrent requests.[69][70] In contrast, precomputed tile pyramids—built once using tools like GDAL and stored in formats such as MBTiles or GeoPackage—enable faster serving for high-traffic sites by offloading computation, as seen in setups with MapTiler Server.[69][19] Effective monitoring ensures reliability, tracking metrics like cache hit rates to maintain performance and reduce origin server strain.[71] Tools such as Prometheus integrate with CDN APIs to monitor backend health and error rates, alerting on issues like connection limits that could spike failures to 4% or higher.[71] Error handling for missing tiles often involves fallback mechanisms, such as proxy caching with Varnish or default placeholders, to prevent user-facing disruptions.[66][71]Libraries and Frameworks
Client Libraries
Client libraries for tiled web maps are primarily JavaScript frameworks that enable browser-based rendering of map tiles, handling user interactions, and integrating geospatial data on the frontend. These libraries fetch pre-generated tiles from servers via protocols like XYZ or WMTS, overlaying them on interactive canvases while supporting features such as zooming, panning, and layer management. Popular options emphasize ease of use, performance, and extensibility through plugins or modules, making them suitable for web applications ranging from simple embeds to complex GIS interfaces.[72][73][74] Leaflet, released in 2010 by Volodymyr Agafonkin, is a lightweight, open-source JavaScript library designed for mobile-friendly interactive maps. It supports standard XYZ tile schemes for raster layers, along with vector overlays, markers, popups, and drawing tools, all extensible via a rich ecosystem of plugins for advanced functionality like geocoding or clustering. With a core footprint of approximately 42 KB, Leaflet prioritizes simplicity and speed, operating under the BSD 2-Clause license to facilitate broad adoption in web development.[72][75][76] OpenLayers, initiated in 2006 by MetaCarta, offers a more comprehensive feature set for handling Open Geospatial Consortium (OGC) standards in web mapping applications. It natively supports protocols such as Web Map Tile Service (WMTS) and Tile Map Service (TMS), enabling seamless integration of tiled layers, vector data, and WMS/WFS services for enterprise-level GIS workflows. Known for its robustness in complex scenarios, OpenLayers is widely used in professional environments requiring strict compliance with geospatial standards and is distributed under the BSD 2-Clause license.[73][77][78] Mapbox GL JS, introduced in 2015, focuses on high-performance rendering of vector tiles using WebGL for dynamic, styleable maps with 3D capabilities such as terrain extrusion and globe views. It processes Mapbox Vector Tiles (MVT) format for efficient client-side styling and supports runtime data visualization, including real-time updates and custom sources. Mapbox GL JS is under a proprietary license requiring agreement to Mapbox's Terms of Service, which may introduce dependencies on vendor services for full functionality. For an open-source alternative, MapLibre GL JS, a community-driven fork, provides similar high-performance vector tile rendering under a BSD-3-Clause license.[79][80][74][81] MapLibre GL JS, forked from Mapbox GL JS in 2020, is an open-source library under the BSD-3-Clause license, offering high-performance WebGL rendering of vector tiles with 3D features, dynamic styling, and no vendor dependencies, making it a popular choice for customizable web maps as of 2025.[81] In comparisons, Leaflet excels in simplicity and low overhead, ideal for quick prototypes or resource-constrained sites, whereas OpenLayers provides superior depth for OGC-compliant projects in sectors like government and utilities. Adoption metrics highlight Leaflet's dominance in lightweight applications, powering a significant portion of OpenStreetMap embeds and general web maps by 2023, while OpenLayers maintains strong usage in feature-heavy enterprise deployments. Mapbox GL JS and MapLibre GL JS stand out for visually rich, 3D-enabled maps but may introduce dependencies on vendor services in the case of Mapbox.[72][73][76]Server-Side Tools
Mapnik, initiated in 2005, serves as a foundational C++ rendering engine for generating high-quality raster map tiles from geospatial data sources.[82] It excels in producing visually appealing maps through advanced anti-aliasing techniques and supports integration with Node.js via the node-mapnik library, enabling dynamic tile generation on demand for web applications.[83] Furthermore, Mapnik handles multiple map projections natively, allowing seamless transformation of input data across systems like Web Mercator (EPSG:3857) and others defined in its projection database.[84] Tegola, launched in 2017, is a lightweight vector tile server implemented in Go, designed to efficiently slice geospatial data into Mapbox Vector Tiles (MVT) for web delivery. It particularly optimizes performance when paired with PostGIS databases as backends, leveraging spatial queries to generate tiles on-the-fly without excessive computational overhead.[85] This makes Tegola suitable for scalable deployments serving dynamic, styleable vector data to clients like MapLibre or OpenLayers. GeoServer, originating in 2001, is a mature Java-based application server that implements Open Geospatial Consortium (OGC) standards, including the Web Map Tile Service (WMTS) for delivering pre-rendered or dynamic map tiles.[86] It supports a wide array of data formats and projections, facilitating the publication of geospatial services over the web, and offers extensibility through plugins for custom rendering, caching, and integration with databases like PostGIS. Recent trends in server-side tiled web mapping emphasize serverless architectures, such as deploying tile servers on AWS Lambda, which gained traction post-2020 for cost-effective, auto-scaling tile generation from sources like Cloud-Optimized GeoTIFFs or databases.[87] Open-source software dominates this ecosystem, with tools like Mapnik, Tegola, and GeoServer representing the majority of widely adopted solutions for tile production and management as of 2025.[88]References
- https://wiki.openstreetmap.org/wiki/Slippy_map_tilenames
- https://wiki.openstreetmap.org/wiki/Vector_tiles
- https://wiki.osgeo.org/wiki/Tile_Map_Service_Specification