
Community hub
Recent from talks
Contribute something
Nothing was collected or created yet.
Shadowgraph
View on Wikipedia
- prehistoric shadowgraphy
- sunlight shadowgram of a martini glass
- "focused" shadowgram of a common firecracker explosion
- "Edgerton" shadowgram of the firing of an AK-47 assault rifle
Shadowgraph is an optical method that reveals non-uniformities in transparent media like air, water, or glass. It is related to, but simpler than, the schlieren and schlieren photography methods that perform a similar function. Shadowgraph is a type of flow visualisation.
In principle, a difference in temperature, a different gas, or a shock wave in the transparent air cannot be seen by the human eye or cameras. However, all these disturbances refract light rays, so they can cast shadows. The plume of hot air rising from a fire, for example, can be seen by way of its shadow cast upon a nearby surface by the uniform sunlight.
Sunlight shadowgraph
[edit]Some aquatic predators detect their transparent prey by way of their shadows cast upon the ocean floor. It was Robert Hooke[1] who first scientifically demonstrated the sunlight shadowgraph and Jean-Paul Marat[2] who first used it to study fire. A modern account of shadowgraphy is given by Gary S. Settles.[3]
Applications
[edit]Applications of shadowgraphy in science and technology are very broad. It is used in aeronautical engineering to see the flow about high-speed aircraft and missiles, as well as in combustion research, ballistics, explosions, and in the testing of glass. Ideal for identification of flow patterns.
Shadowgram (Shadowgraph)
[edit]According to F. J. Weinberg,[4] the result of applying the shadowgraph technique should be known as a shadowgram. A shadowgram is not a focused image, rather it is a mere shadow. In the shadowgram, the differences in light intensity are proportional to the second spatial derivative (Laplacian) of the refractive index field in the transparent medium under study. Once the distance from the transparent disturbance to the cast shadow becomes too large, then the shadow no longer constitutes a useful representation of the disturbance that caused it.
Cartoons
[edit]The shadowgraph and shadowgram have been used in animation, where they reinforce the cartoon's realism. One first use was made by Disney Studios on the Three Blind Mouseketeers (1936) in the series of animated short films Silly Symphonies.[5]
Postcards
[edit]Additionally the term Shadowgraph was used by English postcard publishers E.T.W. Dennis & Sons Ltd. of London and Scarborough for a series of 'Hold up to the Light' postcards in the 1950s. In these a saucy image can be seen through what seems an innocent picture when a light is shone through the card.[6]
Gallery
[edit]-
 Shadowgram of the turbulent plume of hot air rising from a home-barbecue gas grill.
 -
 "Edgerton" shadowgraph of bullet in flight
 -
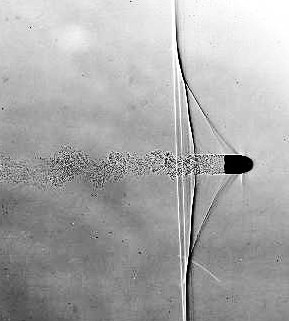
 Shadowgram of shock waves from a supersonic bullet fired from a rifle. The shadowgraph optical technique reveals that the bullet is moving at a Mach number of about 1.9. Left- and right-running bow waves and tail waves stream back from the bullet, and its turbulent wake is also visible. To the right of the frame are seen unburned powder particles from the cartridge, themselves traveling slightly subsonic so that each of them produces a curved bow shock wave.


See also
[edit]References
[edit]- ^ Hooke, R., "Of a New Property in the Air," Micrographia, Observation LVIII,217-219, London(1665).
- ^ Marat, J.-P., Recherches physiques sur le feu, Paris, France:Cl. Ant. Jombert, 1780.
- ^ Settles, G. S., Schlieren and shadowgraph techniques: Visualizing phenomena in transparent media, Berlin:Springer-Verlag, 2001.
- ^ Weinberg, F.J., Optics of flames: including methods for the study of refractive index fields in combustion and aerodynamics, London:Butterworths, 1963.
- ^ Russel Merritt & JB Kaufman, Walt Disney's Silly Symphonies : A Companion to the classic cartoons series, Italy:La Cinecita del Friuli, 2006, ISBN 88-86155-27-1 p 46
- ^ "MetroPostcard Publishers D". Metropolitan Postcard Club of New York City. Archived from the original on 2008-09-15. Retrieved 2008-10-02.