

Community hub
Recent from talks
Contribute something
Nothing was collected or created yet.
Sociogram
View on Wikipedia
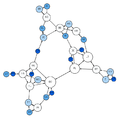
A sociogram is a graphic representation of social links that a person has. It is a graph drawing that plots the structure of interpersonal relations in a group situation.[1]
Overview
[edit]Sociograms were developed by Jacob L. Moreno to analyze choices or preferences within a group.[2][3] They can diagram the structure and patterns of group interactions. A sociogram can be drawn on the basis of many different criteria: Social relations, channels of influence, lines of communication etc.
Those points on a sociogram who have many choices are called stars. Those with few or no choices are called isolates. Individuals who choose each other are known to have made a mutual choice. One-way choice refers to individuals who choose someone but the choice is not reciprocated. Cliques are groups of three or more people within a larger group who all choose each other (mutual choice).
Sociograms are the charts or tools used to find the sociometry of a social space.
Under the social discipline model, sociograms are sometimes used to reduce misbehavior in a classroom environment.[4] A sociogram is constructed after students answer a series of questions probing for affiliations with other classmates. The diagram can then be used to identify pathways for social acceptance for misbehaving students. In this context, the resulting sociograms are known as a friendship chart. Often, the most important person/thing is in a bigger bubble in relation to everyone else. The size of the bubble represents the importance, with the biggest bubble meaning most important and the smallest representing the least important.
Gallery
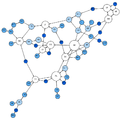
[edit]- Moreno's sociograms
-
 1st grade
 -
 2nd grade
 -
 3rd grade
 -
 4th grade
 -
 5th grade
 -
 6th grade
 -
 7th grade
 -
 8th grade


See also
[edit]References
[edit]- ^ Sociogram at merriam-webster.com.
- ^ Moreno, J. L. (1934), Who Shall Survive?, New York, N.Y.: Beacon House.
- ^ "An Experiential Approach to Organization Development 7th ed."Brown, Donald R.and Harvey, Don. Page 134
- ^ Wolfgang, Charles H., Solving Discipline And Classroom Management Problems: Methods and Models for Today’s Teachers; U.S.A, John Wiley and Sons, 2001.; p. 116