Hubbry Logo
Risk premiumRisk premiumMain
Open search
Risk premium
Community hub
Risk premium
logo
8 pages, 0 posts
0 subscribers
Be the first to start a discussion here.
Contribute something
Risk premium
Risk premium
from Wikipedia
Example of a linear Risk vs Return function and corresponding risk premium

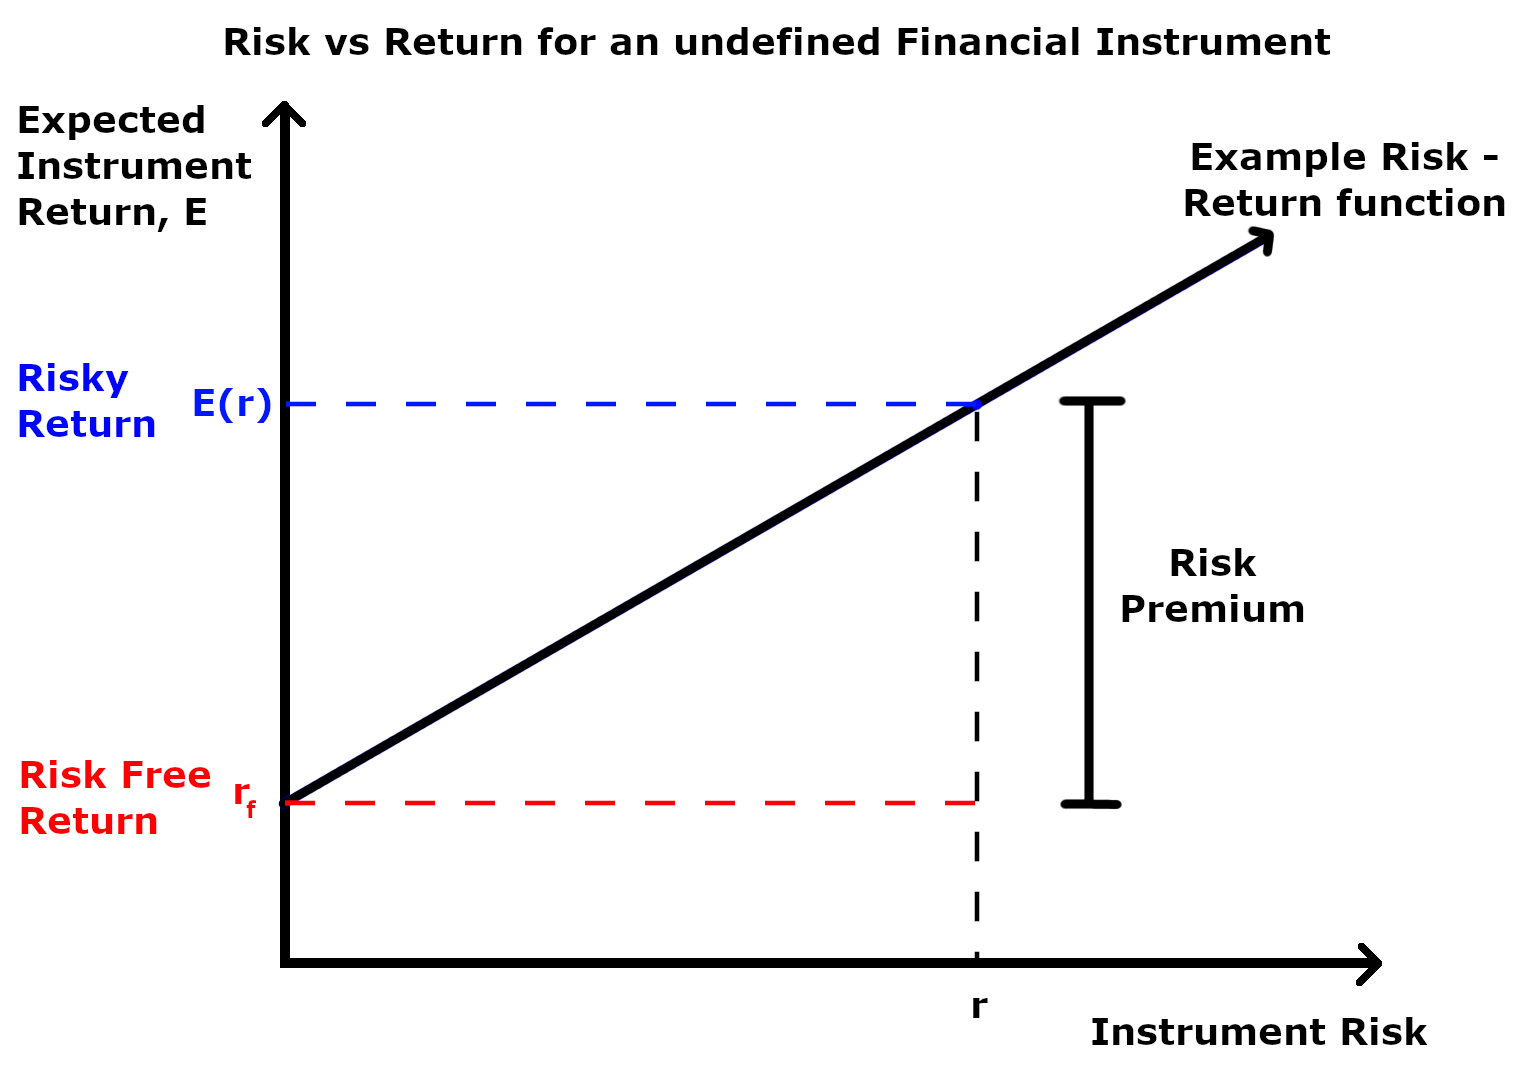
A risk premium is a measure of excess return that is required by an individual to compensate being subjected to an increased level of risk.[1] It is used widely in finance and economics, the general definition being the expected risky return less the risk-free return, as demonstrated by the formula below.[2]

Where is the risky expected rate of return and is the risk-free return.

The inputs for each of these variables and the ultimate interpretation of the risk premium value differs depending on the application as explained in the following sections. Regardless of the application, the market premium can be volatile as both comprising variables can be impacted independent of each other by both cyclical and abrupt changes.[2] This means that the market premium is dynamic in nature and ever-changing. Additionally, a general observation regardless of application is that the risk premium is larger during economic downturns and during periods of increased uncertainty.[3]

There are many forms of risk such as financial risk, physical risk, and reputation risk. The concept of risk premium can be applied to all these risks and the expected payoff from these risks can be determined if the risk premium can be quantified. In the equity market, the riskiness of a stock can be estimated by the magnitude of the standard deviation from the mean.[4] If for example the price of two different stocks were plotted over a year and an average trend line added for each, the stock whose price varies more dramatically about the mean is considered the riskier stock. Investors also analyse many other factors about a company that may influence its risk such as industry volatility, cash flows, debt, and other market threats.[4]

Formal definition in expected utility theory

[edit]

In expected utility theory, a rational agent has a utility function that maps sure-outcomes to numerical values, and the agent ranks gambles over sure-outcomes by their expected utilities.

Let the set of possible wealth-levels be . A gamble is a real-valued random variable. The actuarial value of the gamble is just its expectation: . This is independent of any agent.

Let the agent have a utility function , with a wealth-level . The risk-premium of for the agent at wealth-level is , defined as the solution to[5]

Note that the risk-premium depends both on the gamble itself, the agent's utility function, and the wealth-level of the agent. This can be understood intuitively by considering a real gamble. Some people may be quite willing to take the gamble and thus have a low risk-premium, while others are more averse. Further, as one's wealth increases, one is usually less perturbed by the gamble, whose stakes diminishes relative to one's wealth, consequently the risk-premium often decreases as increases, holding constant.

Risk premium application in finance

[edit]

The risk premium is used extensively in finance in areas such as asset pricing, portfolio allocation and risk management.[2] Two fundamental aspects of finance, being equity and debt instruments, require the use and interpretation of associated risk premiums with the inputs for each explained below:

Equity instruments

[edit]

In the stock market the risk premium is the expected return of a company stock, a group of company stocks, or a portfolio of all stock market company stocks, minus the risk-free rate.[6] The return from equity is the sum of the dividend yield and capital gains and the risk free rate can be a treasury bond yield.[7]

For example, if an investor has a choice between a risk-free treasury bond with a bond yield of 3% and a risky company equity asset, the investor may require a greater return of 8% from the risky company. This would result in a risk premium of 5%. Individual investors set their own risk premium depending on their level of risk aversion.[8] The formula can be rearranged to find the expected return on an investment given a stated risk premium and risk-free rate. For example, if the investor in the example above required a risk premium of 9% then the expected return on the equity asset would have to be 12%.

Debt instruments

[edit]

The risk premium associated with bonds, known as the credit spread, is the difference between a risky bond and the risk free treasury bond with greater risk demanding a greater risk premium as compensation.[9]

Risk premium application in banking

[edit]

Risk premiums are essential to the banking sector and can provide a large amount of information to investors and customers alike. For instance, the risk premium for a savings account is determined by the bank through the interest that they set on their savings accounts for customers.[10] This less the interest rate set by the central bank provides the risk premium. Stakeholders can interpret a large premium as an indication of increased default risk which has flow on effects such as negatively impacting the public's confidence in the financial system which can ultimately lead to bank runs which is dangerous for an economy.[10]

The risk premium is equally important for a bank's assets with the risk premium on loans, defined as the loan interest charged to customers less the risk free government bond, needing to be sufficiently large to compensate the institution for the increased default risk associated with providing a loan.[11]

Using the risk premium to produce valuations

[edit]

One of the most important applications of risk premiums is to estimate the value of financial assets. There are a number of models used in finance to determine this with the most widely used being the Capital Asset Pricing Model or CAPM.[12] CAPM uses investment risk and expected return to estimate a value for the investment. In Finance, CAPM is generally used to estimate the required rate of return for an equity. This required rate of return can then be used to estimate a price for the stock which can be done via a number of methods.[12] The formula for CAPM is:

CAPM = (The Risk Free Rate) +
(The Beta of the Security) * (The Market Risk Premium)[13]

In this model, we use the implied risk premium (market return less risk-free rate) and multiply this with the beta of the security. The beta of a security is the measure of a security's volatility relative to the broader market to understand its historical share price movement compared to the market.[12] If the beta of a stock is 1.0 then a 10% increase in the market will translate to a 10% increase in stock price. If the Beta of a stock is 1.5 then a 10% increase in the market will translate to a 15% increase in the stock price and if the beta of a stock is 0.5 a 10% market increase will translate to a 5% stock price increase and likewise with decreases in the market. This beta is generally found via statistical analysis of the share price history of a stock. Therefore CAPM aims to provide a simple model in order to estimate the required return of an investment which uses the theory of risk premiums. This helps to provide investors with a simple means of determining what return an investment should be relative to its risk.[13]

Risk premium application in managerial economics

[edit]

The risk premium concept is equally applicable in managerial economics. The risk premium is largely correlated with risk aversion with the larger the risk aversion of an individual or business the larger the risk premium the party will be willing to pay to avoid the risk.[14]

Regarding workers, the risk premium increases as the risk of injury increases and manifests in practice with average wages in dangerous jobs being higher for this reason.[15] Another way in which the risk premium can be interpreted from the workers perspective is that risk is valued by the market, in the form of wage discrepancies between risky and less risky jobs, with a worker able to determine what amount they are willing to forgo to engage in a less risky job.[16] In this instance the risk premium provides insight into the strength of correlation between risk and the average job type earnings with a larger premium potentially suggesting that there is a greater risk and/ or a lack of workers willing to take the risk.[17]

The level of risk associated with the risk premium concept does not need to be physical risk but it can also incorporate risk surrounding the job, such as job security.[18] Higher risk of unemployment  is compensated with a higher wage with this being a reason as to why fixed-term contracts generally include a higher wage.[18] CEO's in industries with high volatility are subject to increased risk of dismissal.[19] Dismissed CEO's often undergo a period of unemployment after dismissal and frequently settle for jobs in smaller firms with lower remuneration.[20] Due to this, and assuming there is demand competition within the labor market, they often require a higher remuneration than CEO's in non-volatile industries as a risk premium.[19]

In public goods

[edit]

In invasive species management

[edit]

The option value of whether to invest in invasive species quarantine and/or management is a risk premium in some models.[21]

In agriculture

[edit]

Of crop pathogens

[edit]

Farmers cope with crop pathogen risks and losses in various ways, mostly by trading off between management methods and pricing that includes risk premiums. For example in the northern United States, Fusarium head blight is a constant problem. Then in 2000 the release of a multiply-resistant cultivar of wheat dramatically reduced the necessary risk premium. The total planted area of MR wheats was dramatically expanded, due to this essentially costless tradeoff to the new cultivar.[22]

Of investment in genetic research

[edit]

Estimates of costs of research and development - including patent costs - of new crop genes and other agricultural biotechnologies must include the risk premium of those which do not ultimately obtain patent approval.[23]

Example of observed risk premium

[edit]

Suppose a game show participant may choose one of two doors, one that hides $1,000 and one that hides $0. Further, suppose that the host also allows the contestant to take $500 instead of choosing a door. The two options (choosing between door 1 and door 2, or taking $500) have the same expected value of $500, so no risk premium is being offered for choosing the doors rather than the guaranteed $500.

A contestant unconcerned about risk is indifferent between these choices. A risk-averse contestant will choose no door and accept the guaranteed $500, while a risk-loving contestant will derive utility from the uncertainty and will therefore choose a door.

If too many contestants are risk averse, the game show may encourage selection of the riskier choice (gambling on one of the doors) by offering a positive risk premium. If the game show offers $1,600 behind the good door, increasing to $800 the expected value of choosing between doors 1 and 2, the risk premium becomes $300 (i.e. $800 expected value minus $500 guaranteed amount). Contestants requiring a minimum risk compensation of less than $300 will choose a door instead of accepting the guaranteed $500.

Empirical estimates of risk premium from securities markets

[edit]

Schroeder estimated risk premiums ranging from 4.83 to 7.75 percent in securities markets in the United Kingdom and the European Union under multiple models, with most estimates ranging between 6.3 and 7.2 percent.[24]

See also

[edit]

References

[edit]
[edit]
Revisions and contributorsEdit on WikipediaRead on Wikipedia
from Grokipedia
The risk premium is the additional return that investors require to compensate for the uncertainty and potential loss associated with holding a risky asset rather than a risk-free one, such as securities. This concept is fundamental in economics and , reflecting the price of in markets where payoffs are not guaranteed. In and investment analysis, the most prominent application is the equity (ERP), defined as the excess return expected from investing in the over the . Historically, for the U.S. market, the geometric average ERP from 1928 to 2024 has been approximately 4.60%, based on realized returns of stocks over long-term bonds. As of November 2025, the implied ERP for the —derived from current market levels, expected dividends, earnings growth, and the 10-year U.S. bond rate adjusted for the May 2025 sovereign rating downgrade—is estimated at 4.60%. This forward-looking measure is preferred over historical averages because it incorporates current investor expectations and market conditions. Risk premiums extend beyond equities to other domains, including the credit risk premium, which is the spread between lending rates to private borrowers and the risk-free Treasury bill rate, capturing default risk. Similarly, country risk premiums add compensation for political, economic, and sovereign uncertainties in emerging markets, often estimated by scaling sovereign default spreads by relative equity market volatility—for instance, adding 1.5% to 10% or more to the mature market ERP depending on the country. These premiums vary with factors like investor risk aversion, macroeconomic uncertainty, and geopolitical events, and they can fluctuate significantly; the U.S. downgrade in May 2025 led to recalibrations in global equity risk premiums. The risk premium plays a central role in models, such as the (CAPM), where the on an asset is calculated as the plus beta times the , guiding investment decisions, corporate , and valuation practices. By quantifying the cost of bearing risk, it influences portfolio allocation, with higher premiums signaling greater caution and lower asset prices.

Theoretical Foundations

Definition in Expected Utility Theory

In expected utility theory, the risk premium represents the maximum amount an individual would pay to replace a risky prospect with a certain outcome equal to the of the risky prospect, thereby reflecting the degree of inherent in their preferences. This concept arises from the that individuals maximize expected utility rather than expected monetary value, leading risk-averse agents to prefer a sure gain over a gamble with the same expected payoff. The foundational distinction between and , which underpins the theoretical treatment of risk premiums, was introduced by in his 1921 work, where he differentiated insurable risks (measurable probabilities) from uninsurable uncertainties, arguing that profits in competitive markets stem from bearing the latter. This idea was formalized within expected utility theory by and in 1944, who axiomatized rational choice under using a von Neumann-Morgenstern (vNM) utility function UU, which is unique up to positive affine transformations and satisfies completeness, transitivity, continuity, and independence axioms. Under the vNM framework, consider a risk-averse individual with initial wealth ww facing a random outcome xx (a prospect or lottery) with probability distribution yielding expected value E\mathbb{E}. The expected utility of the prospect is E[U(w+x)]\mathbb{E}[U(w + x)], while the utility of the certain expected value is U(w+E)U(w + \mathbb{E}). Since UU is concave for risk aversion (by Jensen's inequality, E[U(w+x)]<U(w+E)\mathbb{E}[U(w + x)] < U(w + \mathbb{E})), the risk premium π(x)\pi(x) in utility terms is defined as the difference: π(x)=U(w+E)E[U(w+x)]\pi(x) = U(w + \mathbb{E}) - \mathbb{E}[U(w + x)] This π(x)>0\pi(x) > 0 quantifies the loss due to , and the monetary risk premium is the πm\pi_m solving U(w+Eπm)=E[U(w+x)]U(w + \mathbb{E} - \pi_m) = \mathbb{E}[U(w + x)], approximating πmπ(x)/U(w+E)\pi_m \approx \pi(x) / U'(w + \mathbb{E}) for small risks via Taylor expansion. The size of the risk premium is closely tied to the degree of , as captured by the Arrow-Pratt measure of absolute risk aversion, rA(w)=U(w)/U(w)r_A(w) = -U''(w)/U'(w), introduced by John W. Pratt in 1964 and Kenneth J. Arrow around the same period. This local measure, derived from the second-order Taylor expansion of UU around E\mathbb{E}, shows that higher rA(w)r_A(w) (greater concavity of UU) implies a larger πm\pi_m for a given , with πm12Var(x)rA(w+E)\pi_m \approx \frac{1}{2} \operatorname{Var}(x) r_A(w + \mathbb{E}) for small, zero-mean risks xx. Thus, the Arrow-Pratt coefficient provides a cardinal scale for comparing across individuals or wealth levels, directly influencing the magnitude of premiums demanded to bear . In financial contexts, this utility-based premium informs adjustments for market risks, such as requiring higher returns on volatile assets.

Measurement and Interpretation

The risk premium can be quantified using the certainty equivalent approach derived from expected theory. For a random payoff xx with function UU, the certainty equivalent (CE) is the sure amount that provides the same as the expected of the gamble: CE=U1(E[U(x)]),\text{CE} = U^{-1}\left( \mathbb{E}[U(x)] \right), where U1U^{-1} is the inverse function. The risk premium π\pi is then the difference between the and the certainty equivalent: π=ECE\pi = \mathbb{E} - \text{CE}. This measure captures the compensation required to forgo the risky prospect in favor of its expected value. For small risks, a second-order Taylor expansion around the expected value provides an approximation for the risk premium. Assuming a twice-differentiable utility function, the approximation is π12Var(x)rA(E),\pi \approx \frac{1}{2} \operatorname{Var}(x) \cdot r_A(\mathbb{E}), where rA(w)=U(w)U(w)r_A(w) = -\frac{U''(w)}{U'(w)} is the Arrow-Pratt measure of absolute risk aversion evaluated at wealth w=Ew = \mathbb{E}. This formula highlights the role of variance and local curvature of the utility function in determining the premium for minor gambles. The sign of the risk premium interprets the decision-maker's attitude toward . For risk-averse individuals (rA>0r_A > 0), π>0\pi > 0, indicating a positive compensation demanded to accept the . Risk-neutral agents (rA=0r_A = 0) exhibit π=0\pi = 0, equating the gamble to its . For risk-loving individuals (rA<0r_A < 0), π<0\pi < 0, reflecting a willingness to pay to engage in the gamble. The magnitude of the risk premium varies with several factors. Higher wealth levels typically reduce the premium under decreasing absolute (DARA), where rAr_A diminishes as wealth increases, as individuals become relatively more tolerant of absolute losses at higher wealth. The skewness of the payoff distribution also influences the premium; positive skewness (more favorable tail outcomes) lowers the premium for prudent agents with convex marginal utility (U>0U''' > 0), as it mitigates downside exposure beyond variance alone. Additionally, uninsurable background amplifies the premium for a foreground under , where adding fair background increases effective toward the primary gamble. In insurance contexts, the risk premium manifests as the loading atop the actuarially fair premium, which equals the expected loss. A risk-averse policyholder accepts a total premium of E[loss]+π\mathbb{E}[\text{loss}] + \pi to transfer the risk fully, with π\pi compensating for the utility loss from uncertainty. This loading ensures the insurer covers administrative costs and maintains solvency while aligning with the insured's willingness to pay.

Applications in Finance

Equity Risk Premium

The equity risk premium (ERP) represents the additional return that investors require over the risk-free rate to compensate for the uncertainty and volatility inherent in equity investments. It is formally defined as the difference between the expected return on equities, E[Re]E[R_e], and the risk-free rate, RfR_f, or E[Re]RfE[R_e] - R_f. This premium reflects the compensation demanded for bearing the non-diversifiable risks associated with stock ownership, such as market fluctuations that cannot be eliminated through diversification. In financial models, the plays a central role in determining s. The (CAPM), introduced by Sharpe in 1964, posits that the on an equity is Rf+β(E[Rm]Rf)R_f + \beta (E[R_m] - R_f), where β\beta measures the asset's sensitivity to market movements and E[Rm]RfE[R_m] - R_f is the market equity risk premium. Thus, the ERP for a specific equity is β\beta times the market premium, capturing exposure. The Fama-French three-factor model, developed in 1993, extends CAPM by incorporating (small minus big) and value (high minus low book-to-market) factors alongside the market premium, providing a more nuanced explanation of equity returns while retaining the core ERP as the component. A notable anomaly in ERP estimation is the , identified by and Prescott in 1985. Using U.S. data from 1889 to 1978, they calculated an average historical ERP of about 6.18%, far exceeding the 0.35% predicted by standard expected utility models under reasonable levels. This puzzle implies that conventional consumption-based frameworks, rooted in expected utility theory, struggle to reconcile observed equity returns with economic fundamentals, prompting debates on model assumptions. Several factors contribute to the magnitude of the observed . Systematic , as emphasized in CAPM, forms the foundational component, rewarding exposure to broad economic fluctuations. adds to the premium, as equities can be harder to trade quickly without price impact during market stress, with empirical studies estimating a liquidity risk compensation of around 1-2% in equity returns. Behavioral biases, such as investor overconfidence, further elevate the by leading to excessive trading and mispricing, increasing required returns to offset perceived risks.

Debt and Credit Risk Premium

The debt and credit risk premium represents the additional yield investors require to hold bonds or other debt instruments exposed to issuer default, quantified as the yield spread over a comparable risk-free benchmark, such as government Treasury securities of similar maturity. This spread primarily compensates for the possibility of default, where the issuer fails to meet principal or interest obligations, but it also incorporates a liquidity premium to account for the challenges in trading such securities without incurring significant price impacts during periods of market stress. Theoretical modeling of this premium draws on structural and reduced-form approaches. In the structural framework pioneered by Merton (1974), default is endogenous to the firm's balance sheet, occurring when the market value of assets falls below the face value of debt at maturity; the resulting credit spread emerges from option-pricing theory, treating equity as a call option on assets and debt as a risk-free bond minus a put option on default. A key approximation in this model links the credit spread to the issuer's default probability (PD) and loss given default (LGD), the portion of exposure not recovered upon default: Credit SpreadPD×LGD\text{Credit Spread} \approx PD \times LGD This formulation highlights how firm leverage, asset volatility, and risk-free rates influence the premium. In contrast, reduced-form models, such as the Jarrow-Turnbull framework (1995), model default as an exogenous arrival process akin to a Poisson jump, driven by stochastic intensity rates that evolve with observable market factors like interest rates; this allows for tractable pricing of credit-sensitive instruments without requiring detailed firm-level asset data, emphasizing intensity-based hazard rates over balance-sheet triggers. The credit spread decomposes into an expected loss component—capturing the anticipated direct cost of default as PD multiplied by LGD—and a risk premium for the systematic, non-diversifiable portion of default risk that correlates with broader economic shocks. The reflects idiosyncratic issuer-specific factors, while the risk premium arises from covariances with market-wide downturns, amplifying during recessions when defaults cluster. Empirical determinants include macroeconomic cycles, which heighten through reduced growth and heightened correlations among obligors, as well as collateral quality, which mitigates LGD by providing recovery assets in . A stark illustration of these dynamics occurred during the , where credit premiums on subprime mortgage-backed securities initially appeared compressed due to widespread mispricing of underlying default risks—driven by overly optimistic assumptions about prices and lax —leading to underestimation of PD and LGD. As markets collapsed, revealing the true extent of correlated defaults, spreads inflated dramatically, with AAA-rated subprime tranches' spreads widening to over 600 basis points (from pre-crisis levels of around 20 basis points) in late 2007, exacerbating liquidity evaporation and systemic contagion across debt markets.

Role in Banking and Risk Management

In banking, risk premiums play a central role in loan by compensating lenders for the probability of borrower default. Banks typically apply a model, starting with a that covers funding costs and overhead, then adding a risk premium calibrated to the borrower's , risk rating, and collateral quality. For instance, higher-risk borrowers with lower face elevated premiums to reflect increased default likelihood, enabling risk-based that aligns rates with individual profiles. At the portfolio level, models such as CreditRisk+ quantify aggregate by estimating the of losses, incorporating default frequencies, , and sector correlations to determine overall portfolio risk premiums and allocate for unexpected losses. Regulatory frameworks like integrate risk premiums into requirements to ensure banks maintain sufficient buffers against various risks. The accord mandates capital holdings based on risk-weighted assets, where premiums implicitly adjust through risk weights for credit, operational, and market exposures; for market risks, Value-at-Risk (VaR) models at a 99% confidence level over a 10-day horizon help calibrate these adjustments, while operational risks use a standardized approach tied to business indicators and historical losses. This structure promotes risk sensitivity, with banks required to hold at least 8% total capital (including a 4.5% common equity tier 1 component) to cover potential premium-driven losses, alongside for economic downturns. Risk management strategies in banking leverage risk premiums to mitigate exposures, particularly through hedging and scenario analysis. Banks often use interest rate derivatives, such as swaps, to hedge premiums embedded in floating-rate loans and deposits, locking in rates to offset volatility in benchmark yields like LIBOR or SOFR. Additionally, stress testing simulates spikes in risk premiums during recessions—where credit spreads can widen by 200-300 basis points or more—assessing impacts on capital adequacy and liquidity to inform contingency planning and limit setting. Post-2008 reforms, including the Dodd-Frank Act and enhancements, heightened emphasis on counterparty risk premiums in lending to address freezes observed during the turmoil, where spreads surged due to uncertainty over bank . These changes introduced standardized approaches for counterparty credit risk (SA-CCR) and mandatory central clearing for , compelling banks to price transactions with explicit premiums for default and collateral risks, thereby reducing systemic vulnerabilities.

Use in Asset Valuation

In asset valuation, the risk premium plays a central role in adjusting discount rates to account for uncertainty in future cash flows. One primary methodology is the (DCF) model, where the discount rate is constructed as the plus a risk premium scaled by the project's beta, reflecting its exposure. This approach ensures that the of expected cash flows incorporates compensation for non-diversifiable risks, as the beta measures the asset's sensitivity to market fluctuations. For instance, in valuing a publicly traded firm, the might be calculated as: r=Rf+β×(RmRf)r = R_f + \beta \times (R_m - R_f) where RfR_f is the risk-free rate, β\beta is the project's beta, and (RmRf)(R_m - R_f) is the market risk premium. For private assets, where beta estimation is challenging due to limited market data, the build-up method provides an alternative by layering premiums onto the risk-free rate. This involves starting with the risk-free rate, adding an equity risk premium for general market exposure, and then incorporating adjustments for size (higher risk in smaller firms) and illiquidity (lack of ready marketability). Size premiums typically range from 2% to 5% based on empirical studies of small-cap performance, while illiquidity adjustments can add 5% to 25% depending on the asset's trading constraints. This method is particularly suited to valuing closely held businesses or real estate, yielding a total discount rate that cumulatively addresses multiple risk layers without relying on comparable public betas. Real options valuation extends traditional DCF by incorporating managerial flexibility under uncertainty, using binomial models to embed risk premiums in decision trees. In these models, the risk premium influences the drift term and probabilities across up/down state branches, capturing the value of options to expand, abandon, or delay projects amid volatility. For example, in a project, increasing uncertainty (e.g., price variance) amplifies the option value through path-dependent , where risk-adjusted rates vary by scenario, often adding significant premiums over static NPV estimates—such as a 66% uplift in a pharmaceutical valuation from delay flexibility. This binomial framework avoids assuming constant risk premiums, instead deriving them from the underlying asset's volatility to better quantify strategic value. In international contexts, asset valuation incorporates premiums to adjust for geopolitical and economic exposures, often derived from sovereign yield spreads over benchmark risk-free rates. These spreads, calculated as the difference between a country's yield and a mature market rate (e.g., U.S. ), serve as a base for the country premium, which is then scaled by the asset's equity volatility relative to bonds. For instance, Brazil's default spread of approximately 2.48% (from its Ba1 rating) as of January 2025 might yield a country risk premium of 3.34% when adjusted for equity market sensitivity, added to the global equity premium for a of capital. This method ensures valuations reflect location-specific risks, such as in cross-border mergers or investments, without overgeneralizing domestic assumptions.

Applications in Economics

Managerial Decision-Making

In managerial decision-making, the risk premium serves as a critical adjustment factor for evaluating investments and operational strategies under uncertainty, often derived from expected utility theory where it represents the additional compensation required for bearing non-diversifiable risk. In , managers incorporate firm-specific risk premiums into hurdle rates to assess (NPV) calculations for proposed projects. The hurdle rate typically comprises the plus a market risk premium scaled by the project's beta, with additional adjustments for idiosyncratic risks such as operational volatility or industry-specific factors that exceed market averages. For instance, empirical studies show that average hurdle rates across firms range from 12% to 15%, implying an equity risk premium of about 3.8% after accounting for leverage and project characteristics, which helps ensure projects align with creation. This approach prevents overinvestment in high-risk ventures by raising the discount rate for cash flows, thereby reflecting the of capital in uncertain environments. Real options analysis extends this framework by adjusting risk premiums in decision trees to value managerial flexibility in irreversible investments, such as (R&D). Unlike traditional NPV, which may undervalue options to expand, abandon, or delay projects, real options incorporate a risk-adjusted discount rate that accounts for the volatility of underlying assets, treating the investment as a on future cash flows. For R&D projects, where failure rates can exceed 50%, the risk premium is embedded in the option pricing model to capture the premium for upside potential while discounting for downside risks, often using binomial trees to simulate scenarios and derive an expanded NPV. Seminal work demonstrates that this adjustment can enhance project valuations for high-uncertainty initiatives. Behavioral factors influence these applications, as managers' risk aversion often results in internal risk premiums that exceed market rates, leading to conservative choices. Risk-averse executives, facing undiversified personal wealth tied to firm performance, demand higher NPVs for volatile —for example, requiring an additional 9% incremental for a with 55.83% volatility compared to lower-risk alternatives—effectively raising internal hurdle rates beyond CAPM estimates. This aversion amplifies distortions in capital allocation, with studies showing that firms led by such managers reduce risky investments, potentially forgoing value-creating opportunities. A practical application occurs in within multinational corporations, where risk premiums adjust prices between divisions to reflect differing exposures. Divisions assuming higher , such as market entry in volatile regions, receive arm's-length that includes a premium compensating for those , ensuring profits align with economic contributions and functions performed. For example, guidelines specify that entities bearing credit or inventory in intercompany transactions earn higher expected returns based on comparable uncontrolled transactions, while low-risk routine divisions earn minimal premiums. analysis reinforces this by attributing risk premiums to the division executing risky activities, such as product development abroad, to prevent shifting and promote fair internal .

Public Goods and Policy Analysis

In the valuation of public goods, such as environmental amenities that lack market prices, contingent valuation methods are employed to estimate individuals' willingness-to-pay (WTP) for non-market benefits, with risk premiums adjusting these estimates to account for uncertainty in outcomes. The risk premium represents the downward adjustment to WTP due to risk aversion, reflecting the compensation required to bear the uncertainty of benefits realization, as derived from expected utility theory where individuals prefer certain outcomes over risky ones with equivalent expected value. For instance, in surveys assessing WTP for pollution reduction or biodiversity preservation, ignoring this premium leads to overestimation of support for policy implementation, as respondents factor in doubts about efficacy. This adjustment ensures more accurate policy design by incorporating the societal cost of ambiguity in non-excludable goods. In , risk premiums arise from uncertainties in eradication costs versus potential damages, influencing decisions on and control investments. The U.S. Animal and Plant Health Inspection Service (APHIS) employs models that integrate probabilistic spread and impact forecasts to evaluate management options, where the premium captures the value of delaying irreversible actions until more reduces , akin to an option value in endogenous risk frameworks. For the (Agrilus planipennis), an invasive pest threatening North American ash trees, economic analyses highlight how spread uncertainty elevates the risk premium on control investments, with studies estimating elevated costs due to variable infestation rates and treatment efficacy. These models prioritize interventions by balancing expected damages—such as urban tree loss exceeding $10 billion across U.S. communities—with the premium for incomplete eradication success. Risk premiums play a critical role in cost-benefit analyses for climate policy, particularly by addressing tail risks from extreme events like hurricanes or tipping points that amplify damages beyond mean projections. In social cost of carbon (SCC) calculations, the premium adds to expected damages to reflect risk aversion, increasing the SCC by $40–$80 per ton of carbon under uncertainty scenarios with parameters like relative risk aversion of 1.5. Seminal work shows that fat-tailed distributions of climate impacts justify higher mitigation investments, as the premium supports greater willingness to pay for robustness against low-probability, high-impact events. This approach guides regulatory decisions, such as emissions caps, by quantifying the societal willingness to pay extra for robustness against low-probability, high-impact events.

Agriculture and Resource Allocation

In agricultural settings, the risk premium plays a crucial role in managing uncertainties from crop pathogens, where it influences the pricing of insurance policies or preventive investments to address yield losses. For diseases like Fusarium Head Blight (FHB) in wheat and barley, the risk premium is incorporated into decision-making by accounting for expected yield reductions due to infection severity, adjusted by farmers' risk aversion. This premium represents the additional compensation required to offset the variability in outcomes, often modeled conceptually as the expected yield loss multiplied by a risk aversion factor, encouraging adoption of resistant varieties or fungicide applications. Empirical analysis shows that risk premiums for FHB depend on regional disease pressure and management efficacy, thereby guiding resource commitments to pathogen control. Investments in genetic research for agriculture similarly embed risk premiums to compensate for high failure rates in developing crop resistance traits through biotechnology. In biotech R&D, the premium reflects the uncertainty in trait efficacy and commercialization timelines, with private firms demanding higher returns to undertake such volatile projects. For genetically modified (GM) corn traits aimed at enhancing resistance to stresses like drought—which parallels pathogen resilience—the risk premium is quantified as the certainty equivalent difference in net returns, varying by farm region and trait performance. Studies estimate these premiums at up to $11.56 per acre in high-risk areas like the Prairie Gateway, underscoring the financial hurdle for adopting new genetic technologies. Farmers' resource allocation decisions, such as the use of inputs like fertilizers under price and weather risks, are shaped by risk premiums that adjust expected utility from variable outcomes. Risk-averse producers reduce input applications to mitigate downside losses from fluctuating input costs or adverse weather, effectively paying a production premium to stabilize yields over time. This behavior leads to suboptimal input levels from a mean-variance perspective, with premiums increasing as weather volatility rises, as seen in models incorporating soil and climate risks. For example, in nitrate management scenarios, farmers incur a risk premium of approximately 10-15% of expected output value to avoid yield variability from uncertain precipitation. A notable example from the 2020s involves gene-editing investments using technology for crop improvement, where risk premiums account for regulatory hurdles and efficacy uncertainties in developing resistant varieties. In , the adoption of -edited rice for insect resistance demonstrates this, with the aggregate risk premium estimated at 1.17 billion USD annually for risk-averse farmers, derived from the difference between expected profits and certainty equivalents under pest variability. This premium highlights the economic incentive for investing in such technologies, as co-planting edited and conventional reduces overall , yielding a mean benefit of 2.32 billion USD per year across simulations. As of 2025, regulatory approvals in have facilitated broader adoption of -edited crops, enhancing resilience to pests and reducing these risk premiums through proven field performance.

Empirical Evidence

Historical Examples

In the U.S. equity market, historical data from 1928 to 2024 illustrates the variability of the equity risk premium, calculated as the excess return of stocks over Treasury bills, with an arithmetic average of approximately 8.4% over this period. During the from 1929 to 1932, the realized premium turned negative, averaging around -24% annually due to severe declines exceeding safe asset returns, reflecting heightened investor aversion to amid . In contrast, the saw a spike in 1999 with a realized premium of 16.25%, driven by exuberant valuations in technology stocks, before reverting to negative territory in 2000 and 2001 at -14.85% and -15.25%, respectively, as the bubble burst and correlated market risks materialized. These episodes underscore how the risk premium can fluctuate dramatically, sometimes inverting to penalize equity holders during periods of correlated downturns. The 2005 provides a stark example, where premiums incorporated substantial loadings for correlated catastrophe risks, with post-event rate increases exceeding 50% in affected Gulf Coast regions to cover underestimated flood and wind damage exposures. Insured losses totaled approximately $65 billion (in 2005 USD) across six states, far surpassing initial actuarial expectations based on historical hurricane models, as the storm's widespread flooding revealed limitations in risk diversification and led to higher premiums reflecting the of damages. This event highlighted the risk premium's role in pricing tail risks, where insurers demanded compensation well beyond expected losses—estimated at 50-65% of total claims for and interruption—to account for the non-diversifiable nature of regional catastrophes. In , the 2012 U.S. exemplified risk premiums in futures, particularly for corn, where prices embedded 10-15% elevations over spot levels to compensate for yield uncertainties and supply shortages. Corn futures peaked at $8.24 per in August 2012, with basis premiums—differentials over futures—reaching up to $1.75 per in key regions like , equivalent to about 20-25% but stabilizing around 10-15% as markets priced in the 's 40% yield reduction nationwide. This premium arose from the correlated weather risks affecting Midwest production, prompting hedgers and speculators to demand higher returns for bearing the volatility in harvest outcomes. For public goods, the 2020 COVID-19 vaccine development under demonstrated risk premiums in public funding, where the U.S. government allocated over $18 billion to de-risk R&D for candidates with uncertain efficacy, including advance purchases to cover potential failures. This initiative supported multiple platforms like mRNA vaccines, absorbing clinical and manufacturing risks that private investors avoided due to high failure probabilities—estimated at 90% for traditional timelines—by committing funds equivalent to a premium over expected costs to accelerate deployment amid global uncertainty. The approach effectively transferred correlated pandemic risks from developers to taxpayers, enabling vaccines like those from and to reach efficacy rates of 94-95% faster than conventional paths.

Market-Based Estimates

Market-based estimates of the risk premium primarily draw from securities pricing data to derive forward-looking or historical excess returns over risk-free rates. One common approach involves historical averaging of past excess returns on equities or other assets relative to government bonds or bills. The calculates the simple average of annual excess returns, providing an unbiased estimate for single-period expectations, whereas the compounds returns over time, yielding a lower figure that accounts for volatility drag. For the U.S. equity risk premium, historical averaging as of 2025 typically yields estimates ranging from 4.5% ( over long periods like 1926–2024) to 6.5% (), depending on the data span and benchmark used, such as returns minus 10-year Treasury yields. Implied premium methods extract the risk premium directly from current market valuations, avoiding reliance on historical data. In dividend discount models, the implied premium is the excess return that equates the of expected dividends to the current price; options models similarly infer premiums from implied volatilities and forward prices. As of 2025, these methods indicate a U.S. equity implied premium of approximately 4.3%, based on surveys and models like the implied . Surveys of practitioners and academics compile consensus forecasts, often incorporating both historical and implied approaches. Aswath Damodaran's annual global estimates, updated in 2025, illustrate this by deriving country-specific premiums from a mature market base plus default spreads adjusted for equity risk; developed markets average around 5%, while emerging markets range from 7% to 9% to compensate for higher volatility and geopolitical risks. Post-2020 economic shifts, including sustained low interest rates until mid-decade and resurgent , have prompted adjustments to these estimates, generally lowering observed premiums as high asset valuations compress excess returns. These updates address limitations in pre-2020 data by integrating current macroeconomic conditions, such as elevated yields and reduced real rates, to better reflect forward-looking .

References

Add your contribution
Related Hubs
Contribute something
User Avatar
No comments yet.