Hubbry Logo
Bullwhip effectBullwhip effectMain
Open search
Bullwhip effect
Community hub
Bullwhip effect
logo
8 pages, 0 posts
0 subscribers
Be the first to start a discussion here.
Bullwhip effect
Bullwhip effect
from Wikipedia
Illustration of the bullwhip effect: the final customer places an order (whip), which increasingly distorts interpretations of demand as one proceeds upstream along the supply chain.

The bullwhip effect is a supply chain phenomenon where orders to suppliers tend to have a larger variability than sales to buyers, which results in an amplified demand variability upstream. In part, this results in increasing swings in inventory in response to shifts in consumer demand as one moves further up the supply chain. The concept first appeared in Jay Forrester's Industrial Dynamics (1961)[1] and thus it is also known as the Forrester effect. It has been described as "the observed propensity for material orders to be more variable than demand signals and for this variability to increase the further upstream a company is in a supply chain".[2]

Research at Stanford University helped incorporate the concept into supply chain vernacular using a story about Volvo. Suffering a glut in green cars, sales and marketing developed a program to sell the excess inventory. While successful in generating the desired market pull, manufacturing did not know about the promotional plans. Instead, they read the increase in sales as an indication of growing demand for green cars and ramped up production.[3]

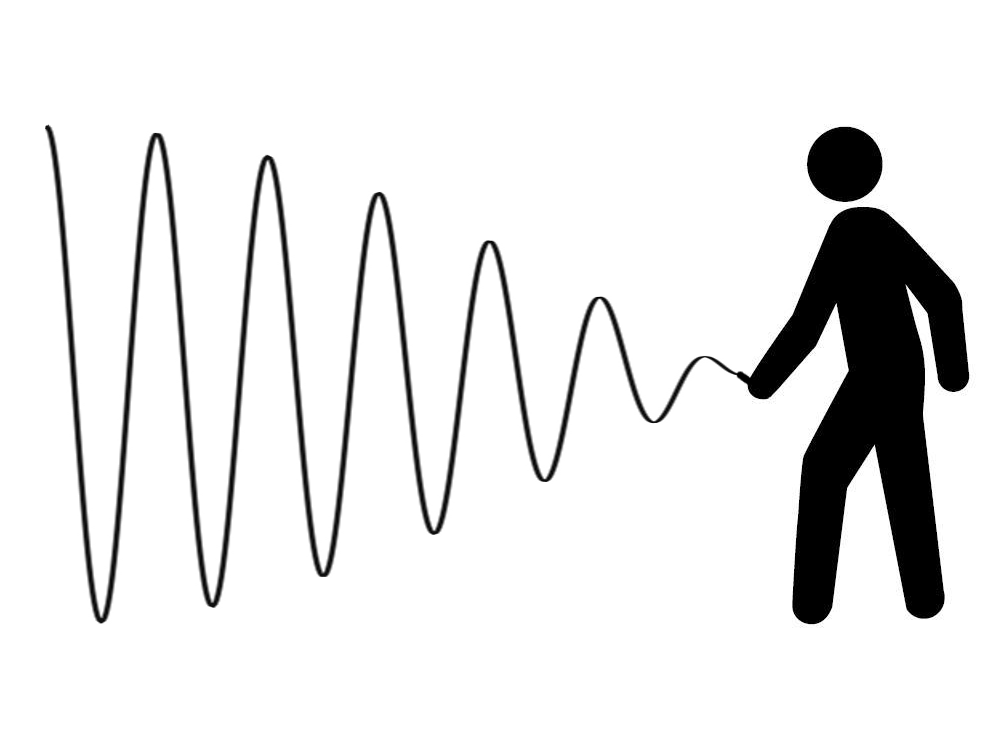
Research indicates a fluctuation in point-of-sale demand of five percent will be interpreted by supply chain participants as a change in demand of up to forty percent. Much like cracking a whip, a small flick of the wrist - a shift in point of sale demand - can cause a large motion at the end of the whip - manufacturers' responses.[4]

Causes

[edit]
Bullwhip effect

Because customer demand is rarely perfectly stable, businesses must forecast demand to properly position inventory and other resources. Forecasts are based on statistics, and they are rarely perfectly accurate. Because forecast errors are expected, companies often carry an inventory buffer called "safety stock".

Moving up the supply chain from end-consumer to raw materials supplier, each supply chain participant has greater observed variation in demand and thus greater need for safety stock. In periods of rising demand, down-stream participants increase orders. In periods of falling demand, orders fall or stop, thereby not reducing inventory. The effect is that variations are amplified as one moves upstream in the supply chain (further from the customer). This sequence of events is well simulated by the beer distribution game that was developed by MIT Sloan School of Management in the 1960s.

  • Disorganisation
  • Lack of communication
  • Free return policies
  • Order batching
  • Price variations
  • Demand information
  • Simply human greed and exaggeration

The causes can further be divided into behavioral and operational causes.

Behavioral causes

[edit]

The first theories focusing onto the bullwhip effect were mainly focusing on the irrational behavior of the human in the supply chain, highlighting them as the main cause of the bullwhip effect. Since the 90's, the studies evolved, placing the supply chain's misfunctioning at the heart of their studies abandoning the human factors.[5]

Previous control-theoretic models have identified as causes the tradeoff between stationary and dynamic performance[6] as well as the use of independent controllers.[7] In accordance with Dellaert et al. (2017),[8] one of the main behavioral causes that contribute to the bullwhip effect is the under-estimation of the pipeline.[9] In addition, the complementary bias, over-estimation of the pipeline, also has a negative effect under such conditions. Nevertheless, it has been shown that when the demand stream is stationary, the system is relatively robust to this bias. In such situations, it has been found that biased policies (both under-estimating and over-estimating the pipeline) perform just as well as unbiased policies.

Some others behavioral causes can be highlighted:

  • Misuse of base-stock policies
  • Mis-perceptions of feedback and time delays. In 1979, Buffa and Miller highlighted that in their example. If a retailer sees a permanent drop of 10% of the demand on day 1, he will not place a new order until day 10. That way, the wholesaler is going to notice the 10% drop at day 10 and will place his order on day 20. The longer the supply chain is, the bigger this delay will be and the player at the end of the supply chain will discover the decline of the demand after several weeks.
  • Panic ordering reactions after unmet demand
  • Perceived risk of other players' bounded rationality. Following the logic of the example of Buffa and Miller, after several weeks of producing at the classical rate, the producer will receive the information of the demand drop. As the drop was 10%, during the delay of the information's circulation the producer had a surplus of 11% per day, accumulated since day 1. He is thus more inclined to cut more than the necessary production.[2]

Human factors influencing the behavior in supply chains are largely unexplored. However, studies suggest that people with increased need for safety and security seem to perform worse than risk-takers in a simulated supply chain environment. People with high self-efficacy experience less trouble handling the bullwhip-effect in the supply chain.[10]

Operational causes

[edit]

A seminal Lee et al. (1997) study found that the bullwhip effect did not solely result from irrational decision making: it found that under some circumstances it is rational for a firm to order with greater variability than variability of demand, i.e., distort demand and cause the bullwhip effect. They established a list of four major factors which cause the bullwhip effect: demand signal processing, rationing game, order batching, and price variations.[2] This list has become a standard and is used as a framework to identify bullwhip effect.[citation needed]

  • Demand forecast updating is applied individually by all members of a supply chain. In order to guard against unexpected events, a member of the chain who is ordering will add safety stock to the amount actually needed. When the supplier of that member places an order to its own supplier, it will also add safety stock. The more members of the chain, the more safety stock will be made, resulting in an artificial increase in demand.[11]
  • Order batching is the preference of most companies to accumulate demand before ordering, with the intent of reducing cost and simplifying logistics. This approach allows them to benefit from more revenue per order without a comparable increase in transportation cost via economy of scale. That can manifest by allowing them to order a full truck or container load, where partial loads are less efficient in terms of transportation cost per unit. Consolidation of orders in this way creates an artificial variability in demand, which potentially increases the bullwhip effect.
  • Price fluctuations can be a result of inflationary factors, quantity discounts, or sales. This instability tends to stimulate customers to buy larger quantities than they require. In cases where sales economy is higher than stocking expense, they may buy more than is immediately needed in order to gain bulk discounts. This increases the variability by having large spikes of demand followed by longer periods without orders while the excess stock is sold off, which makes it more difficult for suppliers to predict demand. The resulting uncertainty can contribute to the bullwhip effect. While suppliers can counter this by removing or reducing discounts, this risks loss of business to competitors who continue to offer more or larger incentives.
  • Rationing and gaming is when a retailer limits order quantities by providing only a percentage of the order, but the buyer acts on this knowledge by placing larger orders in hopes of getting closer to the actual desired quantity. Rationing and gaming generate inconsistencies in the ordering information that is being received, and may feed into the bullwhip effect.[12]

Other operational causes include:

  • Dependent demand processing
    • Forecast errors
    • Adjustment of inventory control parameters with each demand observation
  • Lead time variability (forecast error during replenishment lead time)
  • Lot-sizing/order synchronization
    • Consolidation of demands
    • Transaction motive
    • Quantity discounts
  • Trade promotion and forward buying
  • Anticipation of shortages
    • Allocation rule of suppliers
    • Shortage gaming
    • Lean and JIT style management of inventories and a chase production strategy

Consequences

[edit]

In addition to greater safety stocks, the described effect can lead to either inefficient production or excessive inventory, as each producer needs to fulfill the demand of its customers in the supply chain. This also leads to a low utilization of the distribution channel.

In spite of having safety stocks there is still the hazard of stock-outs which result in poor customer service and lost sales. In addition to the (financially) hard measurable consequences of poor customer services and the damage to public image and loyalty, an organization has to cope with the ramifications of failed fulfillment which may include contractual penalties. Moreover, repeated hiring and dismissal of employees to manage the demand variability induces further costs due to training and possible lay-offs.

The impact of the bullwhip effect has been especially acute at the beginning stages of the COVID-19 pandemic, when sudden spikes in demand for everything from medical supplies such as masks or ventilators[13] to consumer items such as toilet paper or eggs created feedback loops of panic buying, hoarding, and rationing.[14]

Countermeasures

[edit]

Information sharing across the supply chain is an effective strategy to mitigate the bullwhip effect. For example, it has been successfully implemented in Wal-Mart's distribution system. Individual Wal-Mart stores transmit point-of-sale (POS) data from the cash register back to corporate headquarters several times a day. This demand information is used to queue shipments from the Wal-Mart distribution center to the store and from the supplier to the Wal-Mart distribution center. The result is near-perfect visibility of customer demand and inventory movement throughout the supply chain. Better information leads to better inventory positioning and lower costs throughout the supply chain.

Another recommended strategy to limit the bullwhip effect is order smoothing.[7] Previous research has demonstrated that order smoothing and the bullwhip effect are concurrent in industry.[15] It has been proved that order smoothing is beneficial for the system's performance when the demand is stationary. However, its impact is limited to the worst-case order amplification when the demand is unpredictable. Having said that, dynamic analysis reveals that order smoothing can degrade performance in the presence of demand shocks. The opposite bias (i.e., over-reaction to mismatches), on the other hand, degrades the stationary performance but can increase dynamic performance; controlled over-reaction can aid the system reach its new goals quickly. The system, nevertheless, is considerably sensitive to that behaviour; extreme over-reaction significantly reduces performance. Overall, unbiased policies offer in general good results under a large range of demand types. Although these policies do not result in the best performance under certain criteria. It is always possible to find a biased policy that outperforms an unbiased policy for any one performance metric.

Methods intended to reduce uncertainty, variability, and lead time:

Financial bullwhip

[edit]

Many studies demonstrate the bullwhip effect in a supply chain from different perspectives, including information sharing (Lee et al., 2000),[16] information distortion (Lee et al., 2004),[17] bankruptcy events (Lee et al., 2004, Mizgier et al., 2012[18]) and systematic risk (Osadchiy et al., 2015).[19] Most of them devote themselves to exploring the bullwhip effect from the perspectives of inventory flow risk and information flow risk rather than that of cash flow risk. For a firm's internal liquidity risk (Chen et al., 2011),[20] it is an appropriate proxy for a firm's financial risk.

Evolving from the notion of a stock derived bullwhip effect, there exists a similar, "financial bullwhip effect", explored in (Chen et al., 2013),[21] on bondholders' wealth along a supply chain by examining whether the internal liquidity risk effect on bond yield spreads becomes greater upwardly along the supply chain counterparties.

Financial ripple effect

[edit]

This is more generally modelled in (Proselkov et al., 2023),[22] which uses complex adaptive systems modelling to study cascade failures as a consequence of financial bullwhips. Specifically, they create an agent-based supply network simulation model capturing the behaviours of companies with asymmetric power dynamics with their partners. To remain operational, they maximise their liquidity by negotiating longer repayment terms and cheaper financing, thus distributing risk onto weaker companies and propagating financial stress. This results in network-wide breakdown.

See also

[edit]

References

[edit]

Literature

[edit]
  • Bray, Robert L., and Haim Mendelson. "Information transmission and the bullwhip effect: An empirical investigation." Management Science 58.5 (2012): 860–875.
  • Buffa Elwood S and Jeffrey G Miller. 1979. Production-Inventory Systems : Planning and Control. 3d ed. Homewood Ill: Richard D. Irwin.
  • Cannella S., and Ciancimino E. (2010). On the bullwhip avoidance phase: supply chain collaboration and order smoothing. International Journal of Production Research, 48 (22), 6739-6776
  • Chen, Y. F., Z. Drezner, J. K. Ryan and D. Simchi-Levi (2000), Quantifying the Bullwhip Effect in a Simple Supply Chain: The Impact of Forecasting, Lead Times and Information. Management Science, 46, 436–443.
  • Chen, Y. F., J. K. Ryan and D. Simchi-Levi (2000), The Impact of Exponential Smoothing Forecasts on the Bullwhip Effect. Naval Research Logistics, 47, 269–286.
  • Chen, Y. F., Z. Drezner, J. K. Ryan and D. Simchi-Levi (1998), The Bullwhip Effect: Managerial Insights on the Impact of Forecasting and Information on Variability in a Supply Chain. Quantitative Models for
  • Disney, S.M., and Towill, D.R. (2003). On the bullwhip and inventory variance produced by an ordering policy. Omega, the International Journal of Management Science, 31 (3), 157–167.
  • Lee, H.L., Padmanabhan, V., and Whang, S. (1997). Information distortion in a supply chain: the bullwhip effect. Management Science, 43 (4), 546–558.
  • Lee, H.L. (2010). Taming the bullwhip. Journal of Supply Chain Management 46 (1), pp. 7–7.
  • Supply Chain Management, S. Tayur, R. Ganeshan and M. Magazine, eds., Kluwer, pp. 417–439.
  • Selwyn, B. (2008) Bringing Social Relations Back In: (re)Conceptualising the 'Bullwhip Effect' in global commodity chains. International Journal of Management Concepts and Philosophy, 3 (2)156-175.
  • Tempelmeier, H. (2006). Inventory Management in Supply Networks—Problems, Models, Solutions, Norderstedt:Books on Demand. ISBN 3-8334-5373-7.
[edit]
Revisions and contributorsEdit on WikipediaRead on Wikipedia
from Grokipedia
The bullwhip effect, first described in the as part of industrial dynamics and with the term coined in the late , is a phenomenon in which small fluctuations in consumer at the retail level lead to progressively larger variations in orders as they propagate upstream to distributors, manufacturers, and suppliers, resulting in amplified distortion throughout the chain. This effect arises from rational but decentralized by participants and can significantly undermine . Key causes of the bullwhip effect include demand signal processing, where each stage forecasts future demand based on orders from the downstream partner, often incorporating trends or that magnifies variability; rationing and gaming, in which downstream firms inflate orders during supply constraints to secure allocations; order batching, whereby periodic ordering to minimize transaction costs leads to lumpy demand patterns; and price fluctuations, which prompt forward buying and subsequent order surges. These factors interact within classical models, such as the newsvendor problem or base-stock policies, to exacerbate variance amplification, with mathematical proofs demonstrating that order variance exceeds variance under typical conditions (e.g., Theorem 1: if forecast horizon v>0v > 0 and parameter 0<p<10 < p < 1, then Var(z1)>Var(D0)\text{Var}(z_1) > \text{Var}(D_0)). The impacts are profound, including excess inventory buildup, increased stockouts, misguided production and capacity planning, higher transportation and labor costs from expedited corrections, and overall supply chain inefficiencies estimated to waste 12.5% to 25% of operating costs in affected industries. Notable real-world examples include Procter & Gamble's supply chain, where retailer orders to distributors showed five times the variability of store sales, and Hewlett-Packard's printer division, which experienced order swings 20 times larger than actual sales due to distorted information flows. In the U.S. grocery sector alone, such distortions contribute to $75 billion to $100 billion in annual carrying costs. Mitigation strategies focus on improving information sharing, such as through or point-of-sale , stabilizing pricing, and reducing lead times, which empirical studies show can significantly reduce amplification in collaborative systems. Despite advances in technology like systems, the bullwhip effect remains a persistent challenge in global supply chains, particularly amid disruptions like those seen in the .

Fundamentals

Definition

The bullwhip effect is a phenomenon in which the variability in orders increases disproportionately as one moves upstream from the retailer to the manufacturer, resulting in greater fluctuations in demand signals at higher tiers compared to actual consumer demand. This amplification occurs because each stage in the supply chain bases its orders on perceived demand from the downstream partner, leading to distorted information that exaggerates small variations. The term was coined in a seminal 1997 paper by Hau L. Lee, V. Padmanabhan, and Seungjin Whang to describe this observed distortion in multi-echelon supply chains. At its core, the mechanism involves progressive escalation across tiers: a minor shift in consumer purchases at the retail level prompts the retailer to adjust orders to the wholesaler, which in turn amplifies the signal further when ordering from the , and this pattern continues to the manufacturer. For illustration, a small increase in retail can lead to progressively larger order increases upstream, demonstrating how initial stability gives way to volatility. Key associated terminology includes demand signal processing, which refers to the and updating of estimates; order batching, the practice of aggregating orders over time; and the amplification ratio, a measure quantifying the extent of variance increase between stages. These concepts highlight the effect's reliance on without implying specific drivers.

History

The concept of the bullwhip effect traces its origins to the foundational work in system dynamics pioneered by Jay Forrester at the Massachusetts Institute of Technology (MIT) during the late 1950s and early 1960s. Forrester's research on industrial dynamics, detailed in his 1961 book Industrial Dynamics, introduced the idea of demand amplification—later termed the bullwhip effect—through simulations using the DYNAMO programming language to model production and inventory fluctuations in multi-stage supply systems. This work highlighted how small variations in end-consumer demand could escalate upstream, laying the groundwork for understanding supply chain instabilities. Early simulations further illustrated these dynamics, notably through the developed at MIT's Sloan School of Management in the early under Forrester's influence. The game, a exercise involving retailers, wholesalers, distributors, and manufacturers, demonstrated empirically how information delays and independent decision-making amplify demand variability across tiers. This simulation became a staple in education, providing tangible evidence of the phenomenon Forrester described. Research on the bullwhip effect evolved significantly during the 1980s and 1990s, with studies focusing on inventory management and errors as key amplifiers. Scholars examined how forecasting techniques, such as , contributed to order variability in multi-echelon systems, building on Forrester's models through analytical and empirical analyses in journals. The concept gained widespread recognition in literature through the seminal 1997 article "The Bullwhip Effect in Supply Chains" by Hau L. Lee, V. Padmanabhan, and Seungjin Whang, published in Sloan Management Review, which synthesized prior work and quantified the effect's prevalence in industries like consumer goods. Post-2020, the bullwhip effect received renewed attention amid global disruptions caused by the , where sudden demand shifts for essentials and delays in information flow exacerbated inventory oscillations worldwide. Analyses of pandemic-era data showed amplified bullwhip ratios in sectors such as pharmaceuticals and , underscoring the effect's role in prolonging shortages and overstocks. This period highlighted the vulnerability of modern, interconnected supply networks to external shocks, prompting further interdisciplinary research into resilience strategies.

Causes

Behavioral Causes

Behavioral causes of the bullwhip effect stem from human patterns and organizational dynamics that amplify variability upstream in s, often independent of structural issues. These behaviors arise when supply chain actors respond to perceived signals in ways that exaggerate fluctuations, leading to overreactions at each tier. Experimental and analytical studies demonstrate that such patterns persist even under controlled conditions where operational distortions are minimized, highlighting the role of cognitive and motivational factors in perpetuating . Demand forecast updating occurs when each supply chain member independently revises their demand predictions based on recent orders from downstream partners, often overweighting short-term trends and underweighting long-term stability. This practice, known as demand signal processing, rationally amplifies variance because actors treat incoming orders as noisy indicators of true consumer demand, resulting in progressively larger order swings upstream. For instance, a retailer might adjust forecasts heavily toward a temporary spike, prompting wholesalers to do the same with even greater intensity, thereby magnifying the initial variation by a factor that increases with the number of tiers. Incentive misalignments arise when individual performance metrics, such as quotas or bonuses tied to short-term targets, encourage order batching or aggressive pushing of to meet goals, distorting true signals. teams, motivated by commissions on rather than overall efficiency, may inflate orders to downstream suppliers to fulfill upstream expectations, creating artificial peaks and troughs that propagate variability. This misalignment fosters a "push" mentality where local optimization undermines global supply stability, as seen in cases where promotional lead to synchronized ordering cycles across tiers. Panic ordering manifests during perceived or actual shortages, where downstream actors place excessively large orders to buffer against supply risks, exacerbating amplification in a self-reinforcing cycle. In the rationing game scenario, retailers strategically over-order when anticipating limited allocations from suppliers, as the optimal response exceeds standard needs to secure a larger share of scarce goods. This intensifies during demand upswings, where a modest increase in consumer purchases triggers disproportionate upstream responses, further distorting . Lack of trust among partners leads to withholding of accurate and , prompting conservative or speculative ordering that heightens variability. Without shared , upstream actors cannot distinguish between true market shifts and downstream manipulations, resulting in hesitant responses or overcorrections based on incomplete . Organizational cultures emphasizing competitive over reinforce this, as partners fear exploitation if they reveal sensitive operational details, thereby sustaining the through fragmented decision-making. Psychological biases, such as underweighting the supply line—in which decision-makers fail to adequately account for in transit when placing orders—contribute to irrational order adjustments that amplify the bullwhip effect beyond rational models. Decision-makers often underweight pipelines and time delays, leading to persistent variability in experimental settings. For example, participants in simulations exhibit bullwhip amplification even when full is available, due to cognitive limitations in supply line . Additional biases, including overconfidence in personal forecasts and anchoring to recent spikes, further exacerbate this by causing overreactions to short-term while ignoring stabilizing historical patterns. These cognitive shortcuts explain why human participants in controlled simulations exhibit bullwhip amplification even when full is available.

Operational Causes

Order batching occurs when participants group multiple small orders into larger, periodic shipments to reduce setup, transportation, or transaction costs, resulting in lumpy demand patterns that amplify variability upstream. For instance, retailers may accumulate customer orders over a fixed interval, such as weekly, before placing a single large order with wholesalers, which creates artificial spikes and troughs in perceived rather than reflecting steady consumer purchases. This practice inherently increases the variance of orders observed by upstream suppliers, as the batch size and frequency directly correlate with heightened demand distortion. Price fluctuations, often driven by promotional discounts or high-low pricing strategies, prompt downstream entities to engage in forward buying, where they in anticipation of future increases, leading to irregular and volatile ordering cycles. During discount periods, retailers and distributors order excessively to capitalize on lower costs, causing a surge in upstream demand, followed by reduced orders once stockpiles are depleted, which exacerbates the bullwhip effect through these cyclical swings. Such promotions, while intended to boost short-term sales, distort the underlying demand signal, making it challenging for manufacturers to forecast accurately and maintain stable production. Rationing and shortage gaming arise during periods of supply scarcity, where allocation policies based on orders—rather than actual sales—encourage customers to inflate their order quantities to secure a larger share of limited inventory. In response to perceived shortages, downstream players submit exaggerated orders to game the system, knowing that suppliers will ration based on these inflated figures, which in turn amplifies demand variability as upstream tiers react to these artificially heightened signals. This behavior creates a feedback loop of overordering and subsequent order cancellations or reductions once allocations are received, further intensifying fluctuations throughout the chain. Long lead times, stemming from production delays, transportation bottlenecks, or extended supplier cycles, compel upstream entities to place orders well in advance and in larger volumes to buffer against uncertainty, thereby magnifying small variations into significant oscillations. When lead times are prolonged, each tier in the must forecast further into the future, increasing reliance on historical data and safety stocks, which amplifies the bullwhip effect as minor downstream changes propagate with greater distortion over time. Reducing these delays can mitigate the issue by allowing more responsive ordering aligned with real-time . Information-related causes of the bullwhip effect stem primarily from distortions in how and are shared and processed across tiers. In typical , downstream partners such as retailers possess accurate point-of-sale (POS) , but this information is often not shared upstream with wholesalers, distributors, or manufacturers. As a result, upstream tiers must rely on orders placed by downstream partners, which serve as noisy signals of actual customer due to local adjustments for , promotions, or batching. This leads to overestimation of variability as signals propagate upstream, amplifying fluctuations beyond the true end-customer . Forecast error propagation further exacerbates the bullwhip effect when each supply chain tier independently updates its forecasts based on the orders received from the immediate downstream partner. Since these orders already incorporate the downstream tier's s—such as overreactions to perceived trends or adjustments—errors compound multiplicatively across tiers. For instance, in a multi-echelon chain, a small variance in retailer can lead to exponentially larger variances in manufacturer orders because each level applies its own forecasting method, often using or s that inherently amplify noise. Research demonstrates that without shared data, the variance of orders at upstream stages can be several times higher than actual variance, even under simple autoregressive moving average (ARMA) demand processes. Delays in information transmission, such as lags in reporting , levels, or status, contribute to reactive that intensifies signal distortion. When upstream partners receive outdated or infrequent updates on downstream activities, they base replenishment orders on stale data, leading to overcorrections for perceived shortages or surpluses. These time lags are particularly pronounced in chains with long communication cycles or manual reporting systems, where a delay in data can cause a wholesaler to misinterpret a temporary dip as a trend decline, prompting excessive ordering that ripples upstream. Control-theoretic analyses show that such delays increase the bullwhip measure, defined as the ratio of order variance to variance, by introducing phase lags in the supply chain's response dynamics. The distinction between centralized and decentralized information structures highlights how fragmented systems amplify local distortions into chain-wide variability. In decentralized setups, each tier operates with partial , and ordering based solely on its own data and incoming orders, which perpetuates error amplification. Conversely, centralized —where end-customer and data are accessible to all tiers via integrated platforms—enables more accurate, synchronized and reduces reliance on distorted order signals. Studies indicate that implementing centralized can eliminate the bullwhip effect in certain linear models by providing every partner with the same unbiased view, though adoption challenges persist due to trust and technological barriers. Operational delays, such as lead times in physical goods movement, can compound these information lags but are distinct from the data flow issues addressed here.

Modeling and Measurement

Beer Distribution Game

The is a simulation designed to illustrate dynamics through . It involves four sequential roles—retailer, wholesaler, distributor, and factory (or manufacturer)—each represented by one or two players who manage and place orders for cases of . The game simulates a multi-echelon where customer demand is generated at the retailer level, starting steadily at four cases per week before a one-time increase to eight cases per week; orders propagate upstream with a two-week shipping delay between each stage and an additional three-week production delay at the factory. The primary objective for all players is to minimize total costs across , including holding costs of $0.50 per case per week for excess and costs of $1.00 per case per week for unmet , while ensuring customer orders are fulfilled without direct communication between roles to mimic real-world information silos. Participants make weekly ordering decisions based solely on their incoming orders and current levels, revealing how local optimization leads to global inefficiencies without coordination. In typical play sessions, even with stable and predictable consumer demand, order variability amplifies progressively upstream: the retailer's orders to the wholesaler show minor fluctuations, but by the factory stage, production orders can oscillate with a variance four times greater than customer demand, accompanied by cycles of 20-25 weeks and a phase lag of about 15 weeks before peak responses align with the demand shift. This amplification, known as the bullwhip effect, emerges from players' tendencies to underweight the supply line in their , often assigning it only about 34% of the appropriate cognitive weight. Developed in the late 1950s to early 1960s at the by Jay Forrester and colleagues, initially as a production-distribution exercise inspired by industrial oscillations at , the game gained its "beer" theme in 1973 and was formalized by John Sterman in 1984 as a tool for teaching . Its educational value lies in demonstrating the need for holistic thinking, collaboration, and awareness of time delays in complex systems, making it a staple in and courses worldwide. Modern variations include digital implementations, such as the MIT Sloan online multiplayer websim launched in the early and updated for broader accessibility, as well as post-2020 adaptations for virtual learning environments that incorporate remote team play and to debrief sessions. These online versions maintain the core mechanics while enabling scalable training for global audiences amid increased demand for digital education tools.

Mathematical Models

The bullwhip effect is commonly quantified using the variance amplification ratio, defined as the ratio of the variance of orders placed upstream to the variance of customer : Var(Qt)Var(Dt)\frac{\text{Var}(Q_t)}{\text{Var}(D_t)}, where QtQ_t represents orders at time tt and DtD_t is . This measure captures the extent of distortion propagating through the , with a value greater than 1 indicating amplification. A foundational analytical model employs an (ARIMA) , specifically the AR(1) model, where follows Dt=μ+ρ(Dt1μ)+ϵtD_t = \mu + \rho (D_{t-1} - \mu) + \epsilon_t, with μ\mu as the , ρ<1|\rho| < 1 as the autocorrelation parameter, and ϵt\epsilon_t as white noise with variance σ2\sigma^2. Under a base-stock policy with lead time LL and moving-average forecasting, the order variance amplification factor is derived as Var(Qt)Var(Dt)=1+2j=1L(1jL+1)2σ2Var(Dt)+2ρ(1ρL+1)(1ρ)2(L+1)[11ρL+1(L+1)(1ρ)]\frac{\text{Var}(Q_t)}{\text{Var}(D_t)} = 1 + 2 \sum_{j=1}^{L} \left(1 - \frac{j}{L+1}\right)^2 \frac{\sigma^2}{\text{Var}(D_t)} + \frac{2\rho(1 - \rho^{L+1})}{(1 - \rho)^2 (L+1)} \left[1 - \frac{1 - \rho^{L+1}}{(L+1)(1 - \rho)}\right], showing how autocorrelation ρ\rho and lead time LL exacerbate the effect. For ρ=0\rho = 0 (independent ), this simplifies to (L+13)σ2(L+1)2Var(Dt)\left(\frac{L+1}{3}\right) \frac{\sigma^2 (L+1)^2}{\text{Var}(D_t)}, highlighting lead time's role in amplification even without correlation. Lee, Padmanabhan, and Whang (1997) decompose the bullwhip effect into components from demand signal processing (forecast updating), order batching, rationing, and fluctuations, providing explicit formulas for each. For forecast updating with AR(1) demand Dt=d+pDt1+utD_t = d + p D_{t-1} + u_t (p<1|p| < 1, utN(0,σ2)u_t \sim N(0, \sigma^2)) and lead time ll, orders are zt=StSt1+Dt1z_t = S_t - S_{t-1} + D_{t-1}, where the order-up-to level St=dk=1l+11pk1p+D0k=1l+1pk+Kk=1l+1i=1kp2(ki)σ2S_t = d \sum_{k=1}^{l+1} \frac{1 - p^k}{1 - p} + D_0 \sum_{k=1}^{l+1} p^k + K \sum_{k=1}^{l+1} \sum_{i=1}^k p^{2(k-i)} \sigma^2; the resulting variance Var(zt)=Var(Dt)+2p(1pl+1)(1pl+2)σ2(1+p)(1p)2\text{Var}(z_t) = \text{Var}(D_t) + \frac{2p(1 - p^{l+1})(1 - p^{l+2}) \sigma^2}{(1 + p)(1 - p)^2} exceeds Var(Dt)\text{Var}(D_t), with amplification increasing in ll and pp. Order batching amplifies variance as Var(Zt)=Nσ2+μ2N(R1)\text{Var}(Z_t) = N \sigma^2 + \mu^2 N (R - 1) for random batching (size RR), Var(Zt)=Nσ2+μ2N2(R1)\text{Var}(Z_t) = N \sigma^2 + \mu^2 N^2 (R - 1) for synchronized batching, and intermediate values for balanced cases, all greater than individual demand variance. Rationing during shortages leads to equilibrium orders zz^* solving p+(p+h)E[D(z/Q)][NF(zN)F(μ)]+[1F(Q)][p+(p+h)D(z)]=0-p + (p + h) E[D(z^* / Q)] [N F(z^* N) - F(\mu)] + [1 - F(Q)] [-p + (p + h) D(z^*)] = 0, where z>znz^* > z^n (newsvendor level), inflating orders and variance. Price variations induce forward buying, yielding order variance Var(zt)>Var(Dt)\text{Var}(z_t) > \text{Var}(D_t) under thresholds SH<SLS_H < S_L. Simulation-based metrics, particularly methods, quantify bullwhip under lead times and forecasting rules by generating multiple demand scenarios and computing order variance ratios. For forecasts with smoothing parameter α\alpha and lead time LL, these simulations reveal amplification growing quadratically with LL, approximately 1+α2L(L+1)/21 + \alpha^2 L(L+1)/2 for independent demand, allowing evaluation of parameter sensitivities. Empirical measurement involves calculating the variance ratio directly from historical order and sales data, often using time-series decomposition to isolate amplification while controlling for trends and . This technique, applied in multi-echelon chains, confirms magnitudes of 2–5 times in practice, guiding by comparing upstream-downstream variances.

Consequences

Inventory and Capacity Fluctuations

The bullwhip effect induces pronounced oscillations in inventory levels across tiers, amplifying small fluctuations in end-consumer into larger swings upstream. During low- phases, retailers and distributors reduce orders to align with perceived stability, causing wholesalers and manufacturers to accumulate excess stock that ties up capital and incurs holding costs. In contrast, demand peaks trigger order surges at higher echelons, often exceeding actual needs and resulting in widespread stockouts, even as downstream partners face minimal shortages. This pattern, observed in industries like consumer goods, stems from distorted demand signals that propagate variability, leading to inefficient . Capacity planning suffers similarly, with the bullwhip effect prompting manufacturers to scale production based on inflated order forecasts, fostering underutilization of facilities and . Overproduction during anticipated high-demand periods leaves idle resources, such as machinery and labor, while sudden order spikes necessitate reactive measures like , temporary hiring, or outsourced production, all of which elevate operational . For instance, in supply chains, resellers' variable orders have historically misled manufacturers into misguided capacity expansions, resulting in persistent idle assets during downturns. To buffer against this heightened perceived demand variability, each supply chain participant inflates holdings, collectively increasing overall chain . This precautionary buildup, driven by amplified variance in orders, exacerbates the excess stock problem, as buffers at multiple tiers compound rather than offset risks. Seminal analyses highlight how such contributes to billions in unnecessary , particularly in grocery and sectors. Paradoxically, these elevated levels fail to enhance reliability, as the bullwhip effect's variability undermines service levels by increasing frequency and reducing order fill rates. Upstream tiers experience more frequent shortages despite aggregate overstocking, leading to delayed deliveries and customer dissatisfaction. confirms that distorted flows contribute to higher costs and affect service levels.

Economic and Operational Costs

The bullwhip effect generates substantial economic costs through excess accumulation upstream in the , where amplified signals lead to overstocking that incurs higher holding expenses, including storage, capital tied up, and obsolescence risks. Trade estimates indicate that such inefficiencies contribute to overall excess costs ranging from 12.5% to 25% of operating costs across the , with -related expenses forming a significant portion due to mismatches between perceived and actual . For instance, studies have quantified cost increases attributable to the bullwhip effect throughout the chain, particularly affecting manufacturers and suppliers who maintain safety stocks to buffer variability. These holding costs encompass not only physical warehousing but also the of immobilized capital and potential write-offs for perishable or outdated goods. Production inefficiencies arise from the bullwhip effect's distortion of demand forecasts, prompting and frequent adjustments that elevate expenses. Fluctuations in orders necessitate repeated machine setups, shutdowns, and shifts in utilization, such as or idling, which drive up operational costs; empirical analyses show that firms experiencing higher bullwhip intensity exhibit greater cost responsiveness to sales changes, with amplified effects in . In extreme cases, rushed to correct shortages can further inflate expenses through inefficient capacity use, though specific benchmarks vary by industry structure. These dynamics underscore how transforms minor retail demand shifts into major upstream resource waste. Transportation and costs escalate due to the effect's encouragement of batch ordering, which results in suboptimal shipment sizes and higher per-unit freight expenses. Suppliers facing erratic order patterns often resort to less-than-truckload shipments or expedited deliveries to meet perceived surges, increasing overall outlays; for example, order batching to minimize transaction costs inadvertently amplifies variability, leading to inefficient utilization. This compounds when excess requires additional handling and redistribution downstream. At the retail level, the bullwhip effect manifests in stockouts triggered by upstream delays or overcommitments, directly eroding through missed opportunities. While downstream entities experience relatively stable consumer demand, amplified upstream volatility can cause disruptions estimated to account for lost equivalent to several percentage points of annual in affected chains. Overall, these losses, combined with the aforementioned cost escalations, can diminish profitability by up to 12.5% of total according to foundational trade analyses. The COVID-19 pandemic exacerbated the bullwhip effect's costs, particularly in sectors like electronics and automotive, where sudden demand shifts for components led to severe mismatches and amplified inefficiencies in electronics supply lines. In the automotive industry, the resulting chip shortages halted production lines, contributing to billions in lost output and heightened logistics expenses due to global disruptions. These post-2020 events highlighted how external shocks intensify the effect, with industry-level data showing varied but significant cost escalations across U.S. manufacturing, including elevated inventory and backlog expenses in affected sectors.

Countermeasures

Traditional Strategies

Traditional strategies to mitigate the bullwhip effect focus on process improvements and policy adjustments within s, emphasizing and operational efficiencies without relying on advanced digital tools. These approaches address root causes such as signal distortion and order variability by enhancing , coordination, and stability across supply chain partners. Seminal work by , Padmanabhan, and Whang highlights that such strategies can significantly reduce inventory fluctuations and improve overall efficiency, as demonstrated in cases like and where amplified order swings were observed due to fragmented information. Information sharing stands as a foundational , enabling upstream suppliers to access downstream demand data directly, thereby reducing forecast errors and order amplification. Vendor-managed inventory (VMI) exemplifies this, where suppliers monitor and replenish retailer inventories based on real-time sales data, minimizing the need for retailers to place erratic orders. Disney and Towill's shows that VMI dynamics can dampen the bullwhip effect by stabilizing replenishment decisions, particularly when combined with accurate point-of-sale , leading to lower variance in orders compared to traditional retailer-managed systems. This approach counters issues like order batching by promoting continuous, smaller replenishments informed by shared visibility. Collaborative planning, , and replenishment (CPFR) extends information sharing through structured joint processes, where supply chain partners align on demand forecasts, production plans, and replenishment schedules. Developed in the by the Voluntary Interindustry Standards (VICS) association, CPFR fosters consensus-based to eliminate independent updates that exacerbate variability. A study on integration via the demonstrates that CPFR reduces lead times by up to 67%, forecasting errors by 60%, and inventory levels by 40%, while boosting service levels by 22% and sales by 47%, effectively curbing the bullwhip effect through enhanced coordination. In practice, this framework has been adopted by retailers and manufacturers to synchronize activities, as seen in partnerships that achieve more accurate signals across tiers. Centralized forecasting consolidates demand prediction at a single point, often using aggregated data from all stages to avoid the cumulative errors from decentralized updates. This method ensures that all echelons base decisions on the same, less variable input—actual customer —rather than distorted orders from downstream partners. Chen, Drezner, Ryan, and Simchi-Levi quantify that under centralized , variability propagates additively with lead times (Var(q_k) = 1 + L/p + L²/p² Var(D)), resulting in substantially lower compared to the multiplicative amplification in decentralized systems. By mitigating independent biases, this stabilizes orders and reduces the need for excessive buffering. Lead time reduction streamlines operations to shorten the interval between order placement and fulfillment, decreasing the reliance on large safety stocks and reactive ordering that amplify fluctuations. Techniques such as just-in-time delivery and process optimization enable quicker responses to actual demand, limiting the time for errors to compound up the chain. Lee, Padmanabhan, and Whang emphasize that compressing s directly lowers order variability, as shorter horizons reduce uncertainty and the impulse for overstocking. Empirical analysis by Hua, Li, and Liang further indicates that reductions are beneficial for bullwhip mitigation when demand processes exhibit positive impulse responses, though outcomes depend on specific ARMA demand characteristics. Stable pricing policies, such as everyday low pricing (EDLP), eliminate promotional discounts that trigger forward buying and demand spikes, promoting consistent consumer behavior and smoother order patterns. By avoiding price variability, these policies prevent batching and gaming behaviors that distort signals upstream. The Association for Supply Chain Management (ASCM) notes that EDLP stabilizes low prices without discounts, reducing the incentive for bulk purchases and thereby lessening amplification. et al. corroborate this, observing that uniform pricing curbs the order swings induced by temporary promotions in retail settings.

Advanced Technologies

Advanced technologies have emerged as powerful tools to mitigate the bullwhip effect by enhancing visibility, accuracy, and responsiveness across supply chains. These innovations leverage data-driven approaches to address amplification of demand variability, focusing on real-time integration and predictive capabilities rather than traditional manual adjustments. (AI) and (ML) enable demand sensing algorithms that process real-time data from point-of-sale systems, , and market trends to generate more precise . These algorithms detect short-term demand shifts, reducing forecasting errors that exacerbate the bullwhip effect by smoothing order variability upstream. For instance, ML models can integrate granular sales data to adjust predictions dynamically, minimizing overordering and stockouts. Studies demonstrate that such AI-driven forecasting can significantly lower demand variance amplification, with improvements in supply chain stability reported through enhanced accuracy. Blockchain technology facilitates secure, transparent sharing of inventory and transaction data across supply chain tiers, countering information distortion that fuels the bullwhip effect. By creating an immutable ledger accessible to all authorized parties, blockchain eliminates discrepancies in order information and enables synchronized replenishment decisions. This decentralized verification reduces reliance on intermediaries and fosters trust, allowing upstream suppliers to access downstream demand signals directly. Research indicates that blockchain architectures can decrease order variability by promoting real-time data consensus, thereby attenuating demand amplification in multi-tier networks. The (IoT) supports real-time tracking of stock levels through sensors embedded in warehouses, vehicles, and products, enabling just-in-time replenishment to curb excess buildup. IoT devices provide continuous updates on status, shipment progress, and environmental conditions, allowing automated triggers for orders based on actual consumption rather than forecasts alone. This visibility dampens the bullwhip effect by aligning replenishment closely with end-consumer demand, reducing uncertainties. Literature reviews highlight IoT's role in enhancing responsiveness, with flows shown to improve and minimize variance propagation. Big data analytics powers predictive models that incorporate external factors such as weather patterns, economic indicators, and trade policies like tariffs to refine demand projections. These models aggregate vast datasets from diverse sources, using advanced algorithms to simulate scenarios and adjust for disruptions that traditional methods overlook. For example, analytics tools can forecast demand impacts from seasonal weather or impending tariffs, enabling proactive inventory adjustments. This holistic approach reduces the bullwhip effect by accounting for volatility drivers, leading to more stable ordering patterns across the chain. Surveys of big data applications in supply chains emphasize their effectiveness in demand forecasting, particularly when integrating multifaceted external variables. Post-2024 developments include AI-powered platforms like RELEX, which optimize upstream planning in retail chains by unifying sensing with supplier . RELEX's system uses AI to propagate accurate signals to manufacturers, reducing amplification through granular, integration. In retail applications, it has enabled better synchronization of production with patterns, mitigating bullwhip-induced fluctuations in sectors facing high volatility. Company implementations post-2024 demonstrate enhanced resilience, with the platform's agentic AI automating adjustments for external shocks.

Variations and Applications

Financial Bullwhip Effect

The financial bullwhip effect refers to the amplification of variability along supply chains, where minor fluctuations in downstream payments or lead to progressively larger swings in upstream financial flows, such as receivables and positions. This phenomenon arises in financial supply chains involving and payment terms, distinct from inventory-based distortions, as it primarily impacts management. Key causes include extended payment terms and trade credit policies that create delayed receivables, as suppliers often extend longer credit to customers while facing shorter payment windows from their own suppliers, exacerbating cash flow mismatches. Additionally, and lead times, along with autocorrelation, propagate these distortions upstream, similar to amplification mechanisms in material flows but applied to monetary cycles. The manifests as upstream suppliers experiencing crunches, which prompt conservative lending practices, reduced production capacity, and heightened , ultimately increasing yield spreads by up to 27.57 basis points per standard deviation in internal from customers. This financial strain can reduce available , impairing a firm's ability to invest or respond to market changes, and in severe cases, lead to broader instability. During the 2008 financial crisis, the effect amplified disruptions in inter-firm credit chains, as funding market contractions forced companies to shorten payment terms and reduce working capital, propagating liquidity shocks upstream and contributing to global supply chain financial distress. In 2025, escalating tariffs have induced payment delays and tightened trade financing, with a projected slowdown in the $10 trillion global trade finance market exacerbating cash flow volatility and amplifying the financial bullwhip through over-importing and subsequent margin squeezes. Measurement typically involves the variance amplification of the (CCC), defined as the of working capital variance (cash + + - ) to customer demand variance in monetary units, where a greater than 1 indicates upstream amplification. Empirical studies across U.S. industries from 2010–2019 show this metric exceeding 1 in 80% of sectors, highlighting the scale of financial distortion.

Bullwhip in Circular Supply Chains

In circular supply chains, which emphasize through closed-loop processes involving product returns, , and , the bullwhip effect adapts to incorporate flows that interact with forward demand signals. These reverse flows, stemming from customer returns and industrial s, can dampen demand variability by providing additional inventory sources, thereby stabilizing orders upstream; however, they may also exacerbate fluctuations if not managed properly due to their nature. For instance, end-of-life returns and by-product recovery introduce feedback loops that alter traditional amplification patterns observed in linear chains. Key factors influencing the bullwhip effect in these systems include return rates and yields, which directly affect predictability and ordering decisions. In sectors integral to circular models, return rates typically range from 16.9% to 20.4%, creating variable reverse inflows that complicate for remanufacturers and suppliers. yields from production processes, such as scrap metal recovery in , further modulate this variability by supplementing raw material needs, but inconsistent yields can lead to overordering or stockouts in upstream nodes. Uncertain return quality—often degraded or incomplete—and timing, influenced by consumer behavior and collection , pose significant challenges, potentially amplifying production swings at higher tiers by distorting perceived demand signals. Recent research from 2024 highlights how combined return and rates can mitigate the effect in circular models. Fussone et al. demonstrate that below a stability threshold where the sum of return rate (β) and by-product rate (ω) is less than 1, increasing circularity reduces order amplification compared to linear supply chains, with higher return volumes enabling up to a 25% decrease in bullwhip metrics under shared return systems of medium-low quality. Similarly, studies on replenishment policies in closed-loop settings show that elevated return volumes (e.g., 80%) combined with pull-based ordering can significantly lower the bullwhip ratio, enhancing overall system stability. These findings underscore the potential for circularity to counteract traditional variability when reverse flows are predictable and integrated effectively. Applications of these dynamics are evident in post-2020 electronics chains, where circular practices have mitigated amplification amid rising e-waste volumes driven by global sustainability mandates like the EU's Circular Economy Action Plan. In such chains, reverse flows from device returns enable that buffers forward demand shocks, reducing inventory oscillations; for example, communication models in e-waste closed-loops have shown that coordinated information sharing on returns can dampen upstream variability by integrating yields into . This approach not only curbs excess capacity but also supports in high-return sectors like .

References

Add your contribution
Related Hubs
User Avatar
No comments yet.