
Community hub
Recent from talks
Contribute something
Nothing was collected or created yet.
CAC 40
View on Wikipedia
The CAC 40 (French pronunciation: [kak kaʁɑ̃t]) (Cotation Assistée en Continu) is a benchmark French stock market index. The index represents a capitalization-weighted measure of the 40 most significant stocks among the 100 largest market caps on the Euronext Paris (formerly the Paris Bourse). It is a price return index. It is one of the main national indices of the pan-European stock exchange group Euronext alongside Euronext Amsterdam's AEX, Euronext Brussels' BEL20, Euronext Dublin's ISEQ 20, Euronext Lisbon's PSI-20 and the Oslo Bors OBX Index. It is an index without dividends. Cotation operates every working day from 9:00 a.m. to 5:30 p.m. It is updated every 15 seconds.
Key Information

History
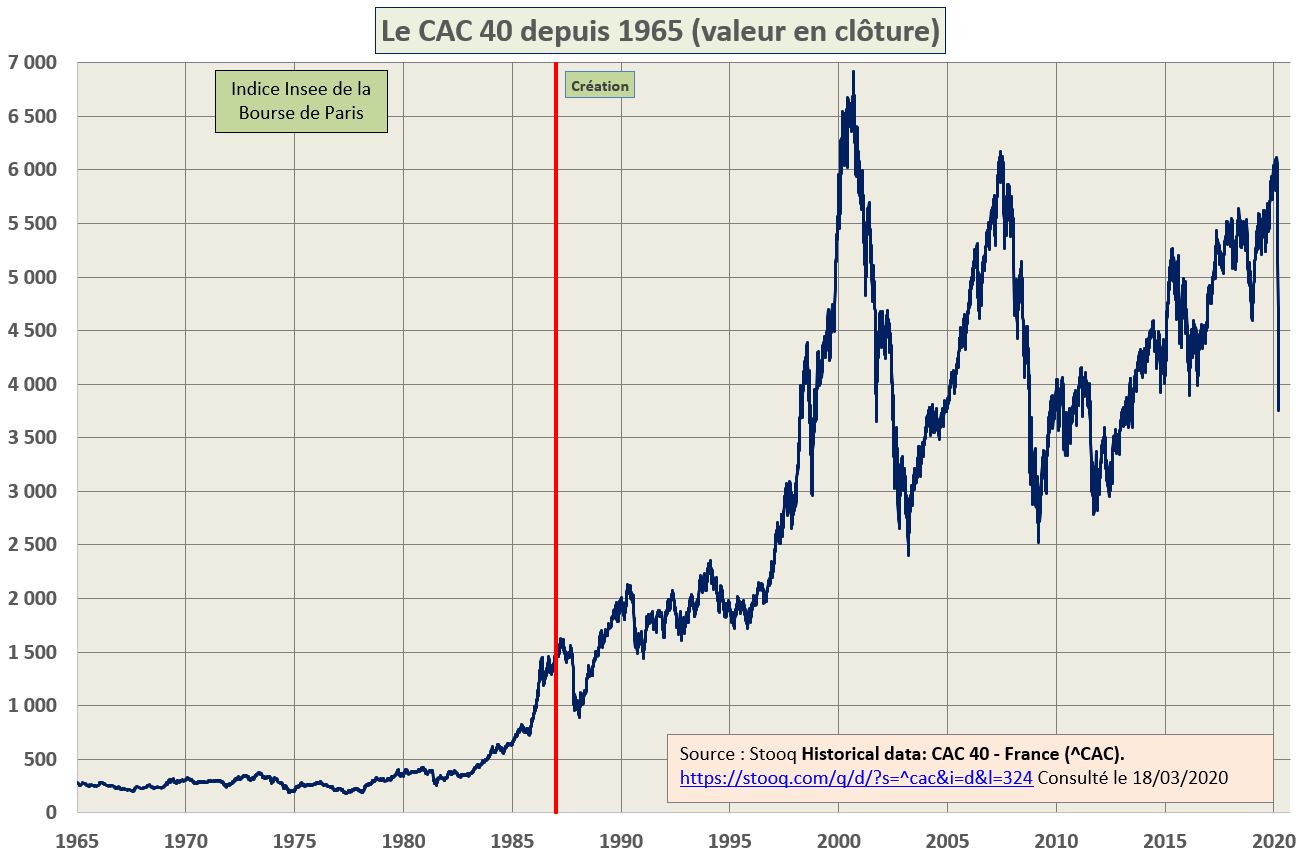
[edit]The CAC 5 and the CAC 40 take their name from the Paris Bourse's early automation system Cotation Assistée en Continu (Continuous Assisted Quotation). CAC 5, inaugurated on 23 June 1986, was a version of the Toronto Computer Assisted Trading System, the first fully automated trading system.[2] CAC 5 consisted of Leroy-Somer, LVMH, Synthélabo, Eurocom and UCB.[3] CAC 40's base value of 1,000 was set on 31 December 1987, equivalent to a market capitalisation of 370,437,433,957.70 French francs.[4] On 1 December 2003, the index's weighting system switched from being dependent on total market capitalisation to free float market cap only, in line with other leading indices.[5]
Rules
[edit]Selection
[edit]The CAC 40 index composition is reviewed quarterly by an independent Index Steering Committee (French: Conseil Scientifique).[4] If any changes are made, they are effected a minimum of two weeks after the review meeting.[4] At each review date, the companies listed on Euronext Paris are ranked according to free float market capitalisation and share turnover over the prior 12 months.[6] From the top 100 companies in this ranking, forty are chosen to enter the CAC 40 such that it is "a relevant benchmark for portfolio management" and "a suitable underlying asset for derivatives products".[6] If a company has more than one class of shares traded on the exchange, only the most actively traded of these will be accepted into the index (generally this will be the ordinary share).[6]
Weighting
[edit]The CAC 40 is a capitalization-weighted index. The number of shares issued (used to calculate the market cap and hence the index weight) of a company is reviewed quarterly, on the third Friday of March, June, September and December.[4] Since December 2003, the index weightings of companies in the index have been capped at 15% at each quarterly index review,[6] but these range freely with share price subsequently. A capping factor is used to limit the weights to 15% (if necessary), and is reviewed annually by the Index Steering Committee on the third Friday of September.[6]
Calculation
[edit]The index value I of the CAC 40 index is calculated using the following formula:[6] with t the day of calculation; N the number of constituent shares in the index (usually 40); Qi,t the number of shares of company i on day t; Fi,t the free float factor of share i; fi,t the capping factor of share i (exactly 1 for all companies not subject to the 15% cap); Ci,t the price of share i on day t; Qi,0 the number of shares of company i on the index base date; Ci,0 the price of equity i on the index base date; and Kt the "adjustment coefficient for base capitalization" on day t (reflecting the switch from the French franc to the Euro in 1999).

Contract specifications
[edit]The CAC 40 index is traded as a future on the Euronext Equities & Index Derivatives (EUREID) exchange under the ticker symbol PIL.
| CAC 40 (PIL) | |
|---|---|
| Exchange: | EUREID |
| Sector: | Index |
| Tick Size: | 0.5 |
| Tick Value: | 5 EUR |
| Big Point Value (BPV): | 10 |
| Denomination: | EUR |
| Decimal Place: | 1 |
Holders
[edit]Although the CAC 40 is almost exclusively composed of French-domiciled companies, about 45% of its listed shares are owned by foreign investors, more than any other main European index.[8] German, Japanese, American and British investors are amongst the most significant holders of CAC 40 shares. This large percentage is due to the fact that CAC 40 companies are more international, or multinational, than any other European market. CAC 40 companies conduct over two-thirds of their business and employ over two-thirds of their workforce outside France.[9]
Record values
[edit]| Type | Date | Value |
|---|---|---|
| Closing high | 15 May 2024 | 8,239.99 |
| Intraday high | 10 May 2024 | 8,259.19 |
Source:[10]
Annual returns
[edit]The following table shows the annual development of the CAC 40, which was calculated back to 1969.[11][12][13]
| Year | Closing level | Change in Index in Points |
Change in Index in % |
|---|---|---|---|
| 1969 | 334.12 | ||
| 1970 | 310.48 | −23.64 | −7.08 |
| 1971 | 286.13 | −24.35 | −7.84 |
| 1972 | 335.18 | 49.05 | 17.14 |
| 1973 | 325.65 | −9.53 | −2.84 |
| 1974 | 225.45 | −100.20 | −30.77 |
| 1975 | 294.60 | 69.15 | 30.67 |
| 1976 | 244.50 | −50.10 | −17.01 |
| 1977 | 228.98 | −15.52 | −6.35 |
| 1978 | 335.53 | 106.55 | 46.53 |
| 1979 | 392.69 | 57.16 | 17.04 |
| 1980 | 422.39 | 29.70 | 7.56 |
| 1981 | 352.11 | −70.28 | −16.64 |
| 1982 | 352.82 | 0.71 | 0.20 |
| 1983 | 552.86 | 200.04 | 56.70 |
| 1984 | 640.01 | 87.15 | 15.76 |
| 1985 | 937.79 | 297.78 | 46.53 |
| 1986 | 1,403.51 | 465.72 | 49.66 |
| 1987 | 1,000.00 | −403.51 | −28.75 |
| 1988 | 1,573.94 | 573.94 | 57.39 |
| 1989 | 2,001.08 | 427.14 | 27.14 |
| 1990 | 1,517.93 | −483.15 | −24.14 |
| 1991 | 1,765.66 | 247.73 | 16.32 |
| 1992 | 1,857.80 | 92.14 | 5.22 |
| 1993 | 2,268.22 | 410.42 | 22.09 |
| 1994 | 1,881.15 | −387.07 | −17.06 |
| 1995 | 1,871.97 | −9.18 | −0.49 |
| 1996 | 2,315.73 | 443.76 | 23.71 |
| 1997 | 2,998.91 | 683.18 | 29.50 |
| 1998 | 3,942.66 | 943.75 | 31.47 |
| 1999 | 5,858.32 | 1,915.66 | 48.59 |
| 2000 | 5,926.42 | 68.10 | 1.16 |
| 2001 | 4,624.58 | −1,301.84 | −21.97 |
| 2002 | 3,063.91 | −1,560.67 | −33.75 |
| 2003 | 3,557.90 | 493.99 | 16.12 |
| 2004 | 3,821.16 | 263.26 | 7.40 |
| 2005 | 4,715.23 | 894.07 | 23.40 |
| 2006 | 5,541.76 | 826.53 | 17.53 |
| 2007 | 5,614.08 | 72.32 | 1.31 |
| 2008 | 3,217.97 | −2,396.11 | −42.68 |
| 2009 | 3,936.33 | 718.36 | 22.32 |
| 2010 | 3,804.78 | −131.55 | −3.34 |
| 2011 | 3,159.81 | −644.97 | −16.95 |
| 2012 | 3,641.07 | 481.26 | 15.23 |
| 2013 | 4,295.95 | 654.88 | 17.99 |
| 2014 | 4,272.75 | −23.20 | −0.54 |
| 2015 | 4,637.06 | 364.31 | 8.53 |
| 2016 | 4,862.31 | 225.25 | 4.86 |
| 2017 | 5,312.56 | 450.25 | 9.26 |
| 2018 | 4,730.69 | −581.87 | −10.95 |
| 2019 | 5,978.06 | 1,247.37 | 26.37 |
| 2020 | 5,551.41 | −426.65 | −7.68 |
| 2021 | 7,153.03 | 1,601.62 | 28.85 |
| 2022 | 6,473.76 | −679.27 | −9.50 |
| 2023 | 7,543.18 | 1,069.42 | 16.52 |
| 2024 | 7,380.74 | −162.44 | -2.15 |
Composition
[edit]The index consists of the following companies as of the quarterly update effective September 2024.
The most recent composition can be found on the Euronext website.[14]
| Company | Sector | GICS Sub-Industry | Ticker |
|---|---|---|---|
| Accor | Consumer Services | Hotels, Restaurants & Leisure | AC.PA |
| Air Liquide | Basic Materials | Industrial Gases | AI.PA |
| Airbus | Industrials | Aerospace & Defense | AIR.PA |
| ArcelorMittal | Basic Materials | Steel | MT.AS |
| Axa | Financial Services | Life & Health Insurance | CS.PA |
| BNP Paribas | Financial Services | Diversified Banks | BNP.PA |
| Bouygues | Industrials | Construction & Engineering | EN.PA |
| Bureau Veritas | Inspection and certification | Consulting | BVI.PA |
| Capgemini | Technology | IT Consulting & Other Services | CAP.PA |
| Carrefour | Consumer Defensive | Hypermarkets & Super Centers | CA.PA |
| Crédit Agricole | Financial Services | Regional Banks | ACA.PA |
| Danone | Consumer Defensive | Packaged Foods & Meats | BN.PA |
| Dassault Systèmes | Technology | Application Software | DSY.PA |
| Edenred | Industrials | Transaction Processing Services | EDEN.PA |
| Engie | Utilities | Gas Utilities | ENGI.PA |
| EssilorLuxottica | Healthcare | Apparel, Accessories & Luxury Goods | EL.PA |
| Eurofins Scientific | Healthcare | Biotechnologies | ERF.PA |
| Hermès | Consumer Cyclical | Apparel, Accessories & Luxury Goods | RMS.PA |
| Kering | Consumer Cyclical | Apparel, Accessories & Luxury Goods | KER.PA |
| L'Oréal | Consumer Defensive | Personal Products | OR.PA |
| Legrand | Industrials | Electrical Components & Equipment | LR.PA |
| LVMH | Consumer Cyclical | Apparel, Accessories & Luxury Goods | MC.PA |
| Michelin | Industrials | Tires & Rubber | ML.PA |
| Orange | Communication Services | Integrated Telecommunication Services | ORA.PA |
| Pernod Ricard | Consumer Defensive | Distillers & Vintners | RI.PA |
| Publicis | Communication Services | Advertising | PUB.PA |
| Renault | Consumer Cyclical | Automobile Manufacturers | RNO.PA |
| Safran | Industrials | Aerospace & Defense | SAF.PA |
| Saint-Gobain | Industrials | Building Products | SGO.PA |
| Sanofi | Healthcare | Pharmaceuticals | SAN.PA |
| Schneider Electric | Industrials | Electrical Components & Equipment | SU.PA |
| Société Générale | Financial Services | Diversified Banks | GLE.PA |
| Stellantis | Consumer Cyclical | Automobile Manufacturers | STLAP.PA |
| STMicroelectronics | Technology | Semiconductors | STMPA.PA |
| Teleperformance | Communication Services | Outsourcing | TEP.PA |
| Thales | Industrials | Aerospace & Defense | HO.PA |
| TotalEnergies | Energy | Integrated Oil & Gas | TTE.PA |
| Unibail-Rodamco-Westfield | Real Estate | Retail REITs | URW.PA |
| Veolia | Industrials | Multi-Utilities | VIE.PA |
| Vinci | Industrials | Construction & Engineering | DG.PA |
See also
[edit]References
[edit]- ^ "CAC 40". boursier.com. Retrieved 1 January 2020.
- ^ Besanger, Serge (2024), Gagner à l'international : l'aventure Leroy-Somer, p. 94.
- ^ Les Echos, 19 june 1986.
- ^ a b c d "CAC 40 index profile". Euronext. Archived from the original on 9 December 2007. Retrieved 3 December 2007.
- ^ "CAC40 shift to free-float weighting: revision of free-float calculation and capping factors" (Press release). Euronext. 5 November 2003. Archived from the original on 27 May 2010. Retrieved 3 December 2007.
- ^ a b c d e f "Rules for the CAC 40 Index" (PDF). Euronext. January 2009. Archived from the original (PDF) on 16 June 2011. Retrieved 17 December 2009.
- ^ "Historical CAC 40 Intraday Data (PIL)". PortaraCQG. Retrieved 28 October 2022.
- ^ Chirac, Jacques (24 March 2006). "Press conference given by M. Jacques Chirac, President of the Republic, following the European Council (excerpts)". Archived from the original on 20 June 2010. Retrieved 27 September 2010.
- ^ Lagarde, Christine (6 May 2006). ""France and Globalization": Lecture Given by Mme Christine Lagarde, Minister Delegate for Foreign Trade, to The Ecole des Hautes Etudes Commerciales in Lille (excerpts)". Retrieved 3 December 2007.
- ^ "CAC 40 (^FCHI)". Yahoo! Finance. Retrieved 13 March 2024.
- ^ "RND". hec.unil.ch. Archived from the original on 13 August 2019. Retrieved 20 January 2020.
- ^ "CAC 40 Index (France) Yearly Stock Returns". 1stock1.com. Retrieved 20 January 2020.
- ^ "CAC 40 (^FCHI) Historical Data – Yahoo Finance". Yahoo! Finance. Retrieved 21 January 2020.
- ^ "CAC 40". Euronext.
*
External links
[edit]- Official Euronext page for CAC 40 Index
- CAC 40 ESG Index official Euronext product page
- FCHI: Summary for CAC 40 INDEX – Yahoo! Finance
- Bloomberg page for CAC:IND
- CAC 40 Index — on Hargreaves Lansdown
| Markets | |||||
|---|---|---|---|---|---|
| National listing venues | |||||
| Indices |
| ||||
| Joint ventures | |||||
| Authority control databases: National |
|---|
CAC 40
View on GrokipediaOverview
Definition and Purpose
The CAC 40 is a capitalization-weighted stock market index that tracks the performance of the 40 largest and most actively traded companies listed on Euronext Paris.[1] It is constructed as a free float-adjusted market capitalization index, incorporating the highest-ranking companies based on free float market capitalization and liquidity criteria such as regulated turnover.[4] Launched with a base date of December 31, 1987, and an initial value of 1,000 points, the index provides a standardized measure of market trends starting from that reference point.[4] The primary purpose of the CAC 40 is to serve as a benchmark for the French equity market, reflecting overall price level trends in the trading of shares on Euronext Paris.[4] It functions as a key barometer of the French economy, symbolizing national economic strength and resilience through the collective performance of its constituent blue-chip companies.[7] Additionally, the index underpins a wide range of financial products, including investment funds, exchange-traded funds (ETFs), structured products, options, and futures, enabling benchmarking for portfolio managers and facilitating derivatives trading.[1] As one of the flagship national indices within the broader Euronext ecosystem, the CAC 40 is administered by Euronext Paris and forms a core part of the CAC Index Family, which collectively supports market transparency and investor access across European exchanges.[4]Economic Significance
As of 2025, the CAC 40 index represents approximately 90% of the total market capitalization of companies listed on Euronext Paris, serving as a key barometer for the French equity market's overall size and performance.[8][9] This substantial coverage underscores its role in encapsulating the economic weight of France's leading corporations, which collectively drive a significant portion of national economic activity through their operations and investments. As a primary benchmark, the CAC 40 exerts considerable influence on investor sentiment in France, often shaping perceptions of economic stability and prompting shifts in portfolio allocations during periods of volatility.[10] It also facilitates corporate financing by enhancing visibility and liquidity for its constituent firms, enabling easier access to capital markets for expansion and innovation. The CAC 40 is widely utilized as the underlying benchmark for various financial products, including exchange-traded funds (ETFs) and mutual funds, allowing investors to gain diversified exposure to French equities with low costs and high liquidity.[11] Examples include prominent ETFs like the Amundi CAC 40 UCITS ETF, which track the index's performance to provide accessible investment vehicles.[12] Beyond France, it functions as a proxy for Eurozone equities, offering insights into regional economic dynamics given France's central role in the bloc.[13] The index's composition, dominated by sectors such as luxury goods, energy, and finance, amplifies its impact on French exports, as fluctuations in these areas directly affect trade balances and international competitiveness.[14][15] In comparison to other major European indices, the CAC 40 provides similar market coverage to the German DAX (approximately 80% of Deutsche Börse's total capitalization)[16] and the UK FTSE 100 (around 80% of the London Stock Exchange's market cap),[17] positioning it as an equivalent blue-chip gauge for France's economic landscape. This alignment highlights its utility in cross-regional analyses, though its heavier weighting toward export-oriented sectors like luxury and energy distinguishes it in reflecting France's trade-driven growth model.History
Launch and Initial Development
The CAC 40 index was created by the Société des Bourses Françaises (SBF) on December 31, 1987, as part of broader financial deregulation efforts in France during the 1980s that transformed the banking and stock market systems, including the shift from traditional auction-based trading at the Palais Brongniart to an electronic continuous quotation system known as Cotation Assistée en Continu.[2][18][19] This deregulation wave, influenced by international trends and domestic reforms like the 1984 public debt market liberalization and the 1987 Banking Reform, aimed to enhance market efficiency and integration within the European Monetary System.[20][21] The index's base value was set at 1,000 points, corresponding to a total market capitalization of approximately 370 billion French francs for its constituents.[2][22] The initial composition included 40 blue-chip companies selected primarily based on their market capitalization and liquidity from the top 100 stocks traded on the Paris Bourse, representing key sectors such as finance, manufacturing, and consumer goods to provide a broad benchmark for the French economy.[2][19] Weighting was determined using full market capitalization, incorporating all shares issued by each company without adjustment for free-float availability, which emphasized the total size of listed firms.[5] The index officially launched for trading on June 15, 1988, calculated in real time daily to reflect ongoing market activity.[2] In its early years, the CAC 40 faced significant challenges from global market shocks, notably the Black Monday crash on October 19, 1987—just months before its base date—which caused the Paris Bourse to drop 4.7% that day and 9.2% over the crash week, testing the resilience of the nascent index amid widespread institutional selling and liquidity strains.[23] Additionally, the index had to adapt to fluctuations in the French franc's value within the European Monetary System, including three devaluations in the early 1980s driven by fiscal policies that heightened currency volatility and affected stock valuations denominated in francs.[24] The CAC 40 transitioned to euro-denominated calculations on January 1, 1999, following the introduction of the euro as the common currency for participating European countries, which eliminated franc-euro conversion risks and aligned the index with the new monetary framework while maintaining continuity in its value series through fixed conversion rates.[25] This shift later paved the way for methodological refinements, such as the adoption of free-float weighting in 2003 to better reflect investable market opportunities.[5]Key Reforms and Milestones
One of the pivotal reforms in the CAC 40's evolution occurred on December 1, 2003, when the index shifted from total market capitalization weighting to a free-float adjusted methodology. This change excluded non-publicly tradable shares, such as those held by major stakeholders or governments, to more accurately represent the investable market opportunity for investors and align with global standards adopted by indices like the FTSE and S&P 500, with individual constituent weights capped at 15% to address concentration risks through an annual adjustment factor reviewed in September.[5][26] The reform enhanced the index's transparency and reduced distortions from controlled shareholdings, contributing to greater investor confidence in its composition.[27] The formation of Euronext in September 2000 through the merger of the Paris, Amsterdam, and Brussels stock exchanges marked a major milestone, integrating the CAC 40 into a unified European trading platform. This pan-European structure improved cross-border liquidity and operational efficiency for CAC 40 constituents, while maintaining the index's focus on French blue-chip companies.[28] In response to the 2008 global financial crisis, Euronext implemented temporary volatility controls, including enhanced circuit breakers and trading halts to mitigate extreme price swings, helping stabilize the index amid a 42.7% annual decline in 2008.[29] The Conseil Scientifique des Indices (Index Steering Committee) conducts quarterly reviews of the CAC 40's composition on the third Fridays of March, June, September, and December. These reviews assess eligibility based on liquidity, market capitalization, and trading volume, ensuring the index dynamically reflects the leading French equities without frequent disruptions.[30] While the core CAC 40 has emphasized methodological stability since these reforms, non-core variants have emerged to meet evolving investor demands. For instance, the CAC 40 ESG index, launched in March 2021, incorporates environmental, social, and governance criteria, with quarterly updates continuing into 2025 to refine its sustainability focus without altering the primary index.[31] In September 2025, Euronext itself was added to the index, effective September 22, marking a notable milestone in the exchange operator's growth.[6]Methodology
Selection Process
The selection process for the CAC 40 index is overseen by the Conseil Scientifique, known in English as the Index Steering Committee (CSI), an independent supervisory body appointed by Euronext.[32] Comprising 3 to 8 members with expertise in index investing, capital markets, and trading, the CSI reviews proposals from Euronext's Index Design team and approves changes to ensure the index remains representative and tradable.[32] Members are selected for their specialist knowledge to reflect the interests of investors and market participants, serving three-year terms with one possible renewal.[32] Eligibility requires companies to have Euronext Paris as their primary market of reference, ensuring a focus on firms with significant French market presence, and to trade continuously in euros.[4] Excluded are companies in recovery or penalty categories, those delisted, or any shifting their primary listing away from Paris without exceptional approval based on French business ties or trading volumes.[4] Within the pool of eligible securities listed on Euronext Paris, candidates are ranked by a combined metric of free-float adjusted market capitalization and average daily regulated turnover over the prior 12 months.[4] The top 40 ranked companies form the index, with a buffer zone encompassing ranks 36 to 45 to prioritize retaining current constituents when possible, promoting stability.[4] Reviews occur quarterly in March, June, September, and December, with the September review serving as the annual assessment.[4] Any approved changes take effect after the market close on the third Friday of the review month.[4] Liquidity is a core criterion, measured by free-float velocity—the ratio of trading volume to free-float market capitalization—requiring at least 20% over 12 months during the annual review, 30% for potential new entrants in quarterly reviews, and 10% for existing members.[4] Free-float calculations assume a minimum of 25% to qualify for velocity assessment, excluding low-liquidity or illiquid shares.[4] Promotions often arise from the CAC Next 20 index, which tracks the next 20 highest-ranked eligible companies, allowing seamless upward mobility based on updated rankings.[4] This free-float emphasis also informs subsequent weighting adjustments to reflect investable market size.[4]Weighting and Capping Rules
The CAC 40 index uses a free-float market capitalization weighting scheme, which assigns weights to constituents based on the portion of their shares available for public trading, adjusted for their market price relative to the aggregate free-float market capitalization of the index. This approach ensures that the index reflects the investable opportunity set on Euronext Paris while mitigating the influence of non-tradable holdings. The weight of each company is calculated as follows: where denotes the individual constituent.[4] To maintain diversification and prevent over-reliance on any single company, the index applies a 15% cap on the maximum weight of any individual constituent. This capping factor is determined on the Review Weighting Announcement Date—two trading days prior to the effective review date—and is implemented during quarterly rebalances in March, June, September, and December. If a company's uncapped weight exceeds 15%, its effective weight is scaled down proportionally, with the excess redistributed among other constituents. Historically, this rule has been invoked for prominent firms with substantial market capitalizations, ensuring no entity disproportionately sways the index's performance.[4] The free-float factor, which represents the percentage of total shares outstanding that are freely tradable (excluding strategic holdings by governments, insiders, or other long-term investors), is sourced from publicly available data and applied in the weighting formula. It is reviewed quarterly on the penultimate Friday of February, May, August, and November, but updates to the number of shares or free-float factor occur only if the free-float deviates by 10% or more from its prior value, or if the share count changes by over 20%, thereby serving as a buffer to minimize unnecessary rebalancing and trading costs. Corporate actions, including stock splits, rights issues, mergers, or spin-offs, are accounted for by adjusting the number of shares and free-float factor at each review, ensuring continuity in the index's representation of the underlying market.[4]Index Calculation
The CAC 40 index is computed as a free-float market capitalization-weighted measure, reflecting the aggregate performance of its 40 constituent companies listed on Euronext Paris. The core formula for the index value is given by: where the sum is taken over all constituents, and the divisor is a scaling factor designed to maintain continuity in the index level across adjustments and events.[4] The adjusted market capitalization for each constituent incorporates several factors to ensure representativeness and prevent undue influence from any single stock. Specifically, the adjusted market cap equals the number of shares outstanding multiplied by the free-float factor (representing the proportion of shares available for public trading, typically updated annually or upon significant changes), the current share price, and the capping factor (limiting individual weights to no more than 15% to promote diversification). This structure weights larger, more liquid companies more heavily while mitigating concentration risks.[4][1] Calculations occur in real time, with the index value disseminated every 15 seconds during Euronext Paris trading hours, from 09:00 to 17:30 CET on regular trading days. The official opening level is established once prices for all constituents are available or when at least 80% of the index value can be determined, ensuring reliable intraday tracking for investors and derivatives markets.[4][33] The index is denominated in euros, serving as the base currency to align with the primary listing market and avoid forex distortions in performance measurement. Adjustments for dividends are handled through variant indices: the standard CAC 40 is a price return index excluding dividends, while the Gross Total Return (GR) and Net Total Return (NR) versions reinvest dividends (GR before taxes, NR after standard withholding taxes) to capture total shareholder returns. Holiday closures follow the Euronext Paris calendar, suspending calculations on non-trading days such as national holidays in France.[4][1] To preserve the index's continuity and prevent artificial fluctuations, the divisor is recalibrated following corporate events such as mergers, acquisitions, stock splits, or spin-offs. This adjustment ensures that changes in constituent capital structures do not distort the index's historical comparability, with recalculations typically effective at the open of the next trading day or as specified in event announcements.[4]Derivatives Specifications
The primary derivatives based on the CAC 40 index are futures and options contracts traded on Euronext Paris. The flagship contract is the CAC 40 Index Future (ticker: FCE), which allows investors to gain exposure to the index's performance. This futures contract has a size of €10 per index point, equivalent to 10 times the index value in euros (for example, approximately €79,500 at an index level of 7,950).[34] The minimum price fluctuation, or tick size, is 0.5 index points, corresponding to €5 per contract in the central order book.[34] Contracts expire on the third Friday of the delivery month at 16:00 CET/CEST, with quarterly cycles in March, June, September, and December as the most liquid, alongside monthly and longer-term maturities up to five years.[34] Settlement is cash-based, determined by the Exchange Delivery Settlement Price (EDSP), which is the arithmetic mean of the CAC 40 index values from 15:40 to 16:00 CET/CEST on the last trading day, rounded to one decimal place; positions are subject to daily mark-to-market adjustments.[34] A smaller variant, the CAC 40 Index Mini Future (ticker: MFC), caters to retail and smaller institutional investors by offering a contract size of €1 per index point, or one-tenth the standard futures value (for example, approximately €7,950 at an index level of 7,950).[35] It shares the same tick size of 0.5 index points (€0.50 per contract) and cash settlement mechanism via EDSP as the standard contract, but is limited to monthly expiries introduced sequentially after prior maturities.[35] Trading occurs on the same platform with extended hours from 08:00 to 22:00 CET/CEST.[35] Options on the CAC 40 are European-style index options (ticker: PXA), exercisable only at expiry, providing hedging and speculative opportunities tied directly to the underlying index.[36] The contract size mirrors the standard futures at €10 per index point, with premiums quoted in euros per index point and a minimum fluctuation of €0.10 (€1 per contract).[36] Strike prices are set according to Euronext's series introduction policy, featuring intervals that vary by time to expiry and index level—typically 10 index points for near-term at-the-money strikes, widening to 25 or 50 points for longer maturities or out-of-the-money options. Expiries follow monthly, quarterly (March, June, September, December cycles up to two years), and annual (December) schedules, with the last trading day at 16:00 CET and exercise window until 19:45 CET.[36] Like the futures, these options are cash-settled based on the EDSP, with premiums payable the following business day.[36]Ownership Structure
Major Institutional Holders
Institutional investors dominate the ownership of CAC 40 constituents, with asset managers collectively holding approximately 25.2% of the total shares as of end 2023.[37] Among these, prominent French institutions such as BNP Paribas Asset Management and AXA Investment Managers (now integrated into BNP Paribas following its 2025 acquisition) play significant roles, managing substantial portfolios that include major stakes in index companies through both direct equity investments and fund products.[38] Pension funds and insurance companies further bolster this dominance, with financial institutions as a category accounting for a key portion of identified holdings, often prioritizing stable, long-term exposure to blue-chip French equities.[37] Domestic French institutions represent about 50.5% of the capital in CAC 40 companies, reflecting a balanced yet influential local ownership structure that supports the index's role as a cornerstone of the national economy.[39] Sovereign wealth funds and central banks contribute through indirect holdings via exchange-traded funds (ETFs) that replicate the CAC 40, with foreign sovereign entities accounting for around 5.1% of shares; notable examples include the Norwegian Government Pension Fund Global, which holds a 1.6% stake across the index.[37] ETFs tracking the CAC 40 exemplify the growing passive investment trend, with the Amundi CAC 40 UCITS ETF Acc managing over €4.2 billion in assets under management (AUM) as of late 2025, enabling broad institutional access to the index without direct stock selection.[40] Passive strategies, including full replication via ETFs and index funds, represent a substantial share of institutional exposure, with passive funds holding 8.6% overall as of end 2023.[37] This shift toward passive replication has increased overall portfolio stability, as these vehicles typically exhibit lower turnover rates compared to active funds.Foreign Investment Patterns
Non-resident investors hold approximately 45-50% of the free-float shares in CAC 40 index constituents as of 2025, underscoring the index's appeal to international capital. At the end of 2023, this ownership stood at 49.5% of the total market capitalization of €2,207 billion for the 35 French-listed companies in the index, a level that has remained stable since 2020.[41][42] The leading sources of this foreign investment are the United States and the Euro area, which together account for over 75% of non-resident holdings. U.S. investors represent 36.6% of non-resident ownership (approximately 18% of total shares), followed by the Euro area at 39.5% (around 20% of total), with Germany contributing 8.0% of non-resident holdings (about 4% of total). The United Kingdom holds 4.7% of non-resident shares (roughly 2% of total), while Japan accounts for 2.1% (about 1% of total). Recent data also indicate growing involvement from Asian sovereign wealth funds, which have increased allocations to European equities amid diversification strategies.[42][43] Trends in foreign investment patterns show a post-Brexit shift, with UK investors redirecting some capital toward stable EU markets like the CAC 40 for diversification away from domestic uncertainties. U.S. ownership has risen since 2020, driven by spillovers from American tech sector growth that bolster demand for CAC 40 luxury goods exporters and energy firms with global ties. Meanwhile, Euro area holdings have slightly declined over the same period.[42][44] EU transparency rules govern these patterns, requiring investors to disclose stakes when crossing the 5% threshold in listed companies, including CAC 40 constituents, to ensure market integrity under the Transparency Directive implemented in French law. This mechanism promotes visibility into foreign positions above significant levels.[45][46] Foreign flows have demonstrated volatility during key events, such as the 2022 energy crisis, when non-residents increased purchases in energy and materials sectors amid surging global prices, contributing to net inflows before a reversal to modest net sales of €1.6 billion in 2023.[42]Historical Performance
Record Highs and Lows
The CAC 40 index achieved an all-time intraday high of 8,314.23 on November 13, 2025, reflecting a period of robust economic recovery and strong performance in key sectors.[3] The corresponding record closing high stands at 8,241.24, recorded on November 12, 2025, surpassing previous peaks amid favorable global trade conditions and domestic growth.[47] Earlier peaks included 8,271.48 intraday and 8,258.86 closing on October 21, 2025, underscoring a sustained upward trajectory driven by export-oriented industries.[48] In contrast, the index's all-time low was 893.82, reached on January 28, 1988, shortly after its inception amid initial market volatility.[49] A notable trough in the post-dot-com bust era occurred in March 2003, with the index closing at 2,509.37 on March 11, marking a significant decline from its 2000 peak due to bursting technology bubbles and global economic slowdown.[50] During the 2008-2009 global financial crisis, the CAC 40 plummeted to a low of approximately 2,465 in March 2009, exacerbated by banking sector turmoil and credit freezes.[51] The COVID-19 pandemic triggered another extreme, with the index dipping to around 3,500 in March 2020 as lockdowns and supply chain disruptions hammered investor confidence.[52] These record highs have often been propelled by booms in France's luxury goods and export sectors, where companies like LVMH and Kering benefit from global demand for high-end products, contributing to index surges during periods of economic expansion.[53] Conversely, the lows typically coincide with global recessions, such as the dot-com aftermath and the 2008 financial meltdown, as well as Eurozone-specific debt crises in the early 2010s, which amplified downturns through heightened sovereign risk and austerity measures.[54] Volatility during these extremes is closely tied to the VSTOXX index, which measures implied volatility for the broader Euro Stoxx 50 and exhibits a strong negative correlation of approximately -0.70 with the CAC 40, highlighting shared European market risks like geopolitical tensions and monetary policy shifts.[55] This interplay underscores the CAC 40's sensitivity to continental economic pressures beyond purely French factors.Annual Returns Overview
The CAC 40 index has exhibited considerable year-to-year variability in its performance since its establishment on December 31, 1987, with annual price returns influenced by economic expansions, recessions, and geopolitical events. Over the period from 1987 to 2024, the index achieved a compound annual growth rate (CAGR) of approximately 7.5%, underscoring its role as a growth-oriented benchmark for French equities despite periodic downturns. This long-term return comes with elevated risk, as measured by a standard deviation of around 18%, highlighting the index's sensitivity to market cycles. To illustrate the range of annual performance, the following table presents selected yearly price returns, drawn from historical closing levels:| Year | Annual Return (%) |
|---|---|
| 1988 | +57.39 |
| 1999 | +48.59 |
| 2002 | -33.75 |
| 2008 | -42.68 |
| 2023 | +16.52 |
| 2024 | -2.15 |
Recent Developments in 2025
As of November 14, 2025, the CAC 40 index had achieved a year-to-date return of approximately +10.7%, closing at 8,170 points.[54][56] This performance marked a rebound from the index's -2.15% return in 2024, reflecting improved market sentiment amid easing monetary policy.[50] In comparison to broader Eurozone peers, the CAC 40 trailed the Euro Stoxx 50, which posted a YTD gain of approximately 16.3% over the same period, highlighting France's relatively subdued growth against regional averages.[57] Early in the year, the index benefited from gains in the first quarter, rising about 6.5% as the European Central Bank (ECB) implemented successive interest rate cuts.[58] The ECB lowered its key deposit rate by 25 basis points on January 30, 2025, to 2.75%, followed by another 25 basis point reduction on March 6 to 2.50%, stimulating economic activity and supporting equity valuations.[59][60] These measures contributed to a positive momentum, with the index climbing steadily through spring. In October 2025, the CAC 40 approached record territory, peaking at 8,258.86 points on October 21 amid a rally in the luxury goods sector.[61] Strong quarterly earnings from key constituents like LVMH, which reported a 1% year-on-year sales increase for Q3, alongside gains in Kering and L'Oréal, propelled the sector higher and lifted the broader index.[62][63] This momentum continued into November, with the index setting new all-time highs, including an intraday peak of 8,314.23 on November 13 and a closing high of 8,241.24 on November 12, driven by resilient corporate performance and optimism over global trade dynamics.[64][47] Throughout 2025, the index experienced volatility spikes driven by geopolitical tensions and energy price fluctuations. French political uncertainty, including ongoing fiscal debates, contributed to heightened market swings in the third quarter, while broader risks such as Middle East conflicts exacerbated energy cost volatility, impacting sectors like utilities and manufacturing.[65][66][67] These factors led to periodic pullbacks, though the index recovered supported by resilient corporate performance. Looking ahead, the CAC 40's trajectory in late 2025 and beyond will likely hinge on stabilizing inflation trends and continued corporate earnings strength. ECB projections indicate inflation holding near the 2% target through year-end, potentially allowing for policy stability, while many CAC 40 firms have delivered earnings beats, particularly in consumer and luxury segments, bolstering investor confidence.[68]Composition
Current Constituents
The CAC 40 index consists of 40 of the largest and most actively traded stocks listed on Euronext Paris, selected based on free-float adjusted market capitalization and liquidity criteria. As of November 2025, following the annual review implemented in September, the constituents represent a combined free-float adjusted market capitalization of approximately €1.9 trillion, providing a benchmark for the French economy across diverse sectors.[1][69] The most recent change occurred during the September 2025 annual review, where Euronext N.V. (symbol: ENX), a pan-European stock exchange operator headquartered in Amsterdam but listed on Euronext Paris, was added to the index, replacing Teleperformance SE due to shifts in market capitalization rankings; this adjustment took effect on September 22, 2025, with no further modifications in the third quarter.[70] Earlier, Veolia Environnement S.A. (VIE), an environmental services company based in Aubervilliers, France, specializing in water management, waste treatment, and energy efficiency, was promoted to the index in 2024, enhancing representation in sustainable infrastructure. Among the top-weighted constituents, LVMH Moët Hennessy - Louis Vuitton SE (MC), a Paris-based luxury goods conglomerate renowned for fashion, perfumes, and wines including brands like Louis Vuitton and Moët & Chandon, holds significant influence. TotalEnergies SE (TTE), headquartered in Courbevoie, France, is a multinational energy corporation transitioning from traditional oil and gas to renewables, with operations in over 130 countries. Sanofi (SAN), a Paris-headquartered pharmaceutical giant, develops treatments in areas like immunology, neurology, and rare diseases. BNP Paribas SA (BNP), based in Paris, provides comprehensive banking, investment, and financial services globally. These leaders, along with others, underscore the index's emphasis on established blue-chip firms. The following table lists all current constituents as of September 22, 2025 (weights as of June 30, 2025, adjusted for the change; actual weights as of November 2025 may vary due to market fluctuations). Sectors follow the Industry Classification Benchmark (ICB).| Company Name | Symbol | Weight (%) | Sector (ICB) |
|---|---|---|---|
| Schneider Electric SE | SU | 7.50 | Industrials |
| TotalEnergies SE | TTE | 6.85 | Energy |
| LVMH Moët Hennessy - Louis Vuitton SE | MC | 6.42 | Consumer Discretionary |
| Airbus SE | AIR | 6.08 | Industrials |
| Air Liquide SA | AI | 5.84 | Basic Materials |
| Safran SA | SAF | 5.78 | Industrials |
| Sanofi | SAN | 5.42 | Health Care |
| L'Oréal SA | OR | 5.05 | Consumer Discretionary |
| BNP Paribas SA | BNP | 4.73 | Financials |
| AXA SA | CS | 4.50 | Financials |
| EssilorLuxottica SA | EL | 4.30 | Health Care |
| Hermès International SCA | RMS | 4.20 | Consumer Discretionary |
| Vinci SA | DG | 3.82 | Industrials |
| Compagnie de Saint-Gobain SA | SGO | 2.61 | Industrials |
| Danone SA | BN | 2.58 | Consumer Staples |
| Engie SA | ENGI | 2.10 | Utilities |
| Société Générale SA | GLE | 2.05 | Financials |
| Legrand SA | LR | 1.72 | Industrials |
| Thales SA | HO | 1.51 | Industrials |
| Orange SA | ORA | 1.39 | Telecommunications |
| Compagnie Générale des Etablissements Michelin SCA | ML | 1.30 | Consumer Discretionary |
| Capgemini SE | CAP | 1.30 | Technology |
| Publicis Groupe SA | PUB | 1.26 | Consumer Discretionary |
| Veolia Environnement SA | VIE | 1.20 | Utilities |
| Dassault Systèmes SE | DSY | 1.19 | Technology |
| Stellantis N.V. | STLAP | 1.04 | Consumer Discretionary |
| Pernod Ricard SA | RI | 0.99 | Consumer Staples |
| STMicroelectronics N.V. | STM | 0.95 | Technology |
| Crédit Agricole S.A. | ACA | 0.84 | Financials |
| Kering SA | KER | 0.79 | Consumer Discretionary |
| ArcelorMittal S.A. | MT | 0.66 | Basic Materials |
| Bureau Veritas SA | BVI | 0.57 | Industrials |
| Unibail-Rodamco-Westfield SE | URW | 0.55 | Real Estate |
| Accor SA | AC | 0.53 | Consumer Discretionary |
| Renault SA | RNO | 0.47 | Consumer Discretionary |
| Eurofins Scientific SE | ERF | 0.44 | Health Care |
| Bouygues SA | EN | 0.42 | Industrials |
| Edenred SA | EDEN | 0.38 | Industrials |
| Carrefour SA | CA | 0.37 | Consumer Staples |
| Euronext N.V. | ENX | 0.27 | Financials |
Sector Allocation
The CAC 40 index exhibits a diversified sector allocation, with significant emphasis on industrials and consumer discretionary sectors as of June 30, 2025. According to official composition data, industrials represent the largest weighting at 31.2%, driven by major contributors in manufacturing and engineering. Consumer discretionary follows at 22.6%, encompassing luxury goods and automotive firms, while financials account for 12.1% and health care 10.2%. Energy stands at 6.9%, basic materials at 6.5%, and smaller allocations include consumer staples (3.9%), technology (3.4%), utilities (3.3%), telecommunications (1.4%), and real estate (0.5%).[69]| Sector | Weight (%) |
|---|---|
| Industrials | 31.2 |
| Consumer Discretionary | 22.6 |
| Financials | 12.1 |
| Health Care | 10.2 |
| Energy | 6.9 |
| Basic Materials | 6.5 |
| Consumer Staples | 3.9 |
| Technology | 3.4 |
| Utilities | 3.3 |
| Telecommunications | 1.4 |
| Real Estate | 0.5 |