

Community hub
Recent from talks
Contribute something
Nothing was collected or created yet.
Haplogroup
View on Wikipedia| Part of a series on |
| Genetic genealogy |
|---|
| Concepts |
| Related topics |
A haplotype is a group of alleles in an organism that are inherited together from a single parent,[1][2] and a haplogroup (haploid from the Greek: ἁπλοῦς, haploûs, "onefold, simple" and English: group) is a group of similar haplotypes that share a common ancestor with a single-nucleotide polymorphism mutation.[3] More specifically, a haplotype is a combination of alleles at different chromosomal regions that are closely linked and tend to be inherited together. As a haplogroup consists of similar haplotypes, it is usually possible to predict a haplogroup from haplotypes. Haplogroups pertain to a single line of descent. As such, membership of a haplogroup, by any individual, relies on a relatively small proportion of the genetic material possessed by that individual.

Each haplogroup originates from, and remains part of, a preceding single haplogroup (or paragroup). As such, any related group of haplogroups may be precisely modelled as a nested hierarchy, in which each set (haplogroup) is also a subset of a single broader set (as opposed, that is, to biparental models, such as human family trees). Haplogroups can be further divided into subclades.
Haplogroups are normally identified by an initial letter of the alphabet, and refinements consist of additional number and letter combinations, such as (for example) A → A1 → A1a. The alphabetical nomenclature was published in 2002 by the Y Chromosome Consortium.[4]
In human genetics, the haplogroups most commonly studied are Y-chromosome (Y-DNA) haplogroups and mitochondrial DNA (mtDNA) haplogroups, each of which can be used to define genetic populations. Y-DNA is passed solely along the patrilineal line, from father to son, while mtDNA is passed down the matrilineal line, from mother to offspring of both sexes. Neither recombines, and thus Y-DNA and mtDNA change only by chance mutation at each generation with no intermixture between parents' genetic material.
Haplogroup formation
[edit]
Mitochondria are small organelles that lie in the cytoplasm of eukaryotic cells, such as those of humans. Their primary function is to provide energy to the cell. Mitochondria are thought to be reduced descendants of symbiotic bacteria that were once free living. One indication that mitochondria were once free living is that each contains a circular DNA, called mitochondrial DNA (mtDNA), whose structure is more similar to bacteria than eukaryotic organisms (see endosymbiotic theory). The overwhelming majority of a human's DNA is contained in the chromosomes in the nucleus of the cell, but mtDNA is an exception. An individual inherits their cytoplasm and the organelles contained by that cytoplasm exclusively from the maternal ovum (egg cell); sperm only pass on the chromosomal DNA, all paternal mitochondria are digested in the oocyte. When a mutation arises in a mtDNA molecule, the mutation is therefore passed down in a direct female line of descent. Mutations are changes in the nitrogen bases of the DNA sequence. Single changes from the original sequence are called single nucleotide polymorphisms (SNPs).[dubious – discuss]
Human Y chromosomes are male-specific sex chromosomes; nearly all humans that possess a Y chromosome will be morphologically male. Although Y chromosomes are situated in the cell nucleus and paired with X chromosomes, they only recombine with the X chromosome at the ends of the Y chromosome; the remaining 95% of the Y chromosome does not recombine. Therefore, the Y chromosome and any mutations that arise in it are passed down in a direct male line of descent.
Other chromosomes, autosomes and X chromosomes (when another X chromosome is available to pair with it), cross over and exchange their genetic material during meiosis, the process of cell division which produces gametes. Effectively this means that the genetic material from these chromosomes gets mixed up in every generation, and so any new mutations are passed down randomly from parents to offspring. That said, genetic linkage remains in play: closer-together mutations tend to be passed down together due to how cross-over works. As a result, it remains possible for one to "guess" haplotypes over a few generations, but the categorization of "groups" over many generations is impossible.
The special feature that both Y chromosomes and mtDNA display is that mutations can accrue along a certain segment of both molecules and these mutations remain fixed in place on the DNA. Furthermore, the historical sequence of these mutations can also be inferred. For example, if a set of ten Y chromosomes (derived from ten different individuals) contains a mutation, A, but only five of these chromosomes contain a second mutation, B, then it is overwhelmingly likely that mutation B occurred after mutation A.
Furthermore, all ten individuals who carry the chromosome with mutation A are the direct male line descendants of the same man who was the first person to carry this mutation. The first man to carry mutation B was also a direct male line descendant of this man, but is also the direct male line ancestor of all men carrying mutation B. Series of mutations such as this form molecular lineages. Furthermore, each mutation defines a set of specific Y chromosomes called a haplogroup.
All humans carrying mutation A form a single haplogroup, and all humans carrying mutation B are part of this haplogroup, but mutation B also defines a more recent haplogroup (which is a subgroup or subclade) of its own to which humans carrying only mutation A do not belong. Both mtDNA and Y chromosomes are grouped into lineages and haplogroups; these are often presented as tree-like diagrams.
Human Y-chromosome DNA haplogroups
[edit]Human Y chromosome DNA (Y-DNA) haplogroups are named from A to T, and are further subdivided using numbers and lower case letters. Y chromosome haplogroup designations are established by the Y Chromosome Consortium.[5]
| |||
Footnotes
| |||
Y-chromosomal Adam is the name given by researchers to the male who is the most recent common patrilineal (male-lineage) ancestor of all living humans.
Major Y-chromosome haplogroups, and their geographical regions of occurrence (prior to the recent European colonization), include:
Groups without mutation M168
[edit]- Haplogroup A (M91) (Africa, especially the Khoisan and Nilotes)
- Haplogroup B (M60) (Africa, especially the Pygmies and Hadzabe)
Groups with mutation M168
[edit](mutation M168 occurred ~50,000 bp)
- Haplogroup C (M130) (Oceania, North/Central/East Asia, North America and a minor presence in South America, Southeast Asia, South Asia, West Asia, and Europe)
- YAP+ haplogroups
- Haplogroup DE (M1, M145, M203)
- Haplogroup D (CTS3946) (Tibet, Nepal, Japan, the Andaman Islands, Central Asia, and a sporadic presence in Nigeria, Syria, and Saudi Arabia)
- Haplogroup E (M96)
- Haplogroup E1b1a (V38) West Africa and surrounding regions; formerly known as E3a
- Haplogroup E1b1b (M215) Associated with the spread of Afroasiatic languages; now concentrated in North Africa and the Horn of Africa, as well as parts of the Middle East, the Mediterranean, and the Balkans; formerly known as E3b
- Haplogroup DE (M1, M145, M203)
Groups with mutation M89
[edit](mutation M89 occurred ~45,000 bp)
- Haplogroup F (M89) Oceania, Europe, Asia, North and South America
- Haplogroup FT (P14, M213) (China, Vietnam,[6] Singapore[7])
- Haplogroup G (M201) (present among many ethnic groups in Eurasia, usually at low frequency; most common in the Caucasus, the Iranian plateau, and Anatolia; in Europe mainly in Greece, Italy, Iberia, the Tyrol, Bohemia; rare in Northern Europe)
- Haplogroup H (L901/M2939)
- H1'3 (Z4221/M2826, Z13960)
- H2 (P96) Formerly known as haplogroup F3. Found with low frequency in Europe and western Asia.
- Haplogroup IJK (L15, L16)
Groups with mutations L15 & L16
[edit]- Haplogroup IJK (L15, L16)
- Haplogroup IJ (S2, S22)
- Haplogroup I (M170, P19, M258) (widespread in Europe, found infrequently in parts of the Middle East, and virtually absent elsewhere[8])
- Haplogroup I1 (M253, M307, P30, P40) (Northern Europe, dominant in Scandinavia)
- Haplogroup I2 (S31) (Central and Southeast Europe, Sardinia, Balkans)
- Haplogroup J (M304) (the Middle East, Turkey, Caucasus, Italy, Greece, the Balkans, North Africa)
- Haplogroup J* (Mainly found in Socotra, with a few observations in Pakistan, Oman, Greece, the Czech Republic, and among Turkic peoples)
- Haplogroup J1 (M267) (Mostly associated with Semitic peoples in the Middle East but also found in; Mediterranean Europe, Ethiopia, North Africa, Pakistan, India and with Northeast Caucasian peoples in Dagestan; J1 with DYS388=13 is associated with eastern Anatolia)
- Haplogroup J2 (M172) (Mainly found in West Asia, Central Asia, Iran, Italy, Greece, the Balkans and North Africa)
- Haplogroup I (M170, P19, M258) (widespread in Europe, found infrequently in parts of the Middle East, and virtually absent elsewhere[8])
- Haplogroup K (M9, P128, P131, P132)
- Haplogroup IJ (S2, S22)
Groups with mutation M9
[edit](mutation M9 occurred ~40,000 bp)
- Haplogroup K
- Haplogroup LT (L298/P326)
- Haplogroup L (M11, M20, M22, M61, M185, M295) (South Asia, Central Asia, Southwestern Asia, the Mediterranean)
- Haplogroup T (M70, M184/USP9Y+3178, M193, M272) (North Africa, Horn of Africa, Southwest Asia, the Mediterranean, South Asia); formerly known as Haplogroup K2
- Haplogroup K(xLT) (rs2033003/M526)
- Haplogroup LT (L298/P326)
Groups with mutation M526
[edit]- Haplogroup M (P256) (New Guinea, Melanesia, eastern Indonesia)
- Haplogroup NO (M214)
- Haplogroup N (M231) (northernmost Eurasia)
- Haplogroup O (M175) (East Asia, Southeast Asia, the South Pacific, South Asia, Central Asia)
- Haplogroup O1 (F265)
- Haplogroup O1a (M119)
- Haplogroup O1b (P31, M268)
- Haplogroup O2 (M122)
- Haplogroup O1 (F265)
- Haplogroup P-M45 (M45) (M45 occurred ~35,000 bp)
- Haplogroup Q-M242 (M242) (Occurred ~15,000–20,000 bp. Found in Asia and the Americas)
- Haplogroup Q-M3 (M3) (North America, Central America, and South America)
- Haplogroup R (M207)
- Haplogroup R1 (M173)
- Haplogroup R1a (M17) (Central Asia, South Asia, and Central, Northern, and Eastern Europe)
- Haplogroup R1b (M343) (Europe, Caucasus, Central Asia, South Asia, North Africa, Central Africa)
- Haplogroup R2 (M124) (South Asia, Caucasus, Central Asia)
- Haplogroup R1 (M173)
- Haplogroup Q-M242 (M242) (Occurred ~15,000–20,000 bp. Found in Asia and the Americas)
- Haplogroup S (M230, P202, P204) (New Guinea, Melanesia, eastern Indonesia)
Human mitochondrial DNA haplogroups
[edit]
Human mtDNA haplogroups are lettered: A, B, C, CZ, D, E, F, G, H, HV, I, J, pre-JT, JT, K, L0, L1, L2, L3, L4, L5, L6, M, N, O, P, Q, R, R0, S, T, U, V, W, X, Y, and Z.
The versions of the mtDNA tree was maintained by Mannis van Oven on the PhyloTree website up to 2016.[9] When the number of new mtDNA tests started to heavily increase, other companies started to develop the mtDNA halpotree. First the company YFull introduced their MTree.[10] In 2025 FamilyTreeDNA introduced their MitoTree(Beta).[11]
|
Phylogenetic tree of human mitochondrial DNA (mtDNA) haplogroups | |||||||||||||||||||||||||||||||||||||||
| Mitochondrial Eve (L) | |||||||||||||||||||||||||||||||||||||||
| L0 | L1–6 | ||||||||||||||||||||||||||||||||||||||
| L1 | L2 | L3 | L4 | L5 | L6 | ||||||||||||||||||||||||||||||||||
| M | N | ||||||||||||||||||||||||||||||||||||||
| CZ | D | E | G | Q | O | A | S | R | I | W | X | Y | |||||||||||||||||||||||||||
| C | Z | B | F | R0 | pre-JT | P | U | ||||||||||||||||||||||||||||||||
| HV | JT | K | |||||||||||||||||||||||||||||||||||||
| H | V | J | T | ||||||||||||||||||||||||||||||||||||
Mitochondrial Eve is the name given by researchers to the woman who is the most recent common matrilineal (female-lineage) ancestor of all living humans.
Defining populations
[edit]
Haplogroups can be used to define genetic populations and are often geographically oriented. For example, the following are common divisions for mtDNA haplogroups:
- African: L0, L1, L2, L3, L4, L5, L6
- West Eurasian: H, T, U, V, X, K, I, J, W (all listed West Eurasian haplogroups are derived from macro-haplogroup N)[12]
- East Eurasian: A, B, C, D, E, F, G, Y, Z (note: C, D, E, G, and Z belong to macro-haplogroup M)
- Native American: A, B, C, D, X
- Australo-Melanesian: P, Q, S
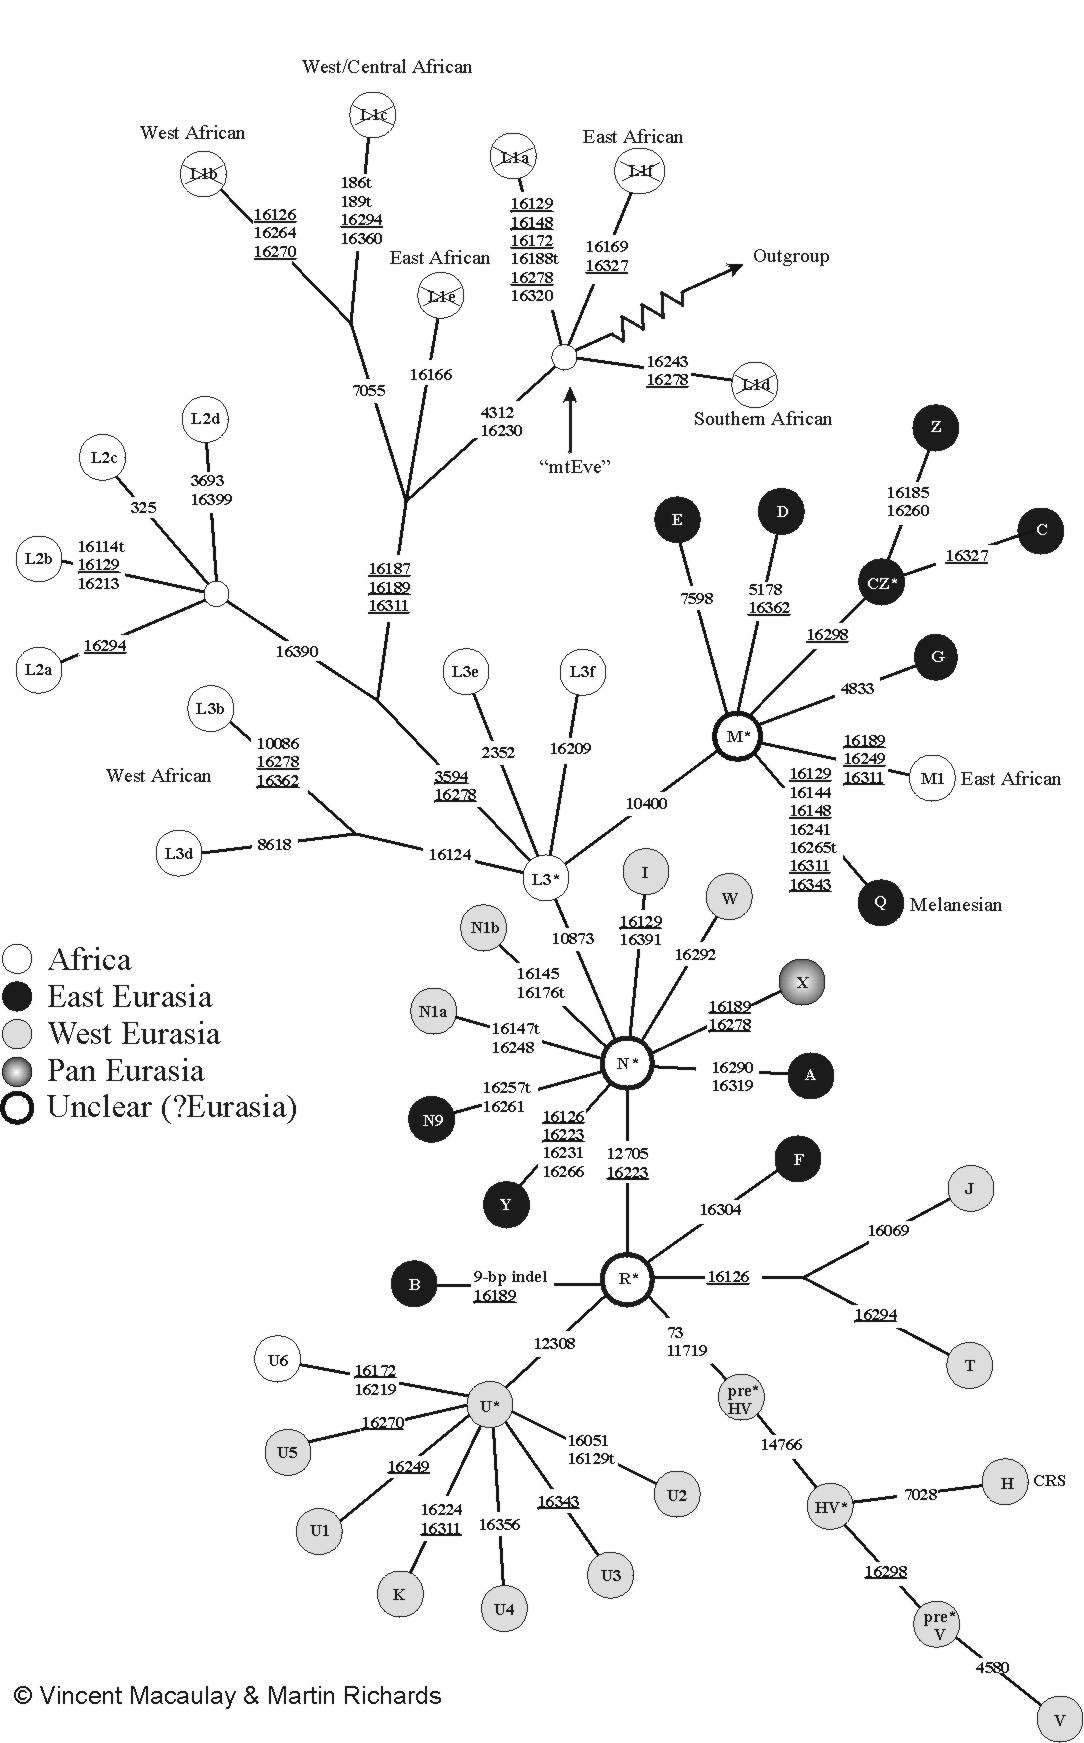
The mitochondrial haplogroups are divided into three main groups, which are designated by the sequential letters L, M, N. Humanity first split within the L group between L0 and L1-6. L1-6 gave rise to other L groups, one of which, L3, split into the M and N group.
The M group comprises the first wave of human migration which is thought to have evolved outside of Africa, following an eastward route along southern coastal areas. Descendant lineages of haplogroup M are now found throughout Asia, the Americas, and Melanesia, as well as in parts of the Horn of Africa and North Africa; almost none have been found in Europe. The N haplogroup may represent another macrolineage that evolved outside of Africa, heading northward instead of eastward. Shortly after the migration, the large R group split off from the N.
Haplogroup R consists of two subgroups defined on the basis of their geographical distributions, one found in southeastern Asia and Oceania and the other containing almost all of the modern European populations. Haplogroup N(xR), i.e. mtDNA that belongs to the N group but not to its R subgroup, is typical of Australian aboriginal populations, while also being present at low frequencies among many populations of Eurasia and the Americas.
The L type consists of nearly all Africans.
The M type consists of:
M1 – Ethiopian, Somali and Indian populations. Likely due to much gene flow between the Horn of Africa and the Arabian Peninsula (Saudi Arabia, Yemen, Oman), separated only by a narrow strait between the Red Sea and the Gulf of Aden.
CZ – Many Siberians; branch C – Some Amerindian; branch Z – Many Saami, some Korean, some North Chinese, some Central Asian populations.
D – Some Amerindians, many Siberians and northern East Asians
E – Malay, Borneo, Philippines, Taiwanese aborigines, Papua New Guinea
G – Many Northeast Siberians, northern East Asians, and Central Asians
Q – Melanesian, Polynesian, New Guinean populations
The N type consists of:
A – Found in many Amerindians and some East Asians and Siberians
I – 10% frequency in Northern, Eastern Europe
S – Some Indigenous Australian (First Nations People of Australia)
W – Some Eastern Europeans, South Asians, and southern East Asians
X – Some Amerindians, Southern Siberians, Southwest Asians, and Southern Europeans
Y – Most Nivkhs and people of Nias; many Ainus, Tungusic people, and Austronesians; also found with low frequency in some other populations of Siberia, East Asia, and Central Asia
R – Large group found within the N type. Populations contained therein can be divided geographically into West Eurasia and East Eurasia. Almost all European populations and a large number of Middle-Eastern population today are contained within this branch. A smaller percentage is contained in other N type groups (See above). Below are subclades of R:
B – Some Chinese, Tibetans, Mongolians, Central Asians, Koreans, Amerindians, South Siberians, Japanese, Austronesians
F – Mainly found in southeastern Asia, especially Vietnam; 8.3% in Hvar Island in Croatia.[13]
R0 – Found in Arabia and among Ethiopians and Somalis; branch HV (branch H; branch V) – Europe, Western Asia, North Africa;
Pre-JT – Arose in the Levant (modern Lebanon area), found in 25% frequency in Bedouin populations; branch JT (branch J; branch T) – North, Eastern Europe, Indus, Mediterranean
U – High frequency in West Eurasia, Indian sub-continent, and Algeria, found from India to the Mediterranean and to the rest of Europe; U5 in particular shows high frequency in Scandinavia and Baltic countries with the highest frequency in the Sami people.
Y-chromosome and MtDNA geographic haplogroup assignment
[edit]Here is a list of Y-chromosome and MtDNA geographic haplogroup assignment proposed by Bekada et al. 2013.[14]
Y-chromosome
[edit]According to SNPS haplogroups which are the age of the first extinction event tend to be around 45–50 kya. Haplogroups of the second extinction event seemed to diverge 32–35 kya according to Mal'ta. The ground zero extinction event appears to be Toba during which haplogroup CDEF* appeared to diverge into C, DE and F. C and F have almost nothing in common while D and E have plenty in common. Extinction event #1 according to current estimates occurred after Toba, although older ancient DNA could push the ground zero extinction event to long before Toba, and push the first extinction event here back to Toba. Haplogroups with extinction event notes by them have a dubious origin and this is because extinction events lead to severe bottlenecks, so all notes by these groups are just guesses. Note that the SNP counting of ancient DNA can be highly variable meaning that even though all these groups diverged around the same time no one knows when.[15][16]
| Origin | Haplogroup | Marker |
|---|---|---|
| Europe (Second Extinction Event?) | I | M170, M253, P259, M227, M507 |
| Europe | I1b | P215, M438, P37.2, M359, P41.2 |
| Europe | I1b2 | M26 |
| Europe | I1c | M223, M284, P78, P95 |
| Europe | J2a1 | M47 |
| Europe | J2a2 | M67, M166 |
| Europe | J2a2a | M92 |
| Europe | J2b | M12, M102, M280, M241 |
| Europe | R1b1b1a | M412, P310 |
| Europe | R1b1b1a1 | L11 |
| Europe | R1b1b1a1a | U106 |
| Europe | R1b1b1a1b | U198, P312, S116 |
| Europe | R1b1b1a1b1 | U152 |
| Europe | R1b1b1a1b2 | M529 |
| Europe | R1b1b1a1b3,4 | M65, M153 |
| Europe | R1b1b1a1b5 | SRY2627 |
| South Asia or Melanesia | C1(formerly known as CxC3) | Z1426 |
| North Asia | C2 (formerly known as C3) | M217+ |
| Indonesia or South Asia | F | M89, M282 |
| Europe (Caucasus) | G | M201, M285, P15, P16, M406 |
| South Asia | H | M69, M52, M82, M197, M370 |
| Europe or Middle East | J1 | M304, M267, P58, M365, M368, M369 |
| Europe or Middle East | J2 | M172, M410, M158, M319, DYS445=6, M339, M340 |
| West of Burma in Eurasia (First Extinction Event?)[17] | ||
| Indonesia (First Extinction Event?) [17] | K2 (NOPS) | M526 |
| South Asia | L | M11, M20, M27, M76, M317, M274, M349, M357 |
| East Asia, South East Asia | N | M231, M214, LLY22g, Tat, M178 |
| East Asia, South East Asia, South Asia | O | M175, M119 |
| Indonesia, Philippines | P (xQR) | 92R7, M207, M173, M45 |
| South Asia, Siberia | R and Q (QR) split [17] | MEH2, M242, P36.2, M25, M346 |
| Middle East, Europe, Siberia, South Asia | R1a1 | M420, M17, M198, M204, M458 |
| Anatolia, South East Europe ? | R1b | M173, M343, P25, M73 |
| Europe | R1b1b | M269 |
| Europe | R1b1b1 | L23 |
| Pakistan, India | R2 | M479, M124 |
| Middle East | T | M70 |
| North Africa | E1b1b1 | M35 |
| North Africa | E1b1b1a | M78 |
| West Asia | E1b1b1a2 | V13 |
| North Africa | E1b1b1a1 | V12 |
| North Africa | E1b1b1a1b | V32 |
| North Africa | E1b1b1a3 | V22 |
| North Africa | E1b1b1a4 | V65 |
| North Africa | E1b1b1b | M81 |
| North Africa | E1b1b1c | M123, M34 |
| West Africa, North Africa | A | M91, M13 |
| East Africa | B | M60, M181, SRY10831.1, M150, M109, M112 |
| Asia, Africa | DE | M1, YAP, M174, M40, M96, M75, M98 |
| East Asia, Nepal | D | M174 |
| West Africa (First Extinction Event?) | E1a | M33 |
| East Africa (First Extinction Event is the split between E1b1 and E1a, second extinction event is the split between E1b1b and E1b1a) | E1b1 | P2, M2, U175, M191 |
| Middle East | J1 | P58 |
mtDNA
[edit]| Origin | Haplogroup |
|---|---|
| Europe | H1 |
| Europe | H11a |
| Europe | H1a |
| Europe | H1b |
| Europe | H2a |
| Europe | H3 |
| Europe | H5a |
| Europe | H6a |
| Europe | H7 |
| Europe | HV0/HV0a/V |
| Europe | I4 |
| Europe | J1c7 |
| Europe | J2b1 |
| Europe | T2b* |
| Europe | T2b4 |
| Europe | T2e |
| Europe | U4c1 |
| Europe | U5* |
| Europe | U5a |
| Europe | U5a1b1 |
| Europe | U5b* |
| Europe | U5b1b* |
| Europe | U5b1c |
| Europe | U5b3 |
| Europe | X2c'e |
| Middle East | I |
| Middle East | A |
| Middle East | B |
| Middle East | C/Z |
| Middle East | D/G/M9/E |
| India | F |
| Middle East | H* |
| Middle East | H13a1 |
| Middle East | H14a |
| Middle East | H20 |
| Middle East | H2a1 |
| Middle East | H4 |
| Middle East | H6b |
| Middle East | H8 |
| Middle East | HV1 |
| Middle East | I1 |
| Middle East | J / J1c / J2 |
| Middle East | J1a'b'e |
| Middle East | J1b1a1 |
| Middle East | J1b2a |
| Middle East | J1d / J2b |
| Middle East | J1d1 |
| Middle East | J2a |
| Middle East | J2a2a1 |
| Middle East | K* |
| Middle East | K1a* |
| Middle East | K1b1* |
| Middle East | N1a* |
| Middle East | N1b |
| Middle East | N1c |
| Middle East | N2 |
| Middle East | N9 |
| Middle East | R* |
| Middle East | R0a |
| Middle East | T |
| Middle East | T1* |
| West Asia | T1a |
| Middle East | T2 |
| Middle East | T2c |
| Middle East | T2i |
| Middle East | U1* |
| Middle East | U2* |
| Middle East | U2e |
| Eurasia | U3* |
| Middle East | U4 |
| Middle East | U4a* |
| Middle East | U7 |
| Middle East | U8* |
| Middle East | U9a |
| Middle East | X |
| Middle East | X1a |
| Middle East | X2b1 |
| North Africa | L3e5 |
| North Africa | M1 |
| North Africa | M1a1 |
| North Africa | U6a |
| North Africa | U6a1'2'3 |
| North Africa | U6b'c'd |
| East Africa | L0* |
| East Africa | L0a1 |
| East Africa | L0a1b |
| East Africa | L0a2* |
| East Africa | L3c/L4/M |
| East Africa | L3d1a1 |
| East Africa | L3d1d |
| East Africa | L3e1* |
| East Africa | L3f* |
| East Africa | L3h1b* |
| East Africa | L3i* |
| East Africa | L3x* |
| East Africa | L4a'b* |
| East Africa | L5* |
| East Africa | L6 |
| East Africa | N* / M* / L3* |
| West Africa | L1b* |
| West Africa | L1b3 |
| West Africa | L1c* |
| West Africa | L1c2 |
| West Africa | L2* |
| West Africa | L2a |
| West Africa | L2a1* |
| West Africa | L2a1a2'3'4 |
| West Africa | L2a1b |
| West Africa | L2a1b'f |
| West Africa | L2a1c1'2 |
| West Africa | L2a1(16189) |
| West Africa | L2a2 |
| West Africa | L2b* |
| West Africa | L2c1'2 |
| West Africa | L2d |
| West Africa | L2e |
| West Africa | L3b |
| West Africa | L3b1a3 |
| West Africa | L3b(16124!) |
| West Africa | L3b2a |
| West Africa | L3d* |
| West Africa | L3e2'3'4 |
| West Africa | L3f1b* |
See also
[edit]References
[edit]- ^ By C. Barry Cox, Peter D. Moore, Richard Ladle. Wiley-Blackwell, 2016. ISBN 978-1-118-96858-1 p. 106. Biogeography: An Ecological and Evolutionary Approach
- ^ Editorial Board, V&S Publishers, 2012, ISBN 9381588643 p. 137. Concise Dictionary of Science
- ^ International Society of Genetic Genealogy 2015 Genetics Glossary
- ^ Consortium, The Y Chromosome (2002-02-01). "A Nomenclature System for the Tree of Human Y-Chromosomal Binary Haplogroups". Genome Research. 12 (2). Cold Spring Harbor Laboratory: 339–348. doi:10.1101/gr.217602. ISSN 1088-9051. PMC 155271. PMID 11827954.
- ^ "Y Chromosome Consortium". Archived from the original on 2017-01-16. Retrieved 2005-07-27.
- ^ Poznik, G. David; Xue, Yali; Mendez, Fernando L.; et al. (2016). "Punctuated bursts in human male demography inferred from 1,244 worldwide Y-chromosome sequences". Nature Genetics. 48 (6): 593–599. doi:10.1038/ng.3559. PMC 4884158. PMID 27111036.
- ^ a b Karmin, Monika; Saag, Lauri; Vicente, Mário; et al. (2015). "A recent bottleneck of Y chromosome diversity coincides with a global change in culture". Genome Research. 25 (4): 459–466. doi:10.1101/gr.186684.114. PMC 4381518. PMID 25770088.
- ^ Rootsi S, Magri C, Kivisild T, Benuzzi G, Help H, Bermisheva M, Kutuev I, Barać L, Pericić M, Balanovsky O, Pshenichnov A, Dion D, Grobei M, Zhivotovsky LA, Battaglia V, Achilli A, Al-Zahery N, Parik J, King R, Cinnioğlu C, Khusnutdinova E, Rudan P, Balanovska E, Scheffrahn W, Simonescu M, Brehm A, Goncalves R, Rosa A, Moisan JP, Chaventre A, Ferak V, Füredi S, Oefner PJ, Shen P, Beckman L, Mikerezi I, Terzić R, Primorac D, Cambon-Thomsen A, Krumina A, Torroni A, Underhill PA, Santachiara-Benerecetti AS, Villems R, Semino O (Jul 2004). "Phylogeography of Y-chromosome haplogroup I reveals distinct domains of prehistoric gene flow in europe" (PDF). American Journal of Human Genetics. 75 (1): 128–37. doi:10.1086/422196. PMC 1181996. PMID 15162323. Archived from the original (PDF) on 2009-06-24. Retrieved 2007-03-08.
- ^ "PhyloTree.org".
- ^ "MTree".
- ^ "Mitotree is Born". 25 February 2025.
- ^ Loogväli EL, Roostalu U, Malyarchuk BA, Derenko MV, Kivisild T, Metspalu E, et al. (2004). "Disuniting uniformity: a pied cladistic canvas of mtDNA haplogroup H in Eurasia". Mol. Biol. Evol. 21 (11): 2012–21. doi:10.1093/molbev/msh209. PMID 15254257.
- ^ Tolk HV, Barac L, Pericic M, Klaric IM, Janicijevic B, Campbell H, Rudan I, Kivisild T, Villems R, Rudan P (Sep 2001). "The evidence of mtDNA haplogroup F in a European population and its ethnohistoric implications". European Journal of Human Genetics. 9 (9): 717–23. doi:10.1038/sj.ejhg.5200709. PMID 11571562.
- ^ Bekada A, Fregel R, Cabrera VM, Larruga JM, Pestano J, Benhamamouch S, González AM (2013). "Introducing the Algerian mitochondrial DNA and Y-chromosome profiles into the North African landscape". PLOS ONE. 8 (2) e56775. Bibcode:2013PLoSO...856775B. doi:10.1371/journal.pone.0056775. PMC 3576335. PMID 23431392.
- ^ "Common genetic ancestors lived during roughly same time period". 1 Aug 2013. Retrieved 23 Jan 2015.
- ^ Raghavan M, Skoglund P, Graf KE, Metspalu M, Albrechtsen A, Moltke I, Rasmussen S, Stafford TW, Orlando L, Metspalu E, Karmin M, Tambets K, Rootsi S, Mägi R, Campos PF, Balanovska E, Balanovsky O, Khusnutdinova E, Litvinov S, Osipova LP, Fedorova SA, Voevoda MI, DeGiorgio M, Sicheritz-Ponten T, Brunak S, Demeshchenko S, Kivisild T, Villems R, Nielsen R, Jakobsson M, Willerslev E (Jan 2014). "Upper Palaeolithic Siberian genome reveals dual ancestry of Native Americans". Nature. 505 (7481): 87–91. Bibcode:2014Natur.505...87R. doi:10.1038/nature12736. PMC 4105016. PMID 24256729.
- ^ a b c Karafet TM, Mendez FL, Sudoyo H, Lansing JS, Hammer MF (Mar 2015). "Improved phylogenetic resolution and rapid diversification of Y-chromosome haplogroup K-M526 in Southeast Asia". European Journal of Human Genetics. 23 (3): 369–73. doi:10.1038/ejhg.2014.106. PMC 4326703. PMID 24896152.
External links
[edit]General
[edit]all DNA haplogroups
[edit]Y-Chromosome
- World Haplogroups Maps (PDF)
Y chromosome DNA haplogroups
[edit]- Y Chromosome Consortium
- ISOGG Y-DNA Haplogroup Tree
- PhyloTree's Y-tree A minimal reference phylogeny for the human Y-chromosome
- Haplogroup Predictor
- The Y Chromosome Consortium (2002), A Nomenclature System for the Tree of Human Y-Chromosomal Binary Haplogroups, Genome Research, Vol. 12(2), 339–48, February 2002. (Detailed hierarchical chart has conversions from previous naming schemes)
- Semino et al. (2000), The Genetic Legacy of Paleolithic Homo sapiens sapiens in Extant Europeans, Science, Vol 290 (paper which introduced the "Eu" haplogroups).
- Y-DNA Ethnographic and Genographic Atlas and Open-Source Data Compilation
Mitochondrial DNA haplogroups
[edit]- PhyloTree – The phylogenetic tree of global human mitochondrial DNA variation
- PhyloD3 – D3.js-based phylogenetic tree based on PhyloTree
- MitoTool – a web server for the analysis and retrieval of human mitochondrial DNA sequence variations Archived 2016-06-19 at the Wayback Machine
- HaploGrep – automatic classification of mitochondrial DNA haplogroups based on PhyloTree Archived 2016-06-12 at the Wayback Machine
- HaploFind – fast automatic haplogroup assignment pipeline for human mitochondrial DNA Archived 2016-06-11 at the Wayback Machine
- graphical mtDNA haplogroup skeleton
- The Making of the African mtDNA Landscape
- Do the Four Clades of the mtDNA Haplogroup L2 Evolve at Different Rates?
Software
[edit]| People | |
|---|---|
| Societies | |
| Projects | |
| Services | |
Haplogroup
View on GrokipediaFundamentals of Haplogroups
Definition and Characteristics
A haplogroup is a monophyletic group of haplotypes that share a common ancestor, defined by the presence of specific derived genetic variants, such as single nucleotide polymorphisms (SNPs), that arose in that ancestor and are inherited by all descendants. These groups form clades in phylogenetic trees, allowing researchers to reconstruct evolutionary relationships among populations based on shared mutational histories. In human genetics, haplogroups are most commonly studied in non-recombining regions of the genome, providing insights into ancient migrations and ancestry.[13] Key characteristics of haplogroups stem from their identification in uniparental genetic markers: the Y-chromosome, which traces patrilineal descent exclusively through males, and mitochondrial DNA (mtDNA), which traces matrilineal descent through females. Unlike autosomal DNA, these markers do not undergo recombination during meiosis, preserving the integrity of ancestral mutations and enabling the reconstruction of lineages spanning tens of thousands of years. A haplotype, by contrast, refers to an individual's specific combination of alleles at multiple linked loci inherited from a single parent, whereas a haplogroup encompasses a broader cluster of such haplotypes united by a common founding mutation.[14] The concept of haplogroups emerged in the 1990s amid advances in molecular anthropology, with the term "haplogroup"—short for "haplotype group"—first formally introduced to describe clusters of related mtDNA sequences sharing diagnostic mutations. Earlier foundational work in the 1980s laid the groundwork through mtDNA studies that revealed distinct lineages, such as the initial classification of Native American maternal ancestries into haplogroups A, B, C, and D based on restriction fragment length polymorphisms.[15] Haplogroups are organized in a hierarchical, tree-like phylogeny, with major clades designated by capital letters (e.g., H for a prevalent European mtDNA haplogroup) and subclades denoted by alternating numbers and lowercase letters (e.g., H1b), each defined by additional unique mutations that mark successive branches from the common ancestor. This nomenclature facilitates precise mapping of genetic diversity and evolutionary divergence.[16][17]Types and Classification
Haplogroups are categorized primarily by the genomic region they represent, including Y-chromosome DNA (Y-DNA) and mitochondrial DNA (mtDNA), each with distinct inheritance patterns prized for tracing deep ancestry due to lack of recombination. Y-DNA haplogroups are male-specific, following strict patrilineal inheritance as the Y chromosome passes unchanged from father to son, enabling reconstruction of deep paternal lineages. In contrast, mtDNA haplogroups are present in all individuals but follow matrilineal inheritance, transmitted solely from mother to all offspring, which facilitates tracking of maternal ancestry over long timescales. Autosomal DNA, derived from the 22 pairs of non-sex chromosomes, involves biparental contributions from both parents and is subject to frequent recombination during meiosis, making it more suitable for analyzing recent admixture and population structure using haplotype blocks rather than stable haplogroups.[16][18] Classification systems focus on uniparental markers (Y-DNA and mtDNA) for delineating deep evolutionary history, while autosomal variants provide insights into more recent genetic mixing across populations. This framework extends beyond humans to non-human species in evolutionary biology, where haplogroups help elucidate phylogenetic relationships; for instance, mtDNA haplogroups in animals and plants reveal divergence events and migration patterns. In humans, Y-DNA haplogroups are denoted by major clades A through T, forming the backbone of paternal phylogeny as established by standardized nomenclature. Similarly, mtDNA haplogroups in humans are often grouped into African macrohaplogroups L0 through L6, representing basal branches of the global maternal tree. Non-human examples include Neanderthal mtDNA haplogroups, such as the NA clade identified in ancient Siberian specimens, which diverged early from modern human lineages and inform interspecies evolutionary dynamics.[19] A key limitation of autosomal analysis for deep ancestry tracing lies in recombination, which shuffles genetic material across generations, rapidly eroding long-range haplotype blocks and complicating the identification of ancient common ancestors compared to uniparental systems. This recombination-driven fragmentation contrasts with the non-recombining nature of Y-DNA and mtDNA, which preserve mutational signatures over millennia, though autosomal data remains invaluable for quantifying admixture proportions in diverse populations.[20][21]Mechanisms of Formation
Genetic Mutations and Inheritance
Haplogroups arise primarily through single nucleotide polymorphisms (SNPs), which are point mutations involving the substitution of one nucleotide for another in the DNA sequence of either the non-recombining portion of the Y chromosome or the mitochondrial genome.[22] These SNPs serve as stable markers that define the boundaries of a haplogroup, as they accumulate over generations without recombination, allowing researchers to trace lineages back to a common ancestor.[23] While SNPs form the foundational identifiers, other genetic variants such as insertions/deletions (indels) and short tandem repeats (STRs) contribute to higher-resolution subclade distinctions within haplogroups, particularly for recent divergences where SNP density is low.[24] Inheritance of haplogroups follows strict uniparental patterns due to the biology of these genomic regions. Y-chromosomal haplogroups are transmitted exclusively from father to son, as the Y chromosome is present only in males and does not undergo recombination with other chromosomes.06098-5) In contrast, mitochondrial DNA (mtDNA) haplogroups are passed from mother to all offspring, regardless of sex, because mtDNA is located in the cytoplasm of the egg and not contributed by sperm.[25] This uniparental, non-recombining transmission results in clonal inheritance, producing star-like phylogenetic structures where all descendants of a mutated ancestor share the identical marker set until further mutations occur.[26] The formation of a new haplogroup begins when a defining mutation, typically an SNP, arises de novo in a single individual and is subsequently inherited by their descendants, establishing a novel lineage branch. Over time, additional mutations in this lineage create nested subclades, forming a hierarchical structure that reflects the cumulative mutational history.[27] For Y-DNA haplogroups, these mutations occur at a rate of approximately one SNP every 100-150 years, providing a molecular clock for estimating divergence times.[28] mtDNA mutations, however, accumulate more rapidly—roughly 10-20 times faster than those in Y-DNA or nuclear DNA—due to the higher error-prone replication of the mitochondrial genome and its exposure to reactive oxygen species.[29] Mutation rates can vary due to factors such as generational length, environmental influences, and demographic events like population bottlenecks, which reduce genetic diversity and can accelerate apparent divergence by fixing rare variants in small populations.[30] These dynamics underscore the utility of haplogroups in reconstructing human evolutionary history while highlighting the need for calibrated rates in phylogenetic analyses.Phylogenetic Relationships
Haplogroups are organized into rooted phylogenetic trees that depict their evolutionary relationships, with the most ancient basal haplogroup at the root and successive subclades branching outward from specific mutational events. For Y-chromosome DNA (Y-DNA), the tree, often called the Y-tree, begins with haplogroup A00 as the root, representing the earliest known divergence in human paternal lineages. Similarly, mitochondrial DNA (mtDNA) haplogroups form an mt-tree, structured as a hierarchy of nested clades defined by shared mutations. These trees illustrate uniparental inheritance patterns, where branches correspond to the spread of particular genetic variants through populations over time.[31][32] Phylogenetic trees for haplogroups are constructed primarily using maximum parsimony methods, which seek the simplest evolutionary explanation by minimizing the number of mutational changes required to explain the observed genetic variation, or Bayesian inference, which incorporates probabilistic models to estimate tree topologies from single nucleotide polymorphism (SNP) data. These approaches rely on high-throughput sequencing of entire genomes or targeted regions, compiling data from thousands of samples to resolve branching patterns. Specialized resources like PhyloTree for mtDNA, which integrates over 24,000 full mitogenome sequences into a tree with more than 5,400 nodes, and the International Society of Genetic Genealogy (ISOGG) Y-DNA tree, which curates SNP-based clades from global testing, maintain and update these structures through community-driven validation and software tools for alignment and tree building.[33][32][34] Interpretation of these trees involves estimating the time to the most recent common ancestor (TMRCA) for each branch, calculated by applying calibrated mutation rates—typically derived from ancient DNA or pedigree studies—to the number of accumulated SNPs along lineages, often within the coalescent theory framework that probabilistically models lineage mergers backward in time. Coalescent theory provides a foundation for understanding branching points as reflections of population bottlenecks, expansions, or migrations, allowing researchers to infer demographic histories without direct fossil evidence. These estimates help contextualize the scale of human evolution, such as placing major divergences tens of thousands of years ago.[35][35] Haplogroup trees are inherently dynamic, undergoing frequent revisions as advances in sequencing technology uncover novel variants; for instance, Big Y testing in the 2020s has identified thousands of private SNPs, refining the Y-tree by adding hundreds of new subclades annually and improving resolution for recent branches. Such updates ensure the trees remain accurate representations of genetic diversity, incorporating data from diverse populations to avoid biases in earlier models. Geographic patterns emerge from these refined structures, linking clades to migration routes observed in archaeological records.[36][34]Y-Chromosome Haplogroups in Humans
Major Clades and Mutations
Human Y-chromosome DNA (Y-DNA) haplogroups are organized into a phylogenetic tree rooted in Africa, with the most basal clades comprising haplogroup A, which includes subclades A0 through A3. These African-specific lineages represent the deepest branches of the human Y-DNA phylogeny, with A0-T (defined by P108) being among the oldest, estimated to have originated approximately 200,000 to 300,000 years ago in Africa.[37] Haplogroup A is characterized by ancient subclades such as A1a (M31) and A1b (P82), which exhibit high genetic diversity and are defined by early mutations in the non-recombining region. Subsequent basal clades, including B (M60), diversified within Africa over tens of thousands of years, reflecting regional population expansions.[38] The transition to non-African haplogroups occurred through haplogroup BT (M91), which arose around 100,000 years ago and served as the progenitor for all lineages outside the most basal A branches. From BT, the primary macrohaplogroup C (M130) emerged, marking early expansions into Eurasia and Oceania, while DE (M145/M203) split into D (M174, associated with Asian populations like Ainu and Tibetans) and E (M96, prominent in Africa and Europe). Key defining mutations for BT include the transition at M91, alongside other SNPs that distinguish it from A and B clades.[5] [39] Within the F (M89) macrohaplogroup, downstream from BT, major clades diversified into G (M201, Caucasus and Middle East), H (M69, South Asia), I (M170, Europe), J (M304, Near East and Europe), and K (M9). Haplogroup R (M207), a derivative of K via P (M45), further diversified into R1 (M173, widespread in Europe and Asia) and R2, with R1b (M343) defined by additional mutations like M269, associated with Western European expansions. Representative subclades include I1 (M253) and I2 (P215) under I, linked to Northern and Southern European lineages, and Q (M242) under P, associated with Siberian and Native American populations.[6] [40] Recent advances in whole Y-chromosome sequencing during the 2020s have refined the resolution of clades, revealing finer structures within E (e.g., E1b1b-M35 with subclade V22 defined by specific SNPs) and R (e.g., R1a-Z93 in South Asia), tracing back to ancient migrations around 20,000 years ago. These studies highlight increased subclade diversity from ancient DNA analyses worldwide.[41] The evolution of Y-DNA haplogroups is influenced by a mutation rate estimated at approximately 0.76 × 10^{-9} mutations per base pair per year in the non-recombining region, which is slower than mtDNA and facilitates tracking of deep paternal lineages over long timescales. Historical paternal bottlenecks, such as those during out-of-Africa migrations, reduced effective population sizes and amplified genetic drift, leading to lower diversity in non-African lineages compared to African ones.[42]Nomenclature and Phylogeny
The nomenclature for human Y-chromosome DNA (Y-DNA) haplogroups evolved significantly from the 2000s, when initial classifications relied on binary markers like YAP (DYS287) to define broad lineages such as A through I. This approach, limited by technology, focused on a few polymorphic sites and resulted in coarse groupings, as seen in early Y Chromosome Consortium (YCC) studies compiling global datasets. By the 2010s, advances in next-generation sequencing enabled analysis of the full non-recombining Y region (~23 Mb), allowing for precise definitions incorporating thousands of single nucleotide polymorphisms (SNPs), which refined haplogroups and resolved subclades.[16] The standardized naming system, maintained by the International Society of Genetic Genealogy (ISOGG), employs an alphanumeric scheme where major clades are designated by capital letters (e.g., A, B, R), and subclades by nested numbers and lowercase letters (e.g., R1b1a1b), reflecting phylogenetic branching based on diagnostic SNPs.[34] This system, formalized by the YCC in 2002 and updated annually by ISOGG, ensures hierarchical consistency, with names assigned to monophyletic groups sharing derived mutations. The ISOGG Y-DNA Haplogroup Tree (version 2024) incorporates over 300,000 SNPs and defines thousands of haplogroups, with ongoing revisions driven by big data from commercial testing and ancient genomes; as of 2025, community efforts like YFull and FamilyTreeDNA have extended the tree using datasets exceeding 1 million Y-chromosomes.[43] Phylogenetic updates to the Y-DNA tree integrate new sequences through maximum likelihood methods, often using tools like RAxML or IQ-TREE under substitution models accounting for rate variation, supplemented by Bayesian approaches for branch support. Recent incorporations include ancient Y-DNA from 2020s analyses, such as those revealing Neanderthal admixture signals in non-African lineages, prompting reevaluations of branches like F and K. Time to most recent common ancestor (TMRCA) estimates for clades are derived using the rho statistic or Bayesian skyline plots, calibrated against pedigree rates (e.g., ~130 years per mutation); this provides age approximations assuming a molecular clock, though ancient DNA calibration improves accuracy for recent events.[44] Compared to mtDNA haplogroups, Y-DNA nomenclature handles a larger genome size (~23 Mb vs. 16.5 kb), requiring more SNPs for resolution but benefiting from uniparental inheritance without recombination. However, Y-DNA faces challenges from structural variants and copy-number differences in ampliconic regions, which can complicate assignment in low-coverage samples, necessitating high-depth sequencing (>30x) for reliable calls in ancient or diverse datasets.Mitochondrial DNA Haplogroups in Humans
Major Clades and Mutations
Human mitochondrial DNA (mtDNA) haplogroups are organized into a phylogenetic tree rooted in Africa, with the most basal clades comprising macrohaplogroup L, which includes L0 through L6. These African-specific lineages represent the deepest branches of the human mtDNA phylogeny, with L0 being the oldest, estimated to have originated approximately 150,000 to 200,000 years ago in eastern or southern Africa.[37] L0 is characterized by ancient subclades such as L0a, L0d, and L0k, which exhibit high genetic diversity and are defined by early coding region mutations like those at positions 195 and 2472. Subsequent basal clades, including L1, L2, L3, L4, L5, and L6, diversified within Africa over tens of thousands of years, reflecting regional population expansions and adaptations.[45] The transition to non-African haplogroups occurred through haplogroup L3, which arose around 70,000 years ago in eastern Africa and served as the progenitor for all Eurasian and American lineages. From L3, the two primary macrohaplogroups M and N emerged, marking the foundational split that facilitated the out-of-Africa dispersal. Macrohaplogroup M includes subclades like M1 (primarily African) and derivatives such as M8, while N encompasses diverse branches including R, which is analogous in its basal role to the Y-chromosome haplogroup R-M207 but traces matrilineal inheritance. Key defining mutations for L3 include the hypervariable region I transition at position 16311, alongside coding mutations like 769 and 1018, which distinguish it from earlier L clades.[46][47] Within macrohaplogroup N, haplogroup R further diversified into major European and Asian clades, giving rise to H and U. Haplogroup H, defined by mutations such as 2706 and 7028, represents a prominent branch associated with post-glacial expansions in Eurasia. Haplogroup U, characterized by transitions at 11467 and 12308, exhibits broad distribution and includes subclades like U5 and U8. Representative subclades include H1 and H3 under H, which carry additional mutations like 3010 for H1, and B4 under M, defined by 8281-8289del, linked to coastal migrations across Asia and into the Pacific.[46] Recent advances in full mtDNA genome sequencing during the 2020s have refined the resolution of Native American clades derived from M and N, revealing finer structures within A2 (with subclade A2o defined by 5154 and 9773) and C1 (including C1b with 3552), which trace back to Beringian founders around 20,000 years ago. These studies highlight increased subclade diversity from ancient DNA analyses in the Americas.[41] The evolution of mtDNA haplogroups is influenced by a relatively high mutation rate, estimated at approximately 2.87 × 10^{-6} mutations per base pair per generation in the coding region, which is about ten times faster than nuclear DNA and facilitates rapid lineage divergence.[29] Historical maternal bottlenecks, such as those during the out-of-Africa migration, reduced effective population sizes and amplified genetic drift, leading to the fixation of specific mutations and lower diversity in non-African lineages compared to African ones.[48]Nomenclature and Phylogeny
The nomenclature for human mitochondrial DNA (mtDNA) haplogroups evolved significantly from the 1990s, when initial classifications relied primarily on sequencing the hypervariable region 1 (HVR1) of the control region to define broad lineages such as L0 through L3. This approach, limited by technology, focused on polymorphic sites in the non-coding control region (approximately 1.1 kb) and resulted in coarse groupings based on shared motifs, as seen in early studies compiling databases of HVR1 sequences from global populations. By the post-2000 era, advances in sequencing enabled full mitogenome analysis (16.569 kb), allowing for more precise definitions incorporating coding region single nucleotide polymorphisms (SNPs), which refined haplogroups and resolved subclades previously indistinguishable. The standardized naming system, maintained by PhyloTree.org, employs an alphanumeric scheme where major clades are designated by capital letters (e.g., H, U), and subclades by nested numbers and lowercase letters (e.g., H1a1), reflecting phylogenetic branching based on diagnostic SNPs in both the control region and coding sequence.[32] This system, introduced in the mid-1990s and formalized through revisions, ensures hierarchical consistency, with names assigned to nodes in the tree representing monophyletic groups sharing derived mutations. PhyloTree Build 17, released in 2016, incorporated over 24,000 sequences and defined more than 5,400 haplogroups, with periodic revisions driven by accumulating full-sequence data; while official updates ceased after 2016, community efforts and commercial databases have extended refinements into the 2020s using expanded datasets exceeding 100,000 mitogenomes, including FamilyTreeDNA's February 2025 update adding 35,000 new branches from over 250,000 sequences via the Million Mito Project.[7] Phylogenetic updates to the mtDNA tree integrate new sequences through automated maximum likelihood reconstruction, often using tools like RAxML under the GTR+Γ model, supplemented by Bayesian inference in specialized studies to account for substitution rate heterogeneity and improve branch support.[44] Recent incorporations include ancient mtDNA from 2020s analyses, such as those revealing Denisovan admixture signals in Eurasian lineages, which have prompted reevaluations of basal branches like M and N by aligning archaic sequences to modern trees. Time to most recent common ancestor (TMRCA) estimates for clades are commonly derived using the ρ (rho) statistic, which calculates mean branch lengths from mutation distances to the clade founder, calibrated against established rates (e.g., one transition per 3,624 years in the coding region); this method provides robust age approximations, though it assumes a molecular clock and can underestimate deep-time events without ancient calibration. Compared to Y-chromosome haplogroups, mtDNA nomenclature benefits from the smaller genome size (16.5 kb versus ~23 Mb non-recombining Y region), enabling comprehensive sequencing and higher resolution with fewer variants, which contributes to greater phylogenetic stability due to uniparental inheritance and lack of recombination. However, mtDNA faces unique challenges from heteroplasmy—the coexistence of wild-type and mutant mtDNA molecules within cells—which can complicate haplogroup assignment in low-level variants, particularly in ancient or degraded samples, necessitating thresholds (e.g., >70% frequency) for reliable calls.Geographic and Population Distribution
Y-DNA Patterns Worldwide
Y-DNA haplogroups exhibit distinct geographic distributions that reflect ancient human migrations and population expansions. In Africa, the continent of origin for modern humans, basal haplogroups such as A and B predominate among indigenous groups like the Khoisan, comprising approximately 80% of their paternal lineages, while haplogroup E1b1a reaches frequencies of around 60% in West African populations, associated with the spread of Bantu-speaking peoples.[49][50] Outside these core areas, Y-DNA diversity is relatively low, with limited penetration of non-African clades until recent historical admixture. In the Americas, haplogroup Q dominates paternal lineages among indigenous populations, with frequencies often exceeding 80% in groups such as the Maya and Amazonian tribes, tracing back to Paleolithic migrations across the Beringian land bridge around 15,000–20,000 years ago.[51] In Eurasia, patterns shift markedly. Haplogroup R1b dominates Western Europe, with frequencies ranging from 50% to over 90% in regions like Ireland and the Basque Country, linked to post-Ice Age expansions and later Bronze Age movements.[52] In contrast, R1a prevails in Eastern Europe and parts of South Asia, occurring at 20-50% in populations such as Poles, Russians, and northern Indians, reflecting eastern steppe influences. Haplogroup J is prominent in the Middle East, at 20-40% among Arab and Levantine groups, tied to Neolithic dispersals from the Fertile Crescent.[53][54][55] Across Asia and Oceania, haplogroup distributions highlight coastal and inland migrations. Haplogroup C reaches about 60% among Indigenous Australians, evidencing early arrivals via the southern route out of Africa around 50,000 years ago. In East Asia, haplogroup O is the most common, at 50-70% in Han Chinese and Japanese populations, originating from Southeast Asian expansions during the Holocene. Recent genomic studies from the 2020s in Siberia reveal mixed Q and N haplogroups, with Q at up to 90% among Kets and N dominant in Uralic speakers, indicating Paleolithic connections to Native American ancestors and later Eurasian admixtures.[56][57][58] These patterns inform inferences about major human dispersals. The Out-of-Africa migration around 60,000-70,000 years ago is marked by the emergence and spread of macro-haplogroup CT beyond Africa, carrying precursors to most non-African Y-DNA lineages via a southern coastal route. Later, Indo-European expansions from the Pontic-Caspian steppe approximately 4,000-5,000 years ago are evidenced by the rapid dissemination of R1a and R1b subclades into Europe and South Asia, correlating with linguistic and archaeological shifts.[59][54]| Region | Major Haplogroup(s) | Approximate Frequency | Associated Migration/Event |
|---|---|---|---|
| Africa (Khoisan) | A, B | ~80% | Basal human origins |
| West Africa | E1b1a | ~60% | Bantu expansion |
| Western Europe | R1b | 50-90% | Bronze Age steppe influx |
| Eastern Europe/India | R1a | 20-50% | Indo-European dispersal |
| Middle East | J | 20-40% | Neolithic farming spread |
| Australia | C | ~60% | Initial Out-of-Africa wave |
| East Asia | O | 50-70% | Holocene Asian expansions |
| Siberia | Q, N | Variable (Q up to 90% in some groups) | Paleolithic Beringian links |
| Americas | Q | >80% | Beringian migration |