Hubbry Logo
QRS complexQRS complexMain
Open search
QRS complex
Community hub
QRS complex
logo
8 pages, 0 posts
0 subscribers
Be the first to start a discussion here.
QRS complex
QRS complex
from Wikipedia
Schematic representation of a normal sinus rhythm ECG wave.
Diagram showing how the polarity of the QRS complex in leads I, II, and III can be used to estimate the heart's electrical axis in the frontal plane.

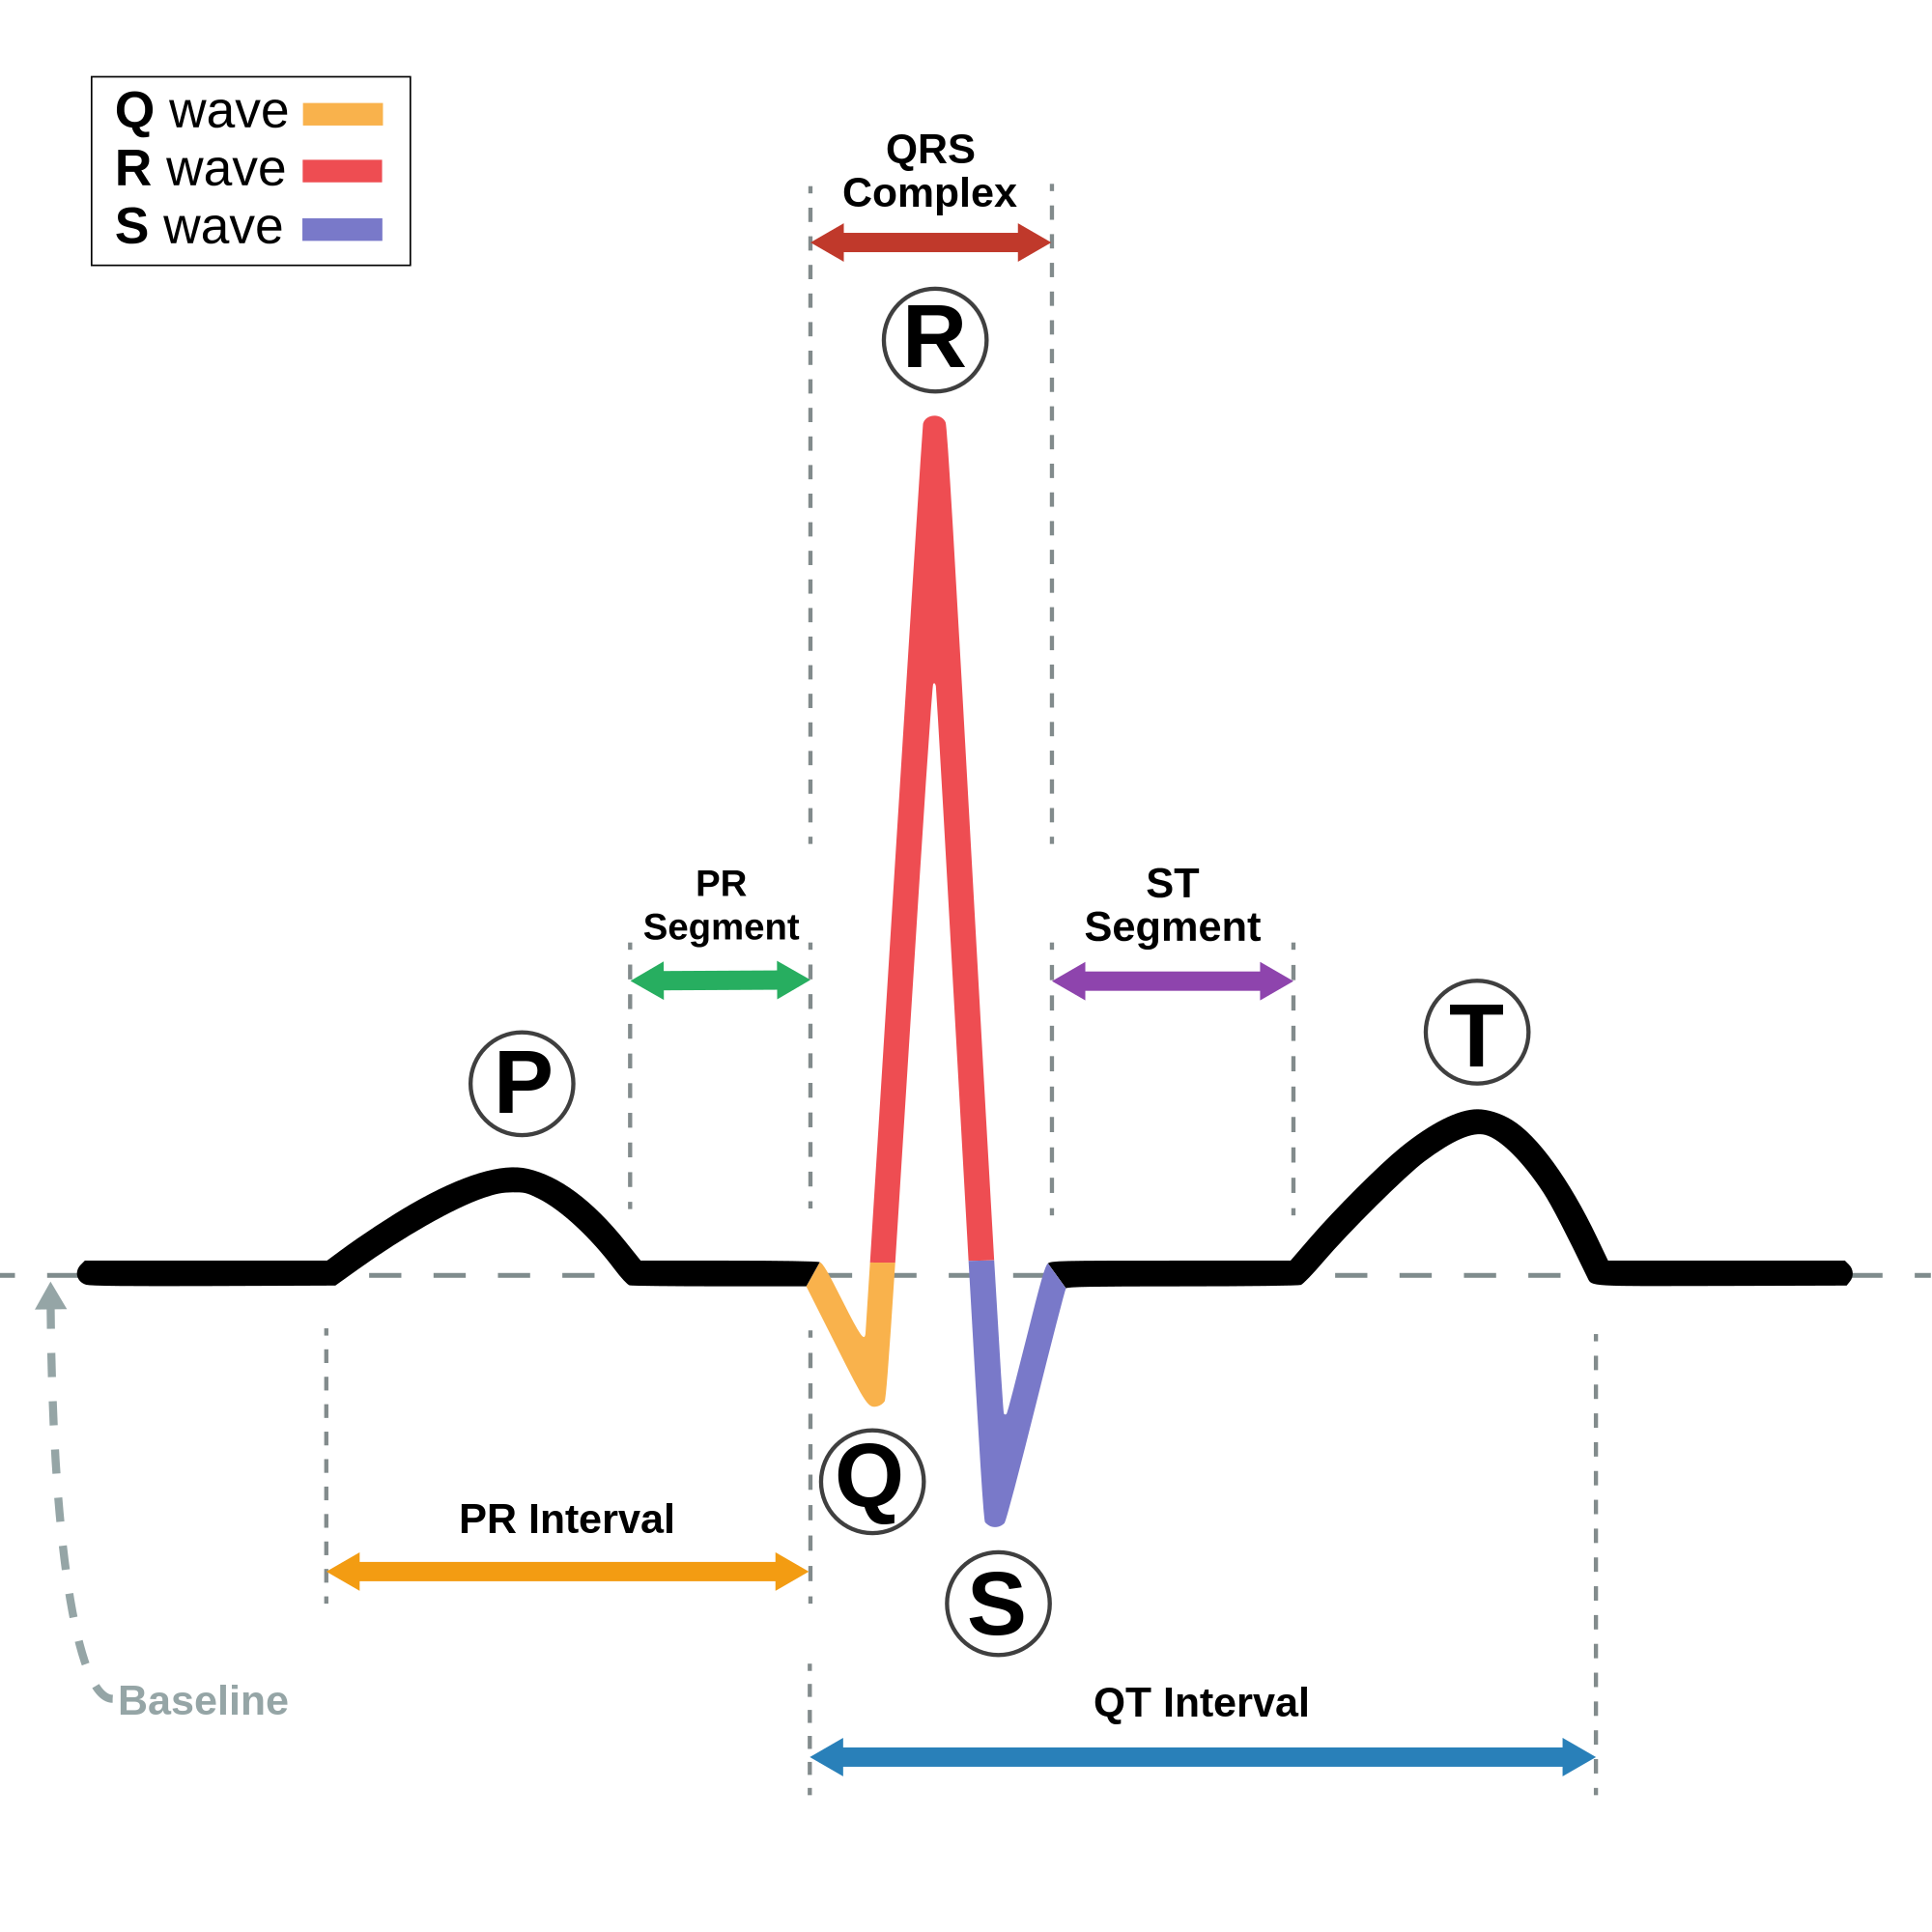
The QRS complex is the combination of three of the graphical deflections seen on a typical electrocardiogram (ECG or EKG). It is usually the central and most visually obvious part of the tracing. It corresponds to the depolarization of the right and left ventricles of the heart and contraction of the large ventricular muscles.

In adults, the QRS complex normally lasts 80 to 100 ms; in children it may be shorter. The Q, R, and S waves occur in rapid succession, do not all appear in all leads, and reflect a single event and thus are usually considered together. A Q wave is any downward deflection immediately following the P wave. An R wave follows as an upward deflection, and the S wave is any downward deflection after the R wave. The T wave follows the S wave, and in some cases, an additional U wave follows the T wave.

To measure the QRS interval start at the end of the PR interval (or beginning of the Q wave) to the end of the S wave. Normally this interval is 0.08 to 0.10 seconds. When the duration is longer it is considered a wide QRS complex.

Formation

[edit]

Depolarization of the heart ventricles occurs almost simultaneously, via the bundle of His and Purkinje fibers. If they are working efficiently, the QRS complex duration in adults is 80 to 110 ms.[citation needed]

Clinical significance

[edit]

Any abnormality of conduction takes longer and causes "widened" QRS complexes, sometimes called cardiac aberrancy. In bundle branch block, there can be an abnormal second upward deflection within the QRS complex. In this case, such a second upward deflection is referred to as R′ (pronounced "R prime"). This would be described as an RSR′ pattern.

Ventricles contain more muscle mass than the atria. Therefore, the QRS complex is considerably larger than the P wave. The QRS complex is often used to determine the axis of the electrocardiogram, although it is also possible to determine a separate P wave axis.

The duration, amplitude, and morphology of the QRS complex are useful in diagnosing cardiac arrhythmias, conduction abnormalities, ventricular hypertrophy, myocardial infarction, electrolyte derangements, and other disease states.

High frequency analysis of the QRS complex may be useful for detection of coronary artery disease during an exercise stress test.[1]

Components

[edit]
Schematic representation of the QRS complex.
Parameter Normal value Value comments Clinical significance
QRS duration 75 to 105 ms[2] Shorter in children[3] Prolonged duration could indicate hyperkalemia[4] or intraventricular conduction delay such as bundle branch block.
QRS amplitude Increased amplitude indicates cardiac hypertrophy
Ventricular
activation
time (VAT)
  • < 50 ms in V5 or V6[3]
  • < 30 ms in V1[3]
Measured in increased QRS amplitude[3]
Q wave
  • Duration up to 40 ms in leads other than III and aVR[5]
  • Amplitude less than 1/3 QRS amplitude[5] (R+S)
  • Amplitude less than 1/4 of R wave[5]
Abnormality indicates presence of infarction[5]
R wave
  • Left ventricle: lead V5 or V6 < 45 ms[6]
  • Right ventricle: lead V1 or V2 < 35 ms[6]
Large amplitude might indicate of left ventricular hypertrophy[7]

Duration longer than 45 ms might indicate left posterior fascicular block, LVH or LBBB.[8]

S wave Large amplitude might indicate of left ventricular hypertrophy[9]

Q wave

[edit]

Normal Q waves, when present, represent depolarization of the interventricular septum. For this reason, they are referred to as septal Q waves and can be appreciated in the lateral leads I, aVL, V5 and V6.

Pathologic Q waves occur when the electrical signal passes through stunned or scarred heart muscle; as such, they are usually markers of previous myocardial infarctions, with subsequent fibrosis. A pathologic Q wave is defined as having a deflection amplitude of 25% or more of the subsequent R wave, or being > 0.04 s (40 ms) in width and > 2 mm in amplitude. However, diagnosis requires the presence of this pattern in more than one corresponding lead.

R wave progression

[edit]

Looking at the precordial leads, the R wave usually progresses from showing an rS-type complex in V1 with an increasing R and a decreasing S wave when moving toward the left side. There is usually a qR-type of complex in V5 and V6, with the R-wave amplitude usually taller in V5 than in V6. It is normal to have a narrow QS and rSr' patterns in V1, and this is also the case for qRs and R patterns in V5 and V6. The transition zone is where the QRS complex changes from predominantly negative to predominantly positive (R/S ratio becoming >1), and this usually occurs at V3 or V4. It is normal to have the transition zone at V2 (called "early transition") and at V5 (called "delayed transition").[10] In biomedical engineering, the maximum amplitude in the R wave is usually called "R peak amplitude", or just "R peak".[11][12] Accurate R peak detection is essential in signal processing equipment for heart rate measurement and it is the main feature used for arrhythmia detection.[13][14]

The definition of poor R wave progression (PRWP) varies in the literature. It may be defined, for example, as R wave of less than 2–4 mm in leads V3 or V4 and/or presence of a reversed R wave progression, which is defined as R in V4 < R in V3 or R in V3 < R in V2 or R in V2 < R in V1, or any combination of these.[10] Poor R wave progression is commonly attributed to anterior myocardial infarction, but it may also be caused by left bundle branch block, Wolff–Parkinson–White syndrome, right and left ventricular hypertrophy, or a faulty ECG recording technique.[10]

R wave peak time

[edit]

R wave peak time (RWPT) represents the time from the onset of QRS complex to the peak of R wave, which is usually measured in aVL and V5 or V6 leads.[15]

R-peak time for right ventricle is measured from leads V1 or V2, where upper range of normal is 35 ms. R wave peak time for left ventricle is measured from lead V5 or V6 and 45 ms is the upper range of normal.[6] R wave peak time is considered to be prolonged if it's more than 45 ms.

J-point

[edit]

The point where the QRS complex meets the ST segment is the J-point. The J-point is easy to identify when the ST segment is horizontal and forms a sharp angle with the last part of the QRS complex. However, when the ST segment is sloped or the QRS complex is wide, the two features do not form a sharp angle and the location of the J-point is less clear. There is no consensus on the precise location of the J-point in these circumstances.[16] Two possible definitions are:

  • The "first point of inflection of the upstroke of the S wave"[16]
  • The point at which the ECG trace becomes more horizontal than vertical[17]

Terminology

[edit]
Various QRS complexes with nomenclature.

Not every QRS complex contains a Q wave, an R wave, and an S wave. By convention, any combination of these waves can be referred to as a QRS complex. However, correct interpretation of difficult ECGs requires exact labeling of the various waves. Some authors use lowercase and capital letters, depending on the relative size of each wave. For example, an Rs complex would be positively deflected, while an rS complex would be negatively deflected. If both complexes were labeled RS, it would be impossible to appreciate this distinction without viewing the actual ECG.

Monomorphic or polymorphic

[edit]

Monomorphic refers to all QRS waves in a single lead being similar in shape. Polymorphic means that the QRS change from complex to complex.[18] These terms are used in the description of ventricular tachycardia.

Algorithms

[edit]

A common algorithm used for QRS complex detection is the Pan-Tompkins[19] algorithm (or method); another is based on the Hilbert transform.[20][21][22][23] Numerous other algorithms have been proposed and investigated.[24] In recent research, heart beat detection methods based on visibility graphs have been introduced, enabling fast and sample-precise R-peak annotation even in noisy ECG.[25][26]

See also

[edit]

References

[edit]
Revisions and contributorsEdit on WikipediaRead on Wikipedia
from Grokipedia
The QRS complex is a key feature of the electrocardiogram (ECG), representing the electrical of the heart's ventricles that precedes their mechanical contraction. It typically consists of three sequential waves: the Q wave, an initial small negative deflection; the R wave, a prominent positive deflection; and the , a negative deflection following the R wave, though not all components may be visible in every ECG lead. The complex's morphology and timing reflect the synchronized activation of the ventricular myocardium via the His-Purkinje conduction system, originating from the bundle branches and . In a normal ECG, the QRS complex has a duration of 0.06 to 0.10 seconds (60–100 ms), signifying rapid and uniform ventricular conduction; prolongation beyond 0.12 seconds often indicates conduction delays such as bundle branch blocks or electrolyte imbalances. The and axis of the QRS vary by lead position, with the R wave generally tallest in leads overlying the left ventricle, aiding in the assessment of or . Abnormalities in the QRS, including widened complexes or fragmented patterns, are critical for diagnosing conditions like myocardial ischemia, cardiomyopathies, or ventricular arrhythmias, making it a cornerstone of .

Introduction

Definition

The QRS complex is the graphical representation of ventricular on an electrocardiogram (ECG), consisting of the Q wave (an initial small downward deflection), the R wave (a prominent upward deflection), and the (a subsequent downward deflection). This complex captures the rapid electrical activation of the ventricular myocardium during the onset of . Unlike the preceding , which reflects atrial , or the following , which signifies ventricular , the QRS complex specifically delineates the propagation of the electrical impulse through the ventricles via the His-Purkinje system. The nomenclature "QRS complex" originates from the labeling system introduced by Dutch physiologist in the early 1900s, who assigned sequential letters—P, Q, R, S, and T—to the deflections observed in ECG tracings recorded with his string galvanometer. The morphology of the QRS complex exhibits lead-specific variations due to the angular perspectives of the recording electrodes; in limb leads (I, II, III, aVR, aVL, aVF), amplitudes are generally lower and patterns more uniform, whereas precordial leads (V1–V6) display taller R waves with progressive transition from negative (QS or ) in V1 to predominantly positive ( or ) in V5–V6, reflecting the heart's anterior-posterior orientation.

Historical Context

The discovery of the QRS complex traces back to the early , when Dutch physiologist developed the string galvanometer, a pivotal instrument for recording electrical activity in the heart. In 1903, Einthoven published the first detailed human electrocardiograms using this device, identifying distinct deflections corresponding to atrial and ventricular activity; the prominent ventricular deflections, later termed the QRS complex, were initially described as part of the "ventricular complex" in tracings that built upon prior animal experiments. These recordings marked a significant advancement over earlier capillary electrometers, providing higher resolution and enabling the labeling of waves as P, Q, R, S, and T, with Q, R, and S representing the initial negative, positive, and subsequent negative or positive components of ventricular . Einthoven's contributions were recognized with the 1924 in Physiology or Medicine for "his discovery of the mechanism of the electrocardiogram," which solidified the foundation for clinical and the study of cardiac electrical events like the QRS complex. In the ensuing decades, researchers expanded on these findings; notably, British cardiologist Sir Thomas Lewis in the 1920s correlated QRS complex alterations with through systematic ECG analyses, demonstrating how increased or duration could indicate left or right ventricular enlargement in clinical cases. Lewis's work, including publications like Clinical Electrocardiography (1913, with updates in the 1920s), helped bridge experimental and bedside , emphasizing the QRS as a key indicator of ventricular pathology. The and interpretation of the QRS complex evolved through mid-20th-century efforts. Initially referred to broadly as the ventricular complex, the specific QRS terminology was part of Einthoven's PQRST system from its inception. Concurrently, the in 1954 issued recommendations for the of the 12-lead electrocardiogram, establishing protocols for lead placement and QRS assessment that enhanced across clinical settings and supported its integration into routine cardiac evaluation.

Physiology

Formation Mechanism

The formation of the QRS complex initiates as the electrical impulse from atrial reaches the atrioventricular (AV) node, where it is briefly delayed before rapid transmission through the penetrating and branching portions of the . From the , the impulse bifurcates into the left and right bundle branches, which course along the endocardial surface of the toward the apex of the heart. These branches connect to an extensive subendocardial network of , which fan out to deliver the activation wavefront synchronously to the ventricular myocardium, ensuring coordinated contraction of both ventricles. The vectorial spread of depolarization during QRS generation follows a specific sequence that determines the characteristic waveform observed on the electrocardiogram. Initial activation occurs in the , proceeding from left to right due to the left bundle branch's anterior position, which manifests as a small initial negativity (Q wave) in left-sided leads. This is followed by depolarization of the main left ventricular free wall, producing the dominant positive deflection (R wave) as the electrical vector points toward the left and inferior aspects of the heart. Completion of the process involves activation of the right ventricle and basal regions, resulting in a terminal negativity () in left-sided leads as the vector shifts rightward and superiorly. The time course of ventricular depolarization is remarkably rapid, primarily due to the high conduction velocity in the , which ranges from 2 to 3 m/s—significantly faster than the 0.3 to 0.4 m/s in working myocardial cells—leading to the sharp, brief deflections characteristic of the normal QRS complex. Delays anywhere along the His-Purkinje pathway can prolong this process, causing widening of the QRS. In three dimensions, ventricular activation propagates from the outward to the epicardium, facilitated by the Purkinje network's broad distribution that creates a nearly simultaneous across the inner ventricular surfaces. The left ventricle's greater myocardial mass dominates the net electrical vector, contributing to the overall amplitude and directionality of the QRS complex in standard leads.

Ionic and Cellular Basis

The QRS complex arises from the rapid of ventricular myocytes, primarily driven by phase 0 of the , where voltage-gated sodium channels (Nav1.5) open to allow a fast influx of Na⁺ ions, rapidly shifting the from negative to positive values around +30 mV. This influx, mediated by the SCN5A-encoded Nav1.5 channels, is responsible for the upstroke velocity of the action potential, enabling synchronized excitation across the ventricular myocardium that manifests as the QRS waveform on the electrocardiogram. The process is highly dependent on the channel's biophysical properties, including rapid activation and inactivation, which ensure efficient without prolonged Na⁺ entry. Propagation of this depolarization wave through the ventricular tissue relies on electrical coupling via gap junctions, predominantly formed by connexin 43 (Cx43), which permit direct intercellular flow of ions and small molecules, facilitating current spread between adjacent myocytes. Cx43 gap junctions are the primary connexin type in adult ventricular working myocardium, ensuring low-resistance pathways for action potential conduction and maintaining uniform wavefront progression. Disruptions in Cx43 expression or function can slow conduction, though partial reductions (e.g., 50% in heterozygous models) have only modest effects on velocity, highlighting the role of cellular geometry and resistivity as complementary factors. Conduction velocity varies regionally within the ventricles, with Purkinje cells exhibiting faster propagation due to a higher of Nav1.5 sodium channels compared to working myocardial cells, allowing quicker upstrokes and higher excitability. This elevated Na⁺ channel in supports their role in rapid distal distribution of the impulse, contrasting with the slower conduction in myocardial cells, which have lower channel expression and more myofibrils impeding current flow. Mutations in the gene, which encodes Nav1.5, are associated with conduction defects that prolong or distort the QRS complex by impairing Na⁺ current amplitude or kinetics, leading to slowed ventricular . These genetic variants, often loss-of-function, underlie conditions like progressive cardiac conduction disease and can manifest as widened QRS intervals due to reduced excitability in affected myocytes.

Normal Characteristics

Components

The QRS complex consists of three primary components: the Q wave, R wave, and , which together represent the of the ventricular myocardium. The Q wave is the initial downward deflection following the PR segment, arising from the early of the as the activation wavefront moves from left to right through the septum. In normal , this wave is typically small and brief, with a duration less than 0.04 seconds and an less than 25% of the subsequent R wave height. The R wave forms the main upward deflection of the QRS complex, primarily reflecting the of the main mass of the left ventricle as the electrical impulse spreads from to epicardium. This component is generated by the larger left ventricular forces overpowering those of the right ventricle during simultaneous activation. It appears as the tallest peak in the lateral precordial leads V5 and V6, where left ventricular forces are most prominently recorded. The is the downward deflection that follows the R wave, corresponding to the later phases of ventricular , particularly the activation of the basal portions of the right ventricle and the higher regions of the left ventricle. In normal ECGs, the S wave is most prominent in the right precordial leads V1 through V3, where right ventricular vectors dominate the recording. The J point marks the junction between the end of the QRS complex (specifically after the ) and the beginning of the , signifying the completion of ventricular and the onset of . In healthy individuals, this point lies at the baseline level, without or depression. R wave progression refers to the normal gradual increase in wave across the precordial leads from V1 to V6, reflecting the transition from right ventricular dominance in the septal leads to left ventricular dominance in the lateral leads. Small r waves typically emerge in V1 or V2 and progressively enlarge toward V5, where the R wave reaches its maximum height before slightly diminishing in V6.

Measurements and Norms

The QRS complex duration in healthy adults typically ranges from 60 to 100 milliseconds, with values exceeding 120 milliseconds considered abnormal. This measurement reflects the time for ventricular and is measured from the onset of the Q wave to the end of the across the 12-lead electrocardiogram (ECG). In pediatric populations, QRS duration is shorter, generally less than or equal to 90 milliseconds in children under 4 years and less than or equal to 100 milliseconds in those aged 4 to 16 years. Among athletes, QRS duration remains within similar normal ranges but may show slight prolongation with age and training intensity, with mean QRS durations reaching 98 milliseconds in older adolescents (17–18 years), without indicating . Sex differences are modest, with males exhibiting slightly longer durations (median 92 milliseconds) compared to females (median 84 milliseconds). QRS amplitude varies significantly by lead due to the heart's orientation and placement, with precordial leads showing higher voltages than limb leads. In healthy adults, the wave in lead V5 typically exceeds 10 millimeters, representing peak ventricular forces, while the Sokolow-Lyon index—calculated as the sum of the amplitude in V1 and the wave in V5 or V6—remains below 35 millimeters in non-hypertrophied hearts. These norms are established through standardized ECG to ensure measurement accuracy across analog and digital systems. The frontal plane QRS axis in adults normally falls between -30° and +90°, determined primarily from the limb leads I and aVF, where the vector aligns with positive deflections in these leads. This range accounts for typical leftward shifts with age and ensures alignment with physiological ventricular .

Abnormalities

Duration Abnormalities

The QRS duration is considered prolonged when it exceeds 120 ms, signifying delayed intraventricular conduction that can arise from structural, ionic, or rhythm-related factors. This prolongation disrupts the normal synchronous of the ventricles, often leading to characteristic ECG patterns depending on the underlying cause. Bundle branch blocks represent a major category of conduction delays causing QRS prolongation. In (RBBB), the QRS duration is ≥120 ms, accompanied by an RSR' pattern in leads V1-V2 due to delayed right ventricular activation. (LBBB) similarly features a QRS duration ≥120 ms, with broad, notched R waves in lateral leads (I, aVL, V5-V6) reflecting oppositional left and right ventricular . Incomplete forms of these blocks may show QRS durations between 100-120 ms, but full criteria require the longer threshold for diagnosis. Hyperkalemia contributes to QRS widening through impaired myocardial excitability and slowed conduction, with progressive elevation in serum potassium levels causing the QRS to broaden and potentially merge with the in a sine-wave pattern during severe episodes (typically >7 mmol/L). Ventricular rhythms, including premature ventricular contractions or , inherently produce prolonged QRS complexes exceeding 120 ms because they bypass the His-Purkinje system and activate the myocardium directly. In wide-complex tachycardias, a QRS duration >160 ms (particularly with morphology) strongly favors a ventricular origin over with aberrancy, as supraventricular impulses conducted through diseased bundles rarely exceed this width. Rate-dependent QRS prolongation occurs during rapid heart rates, where aberrant conduction temporarily widens the complex. The exemplifies this, typically in , where a beat following a short RR interval (after a longer one) exhibits RBBB-like aberrancy due to incomplete recovery of the right bundle branch refractory period. Abnormally shortened QRS duration (<60 ms) is uncommon and generally reflects accelerated ventricular activation, though it lacks well-defined common etiologies in standard electrocardiography; it may occasionally appear in contexts of enhanced conduction and warrants further investigation, as explored in studies on hypertrophic cardiomyopathy. Pre-excitation syndromes, such as Wolff-Parkinson-White (WPW), involve an accessory pathway that shortens the PR interval and adds a delta wave, but typically prolong the overall QRS (>110 ms) rather than shorten it. Hypercalcemia primarily shortens the via accelerated , with minimal direct impact on QRS duration.

Amplitude and Progression Abnormalities

Abnormalities in the of the QRS complex refer to deviations in the height of the R and S waves, which can indicate underlying cardiac or extracardiac conditions affecting electrical conduction or ventricular mass. These changes are typically assessed in the limb and precordial leads, where normal QRS amplitudes vary by lead position; for instance, R-wave progression normally increases from V1 to V5, reflecting left ventricular . Low QRS voltage is characterized by amplitudes less than 5 mm in all limb leads (I, II, III, aVR, aVL, aVF), often resulting from reduced electrical forces reaching the body surface. Common causes include , where fluid accumulation dampens transmission; , due to increased lung air volume attenuating signals; and , which increases tissue insulation between the heart and electrodes. Poor R-wave progression occurs when the R-wave amplitude fails to increase appropriately across the precordial leads, specifically defined as an R wave less than 3 mm in lead V3. This pattern suggests impaired anterior forces and is associated with anterior , , and (COPD), where hyperinflation displaces the heart. Tall R waves, particularly prominent in lateral leads like V5 or V6 (e.g., exceeding 26 mm), are indicative of increased left ventricular mass, as seen in (LVH), where thickened myocardium amplifies depolarization vectors. In contrast, tall R waves in right precordial leads (V1-V2) may signal posterior , reflecting reciprocal changes from injury in the posterior wall. QRS alternans, or beat-to-beat variation in QRS amplitude, arises from mechanical swinging of the heart within a fluid-filled pericardial space, classically in . This , often involving P and T waves as well, is a specific but insensitive marker requiring urgent echocardiographic confirmation.

Morphological Variants

Fragmented QRS (fQRS) complexes represent a morphological abnormality characterized by or slurring of the QRS , typically observed in two or more contiguous leads of a standard 12-lead electrocardiogram (ECG). This pattern arises from heterogeneous ventricular activation due to , most commonly in ischemic , where it serves as an electrocardiographic marker of conduction delays across fibrotic tissue. Integration of fQRS with the Selvester QRS scoring system enhances its utility in estimating infarct size and predicting arrhythmic risk, as the combined approach outperforms isolated fQRS or Q-wave analysis in detecting underlying scar tissue. In ventricular tachyarrhythmias, QRS morphology distinguishes monomorphic from polymorphic variants, with monomorphic (VT) featuring uniform QRS complexes of consistent shape and axis during sustained episodes, reflecting a reentrant circuit originating from a single ventricular site. In contrast, polymorphic VT exhibits beat-to-beat variations in QRS , duration, and axis, often indicating multiple wavefronts or dynamic instability. The Brugada criteria incorporate QRS morphology assessment—such as atrioventricular dissociation, fusion beats, and precordial concordance—to differentiate VT from with aberrancy, emphasizing the diagnostic value of versus variable QRS patterns in wide-complex tachycardias. The epsilon wave is a distinctive morphological variant appearing as a small, low-amplitude positive deflection immediately following the QRS complex, primarily in the right precordial leads (V1-V3). This finding reflects delayed right ventricular activation due to fibrofatty replacement of myocardium in , serving as a major diagnostic criterion under established guidelines. Its presence indicates localized conduction block in the right , contributing to the arrhythmogenic substrate in this inherited . As of 2025, (AI) algorithms have advanced the detection of subtle QRS morphological variants, such as micro-fragmentation or early notching, enabling non-invasive identification of prior to overt structural changes. These AI-driven tools analyze high-resolution ECG signals to quantify irregular QRS patterns linked to fibrotic remodeling, improving early risk stratification for ventricular arrhythmias in patients with ischemic or non-ischemic .

Clinical Applications

Diagnostic Significance

The QRS complex provides essential diagnostic clues for identifying through the presence of pathologic Q waves, which represent regions of myocardial necrosis unable to conduct electrical impulses. These Q waves are considered pathologic if they exceed 0.04 seconds in duration and have an amplitude greater than 25% of the corresponding R wave, typically appearing in at least two contiguous leads to confirm the diagnosis. The location of these waves aids in pinpointing the infarct site; for instance, pathologic Q waves in leads II, III, and aVF indicate inferior wall , while those in V1 through V4 suggest anterior involvement. According to the Fourth Universal Definition of , new pathologic Q waves contribute to diagnosing Type 1 MI when accompanied by a rise in cardiac indicating myocardial injury. For Type 5 (CABG-related) MI, new Q waves support the diagnosis if combined with a troponin elevation >20 × URL. This pattern recognition is particularly valuable in acute settings, where Q waves may evolve over hours to days post-infarction. In assessing left ventricular hypertrophy (LVH), QRS voltage criteria evaluate increased myocardial mass by measuring amplitudes in specific leads, with the Cornell index being a widely used gender-specific threshold for diagnosis. The index calculates the sum of the R wave amplitude in lead aVL and the in V3, deeming it positive for LVH if exceeding 28 mm in men or 20 mm in women, offering high specificity despite moderate sensitivity. This criterion outperforms some older methods in diverse populations by accounting for sex differences in cardiac anatomy and has been validated against echocardiographic findings in large cohorts. Elevated QRS voltages reflect the increased electrical forces from hypertrophied myocardium, often combined with to enhance diagnostic accuracy, though false positives can occur in younger individuals or athletes. Conduction defects, such as bundle branch blocks, are diagnosed via characteristic QRS morphologies that reflect delayed ventricular activation. Left bundle branch block (LBBB) is identified by a QRS duration of at least 120 ms, broad monophasic R waves in leads I, aVL, V5, and V6 (often notched or slurred), and the absence of Q waves in lateral leads, indicating asynchronous left ventricular depolarization. Right bundle branch block (RBBB), in contrast, features a QRS duration ≥120 ms with an rsR' or rSR' pattern in V1-V2 and wide S waves in I and V6, stemming from delayed right ventricular conduction. These patterns, standardized by the American Heart Association, distinguish complete blocks from incomplete variants and are critical for recognizing underlying structural heart disease. Electrolyte imbalances like manifest in QRS alterations due to impaired myocardial excitability from elevated extracellular . Progressive QRS widening, often appearing as intraventricular conduction delay, occurs at serum levels above 6.5 mEq/L and may culminate in a sine-wave pattern in severe cases (≥8.0 mEq/L), alongside tall peaked T waves. This widening results from slowed conduction velocity in ventricular myocytes, as detailed in electrophysiological reviews, and serves as a high-specificity marker for urgent intervention, though ECG sensitivity varies. Such changes underscore the QRS's role in detecting life-threatening metabolic disturbances affecting cardiac conduction. Psychological stress or anxiety does not cause significant or clinically meaningful changes in QRS axis or duration on ECG. Studies on acute mental stress show minor increases in QRS duration (from 97.69 ± 16.67 ms to 99.39 ± 17.34 ms) and shifts in QRS axis (from 64.57 ± 29.91° to 57.39 ± 37.80°), but these changes are statistically insignificant (p = 0.190 and p = 0.212, respectively). Research on perceived stress finds no significant association with QRS duration (r = 0.07, p = 0.42). Primary ECG effects of stress/anxiety include increased heart rate, altered PR/QT intervals, and repolarization abnormalities (e.g., T-wave changes and increased T-wave alternans), not QRS parameters. This clarifies that QRS abnormalities are unlikely attributable to stress and aids in differential diagnosis.

Prognostic and Therapeutic Implications

In patients with (HF), a prolonged QRS duration exceeding 130 ms is associated with increased all-cause mortality, with hazard ratios indicating a 1.5- to 2-fold elevated risk compared to those with narrower QRS complexes. Subgroup analyses from the Multicenter Automatic Defibrillator Implantation Trial II (MADIT-II) further demonstrated that QRS prolongation in this range predicts higher rates of ventricular tachyarrhythmias and overall mortality in ischemic populations. Similarly, the presence of fragmented QRS complexes, characterized by notching or slurring within the QRS, serves as an independent marker of and is linked to a of sudden cardiac death up to 2.2 times higher, particularly in patients with or . Therapeutically, QRS duration and morphology guide patient selection for (CRT) in HF with reduced . According to the 2022 AHA/ACC/HFSA guidelines, CRT is recommended (Class I) for symptomatic patients with () and QRS duration ≥150 ms, a Class IIa recommendation for LBBB with QRS 130-149 ms, and a Class IIb recommendation for non-LBBB with QRS ≥150 ms, as these features predict greater reverse remodeling and symptom improvement. For arrhythmia management, () implantation is indicated (Class I) in patients with structural heart disease who have experienced sustained polymorphic , as this morphology signals high risk for recurrent life-threatening events regardless of QRS specifics during . Recent investigations as of 2024 have highlighted the utility of QRS duration measured via wearable electrocardiogram (ECG) devices for early risk stratification of (), with prolonged QRS showing a of 1.03 (95% CI 1.01–1.05) per 10 ms increment for new-onset AF in population-based cohorts. These portable tools enable continuous monitoring, facilitating timely intervention in at-risk individuals before AF progression. Serial assessments of QRS changes post-myocardial provide insights into left , where progressive widening (e.g., ΔQRS >20 ms over 6 months) correlates with systolic dysfunction and adverse outcomes like hospitalization. Such dynamic monitoring aids in prognostic evaluation and guides decisions on adjunctive therapies to mitigate remodeling.

Analysis Methods

Manual Interpretation Techniques

Manual interpretation of the QRS complex begins with a systematic visual and measurement-based assessment of the electrocardiogram (ECG) tracing to evaluate ventricular . Clinicians typically start by identifying the QRS complex in all 12 leads, noting its onset as the earliest deflection from the baseline (beginning of the Q wave or initial R wave if no Q is present) and its offset as the return to baseline after the S wave (J point). This process relies on time-coherent multi-lead analysis to ensure accuracy, as single-lead measurements may underestimate or overestimate features. To measure QRS duration, handheld calipers are placed at the onset and offset points, spanning the widest complex across leads for a global value, typically expressed in milliseconds (each small box on standard ECG paper represents 40 ms). Normal QRS duration ranges from 60 to 100 ms, as detailed in the Measurements and Norms section. Axis assessment follows using the quadrant method: examine the net QRS deflection in leads I and aVF—if both are positive, the axis is normal (0° to +90°); positive I and negative aVF indicate left axis deviation (-30° to -90°); negative I and positive aVF suggest right axis deviation (+90° to +180°); and negative in both points to extreme right or northwest axis. For finer estimation, the Cabrera sequence (leads III, aVF, II, -aVR, I, aVL) aids in plotting the frontal plane vector. Precordial progression is evaluated by observing the R-wave amplitude increase from V1 (small r or QS) to V6 (tall R), confirming normal leftward and inferior progression of the activation vector. Tools essential for manual interpretation include for precise interval and measurements—spanning horizontal time units for duration and vertical millimeters for voltage (standard calibration: 10 mm/mV)—and sometimes a or axis for quick quadrant plotting. Amplitudes are assessed relative to the isoelectric line, noting any excessive or diminished voltages that may require verification. Lead synthesis integrates limb leads (frontal plane) with precordial leads (horizontal plane) to conceptualize a three-dimensional vectorcardiographic view of QRS , where limb leads provide the azimuthal direction and precordials the depth and anterior-posterior orientation. This holistic approach reveals discrepancies, such as discordant vectors suggesting conduction delays. Common pitfalls in manual QRS assessment include lead misplacement, particularly of precordial electrodes (e.g., V1/V2 shifted superiorly mimicking anterior by altering R-wave progression), and difficulty defining the J point in cases of unclear QRS-ST transition, which can lead to erroneous duration measurements. In , rapid rates exacerbate this issue, as overlapping complexes obscure the precise offset, potentially inflating QRS duration estimates by including early components. Variability in manual measurements can reach 10-20 ms, underscoring the need for multi-lead confirmation and standardized techniques.

Automated Algorithms and Tools

Automated algorithms for QRS complex detection have revolutionized ECG analysis by enabling real-time in clinical and settings, reducing reliance on manual interpretation while handling large datasets efficiently. These methods typically involve signal preprocessing, feature extraction, and logic to identify QRS onset, peak, and end with high precision, often outperforming traditional techniques in noisy environments. One of the seminal approaches is the Pan-Tompkins algorithm, introduced in , which employs bandpass filtering to isolate the QRS frequency band (5-15 Hz), followed by differentiation to emphasize the slope of the R wave and squaring to accentuate peaks. Adaptive thresholding then detects R peaks, with refractory period checks to avoid false positives from T waves or artifacts; this threshold-based method achieves detection sensitivities above 99% on standard ECG databases like MIT-BIH. Its robustness stems from digital analysis of slope, amplitude, and width, making it a cornerstone for real-time QRS detection in embedded systems. Wavelet transforms offer an advanced alternative, particularly suited for noise reduction and multiresolution feature extraction in ambulatory monitoring where motion artifacts prevail. By decomposing the ECG signal into time-frequency components using mother wavelets like Mexican hat or Daubechies, these methods enhance QRS delineation while suppressing baseline wander and high-frequency noise; for instance, dyadic wavelet transforms enable robust detection across varying morphologies with sensitivities exceeding 99.3% in low-signal-to-noise ratio conditions. This technique excels in non-stationary signals, providing scalable analysis for long-term recordings without excessive computational overhead. Recent AI advancements, as of 2025, leverage models such as convolutional neural networks (CNNs) for end-to-end QRS segmentation, directly learning hierarchical features from raw ECG data to achieve accuracies over 99% even in severely noisy signals. For example, residual architectures and hybrid CNN-LSTM models have demonstrated positive predictivity up to 99.8% on benchmark datasets with added , surpassing classical methods by adapting to patient-specific variations without manual . These models, trained on diverse corpora like PTB-XL, facilitate precise boundary detection for clinical grading of QRS duration and morphology. In practical applications, these algorithms power automated analysis, where 24-48 hour recordings are processed to quantify QRS metrics and flag arrhythmias with minimal clinician oversight, improving throughput in clinics. Similarly, wearable ECG devices like the integrate CNN-based detection for on-device QRS validation, with clinical studies reporting 98.3% sensitivity and 99.6% specificity for rhythm irregularities dependent on accurate QRS identification, enabling proactive screening in everyday use.

References

Add your contribution
Related Hubs
User Avatar
No comments yet.