Structured analysis
View on Wikipedia
In software engineering, structured analysis (SA) and structured design (SD) are methods for analyzing business requirements and developing specifications for converting practices into computer programs, hardware configurations, and related manual procedures.
Structured analysis and design techniques are fundamental tools of systems analysis. They developed from classical systems analysis of the 1960s and 1970s.[2]
Objectives of structured analysis
[edit]Structured analysis became popular in the 1980s and is still in use today. [citation needed] Structured analysis consists of interpreting the system concept (or real world situations) into data and control terminology represented by data flow diagrams. The flow of data and control from bubble to the data store to bubble can be difficult to track and the number of bubbles can increase.
One approach is to first define events from the outside world that require the system to react, then assign a bubble to that event. Bubbles that need to interact are then connected until the system is defined. Bubbles are usually grouped into higher level bubbles to decrease complexity. Data dictionaries are needed to describe the data and command flows, and a process specification is needed to capture the transaction/transformation information.[3]
SA and SD are displayed with structure charts, data flow diagrams and data model diagrams, of which there were many variations, including those developed by Tom DeMarco, Ken Orr, Larry Constantine, Vaughn Frick, Ed Yourdon, Steven Ward, Peter Chen, and others.
These techniques were combined in various published system development methodologies, including structured systems analysis and design method, profitable information by design (PRIDE), Nastec structured analysis & design, SDM/70 and the Spectrum structured system development methodology.
History
[edit]Structured analysis is part of a series of structured methods that represent a collection of analysis, design, and programming techniques that were developed in response to the problems facing the software world from the 1960s to the 1980s. In this timeframe most commercial programming was done in Cobol and Fortran, then C and BASIC. There was little guidance on "good" design and programming techniques, and there were no standard techniques for documenting requirements and designs. Systems were getting larger and more complex, and the information system development became harder and harder to do so."[4]
As a way to help manage large and complex software, the following structured methods emerged since the end of the 1960s:[4]
- Structured programming in circa 1967 with Edsger Dijkstra - "Go To Statement Considered Harmful"
- Niklaus Wirth Stepwise design in 1971
- Nassi–Shneiderman diagram in 1972
- Warnier/Orr diagram in 1974 - "Logical Construction of Programs"
- HIPO in 1974 - IBM Hierarchy input-process-output (though this should really be output-input-process)
- Structured design around 1975 with Larry Constantine, Ed Yourdon and Wayne Stevens.[5][6]
- Jackson structured programming in circa 1975 developed by Michael A. Jackson
- Structured analysis in circa 1978 with Tom DeMarco, Edward Yourdon, Gane & Sarson, McMenamin & Palmer.
- Structured analysis and design technique (SADT) developed by Douglas T. Ross
- Yourdon structured method developed by Edward Yourdon.
- Structured analysis and system specification published in 1978 by Tom DeMarco.
- Structured systems analysis and design method (SSADM) first presented in 1983 developed by the UK Office of Government Commerce.
- Essential Systems Analysis, proposed by Stephen M. McMenamin and John F. Palmer[7]
- IDEF0 based on SADT, developed by Douglas T. Ross in 1985.[8]
- Hatley-Pirbhai modeling, defined in "Strategies for Real-Time System Specification" by Derek J. Hatley and Imtiaz A. Pirbhai in 1988.
- Modern Structured Analysis, developed by Edward Yourdon, after Essential System Analysis was published, and published in 1989.[9]
- Information technology engineering in circa 1990 with Finkelstein and popularised by James Martin.
According to Hay (1999) "information engineering was a logical extension of the structured techniques that were developed during the 1970s. Structured programming led to structured design, which in turn led to structured systems analysis. These techniques were characterized by their use of diagrams: structure charts for structured design, and data flow diagrams for structured analysis, both to aid in communication between users and developers, and to improve the analyst's and the designer's discipline. During the 1980s, tools began to appear which both automated the drawing of the diagrams, and kept track of the things drawn in a data dictionary".[10] After the example of computer-aided design and computer-aided manufacturing (CAD/CAM), the use of these tools was named computer-aided software engineering (CASE).
Structured analysis topics
[edit]Single abstraction mechanism
[edit]
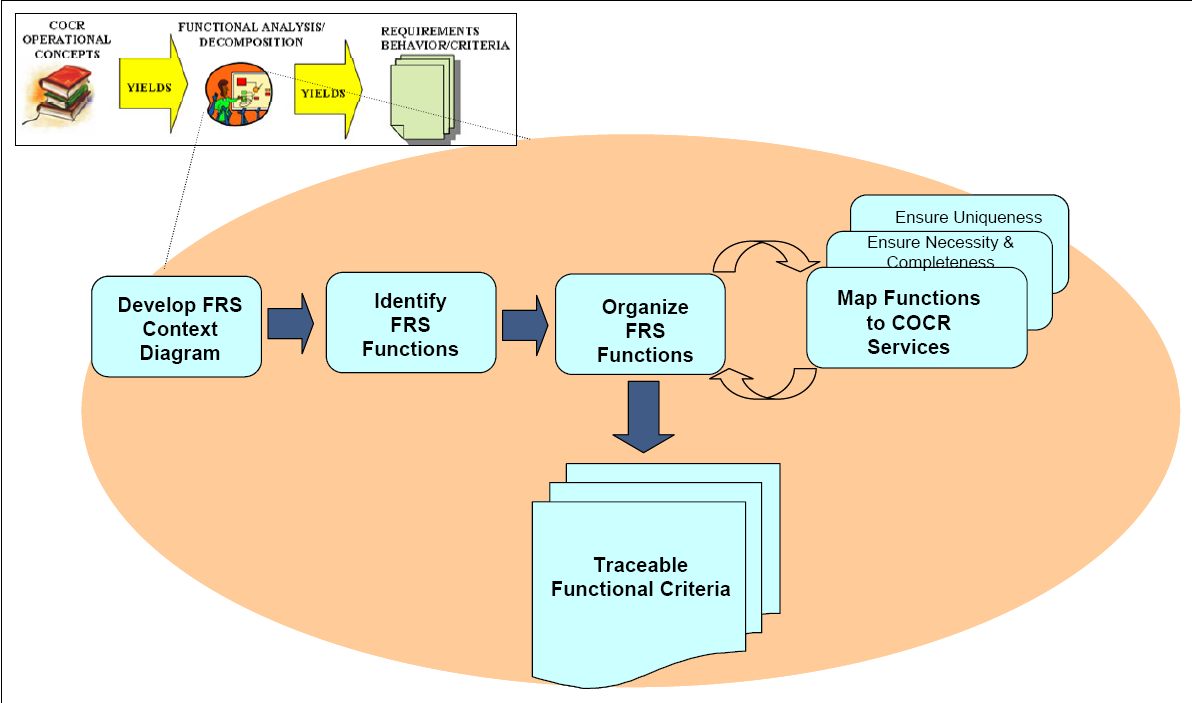
Structured analysis typically creates a hierarchy employing a single abstraction mechanism. The structured analysis method can employ IDEF (see figure), is process driven, and starts with a purpose and a viewpoint. This method identifies the overall function and iteratively divides functions into smaller functions, preserving inputs, outputs, controls, and mechanisms necessary to optimize processes. Also known as a functional decomposition approach, it focuses on cohesion within functions and coupling between functions leading to structured data.[11]
The functional decomposition of the structured method describes the process without delineating system behavior and dictates system structure in the form of required functions. The method identifies inputs and outputs as related to the activities. One reason for the popularity of structured analysis is its intuitive ability to communicate high-level processes and concepts, whether in single system or enterprise levels. Discovering how objects might support functions for commercially prevalent object-oriented development is unclear. In contrast to IDEF, the UML is interface driven with multiple abstraction mechanisms useful in describing service-oriented architectures (SOAs).[11]
Approach
[edit]Structured analysis views a system from the perspective of the data flowing through it. The function of the system is described by processes that transform the data flows. Structured analysis takes advantage of information hiding through successive decomposition (or top down) analysis. This allows attention to be focused on pertinent details and avoids confusion from looking at irrelevant details. As the level of detail increases, the breadth of information is reduced. The result of structured analysis is a set of related graphical diagrams, process descriptions, and data definitions. They describe the transformations that need to take place and the data required to meet a system's functional requirements.[12]

De Marco's approach[13] consists of the following objects (see figure):[12]
- Context diagram
- Data flow diagram
- Process specifications
- Data dictionary
Hereby the data flow diagrams (DFDs) are directed graphs. The arcs represent data, and the nodes (circles or bubbles) represent processes that transform the data. A process can be further decomposed to a more detailed DFD which shows the subprocesses and data flows within it. The subprocesses can in turn be decomposed further with another set of DFDs until their functions can be easily understood. Functional primitives are processes which do not need to be decomposed further. Functional primitives are described by a process specification (or mini-spec). The process specification can consist of pseudo-code, flowcharts, or structured English. The DFDs model the structure of the system as a network of interconnected processes composed of functional primitives. The data dictionary is a set of entries (definitions) of data flows, data elements, files, and databases. The data dictionary entries are partitioned in a top-down manner. They can be referenced in other data dictionary entries and in data flow diagrams.[12]
Context diagram
[edit].svg)
Context diagrams are diagrams that represent the actors outside a system that could interact with that system.[15] This diagram is the highest level view of a system, similar to block diagram, showing a, possibly software-based, system as a whole and its inputs and outputs from/to external factors.
This type of diagram according to Kossiakoff (2003) usually "pictures the system at the center, with no details of its interior structure, surrounded by all its interacting systems, environment and activities. The objective of a system context diagram is to focus attention on external factors and events that should be considered in developing a complete set of system requirements and constraints".[15] System context diagrams are related to data flow diagram, and show the interactions between a system and other actors which the system is designed to face. System context diagrams can be helpful in understanding the context in which the system will be part of software engineering.
Data dictionary
[edit]
A data dictionary or database dictionary is a file that defines the basic organization of a database.[16] A database dictionary contains a list of all files in the database, the number of records in each file, and the names and types of each data field. Most database management systems keep the data dictionary hidden from users to prevent them from accidentally destroying its contents. Data dictionaries do not contain any actual data from the database, only bookkeeping information for managing it. Without a data dictionary, however, a database management system cannot access data from the database.[16]
Database users and application developers can benefit from an authoritative data dictionary document that catalogs the organization, contents, and conventions of one or more databases.[17] This typically includes the names and descriptions of various tables and fields in each database, plus additional details, like the type and length of each data element. There is no universal standard as to the level of detail in such a document, but it is primarily a distillation of metadata about database structure, not the data itself. A data dictionary document also may include further information describing how data elements are encoded. One of the advantages of well-designed data dictionary documentation is that it helps to establish consistency throughout a complex database, or across a large collection of federated databases.[18]
Data flow diagrams
[edit]
A data flow diagram (DFD) is a graphical representation of the "flow" of data through an information system. It differs from the system flowchart as it shows the flow of data through processes instead of computer hardware. Data flow diagrams were invented by Larry Constantine, developer of structured design, based on Martin and Estrin's "data flow graph" model of computation.[20]
It is common practice to draw a system context diagram first which shows the interaction between the system and outside entities. The DFD is designed to show how a system is divided into smaller portions and to highlight the flow of data between those parts. This context-level data flow diagram is then "exploded" to show more detail of the system being modeled.
Data flow diagrams (DFDs) are one of the three essential perspectives of structured systems analysis and design method (SSADM). The sponsor of a project and the end users will need to be briefed and consulted throughout all stages of a system's evolution. With a data flow diagram, users are able to visualize how the system will operate, what the system will accomplish, and how the system will be implemented. The old system's data flow diagrams can be drawn up and compared with the new system's data flow diagrams to draw comparisons to implement a more efficient system. Data flow diagrams can be used to provide the end user with a physical idea of where the data they input ultimately has an effect upon the structure of the whole system from order to dispatch to recook. How any system is developed can be determined through a data flow diagram.
Structure chart
[edit]
A structure chart (SC) is a chart that shows the breakdown of the configuration system to the lowest manageable levels.[21] This chart is used in structured programming to arrange the program modules in a tree structure. Each module is represented by a box which contains the name of the modules. The tree structure visualizes the relationships between the modules.[22]
Structure charts are used in structured analysis to specify the high-level design, or architecture, of a computer program. As a design tool, they aid the programmer in dividing and conquering a large software problem, that is, recursively breaking a problem down into parts that are small enough to be understood by a human brain. The process is called top-down design, or functional decomposition. Programmers use a structure chart to build a program in a manner similar to how an architect uses a blueprint to build a house. In the design stage, the chart is drawn and used as a way for the client and the various software designers to communicate. During the actual building of the program (implementation), the chart is continually referred to as the master-plan.[23]
Structured design
[edit]Structured design (SD) is concerned with the development of modules and the synthesis of these modules in a so-called "module hierarchy".[24] In order to design optimal module structure and interfaces two principles are crucial:
- Cohesion which is "concerned with the grouping of functionally related processes into a particular module",[12] and
- Coupling relates to "the flow of information or parameters passed between modules. Optimal coupling reduces the interfaces of modules and the resulting complexity of the software".[12]
Structured design was developed by Larry Constantine in the late 1960s, then refined and published with collaborators in the 1970s;[5][6] see Larry Constantine: structured design for details. Page-Jones (1980) has proposed his own approach which consists of three main objects :
- structure charts
- module specifications
- data dictionary.
The structure chart aims to show "the module hierarchy or calling sequence relationship of modules. There is a module specification for each module shown on the structure chart. The module specifications can be composed of pseudo-code or a program design language. The data dictionary is like that of structured analysis. At this stage in the software development lifecycle, after analysis and design have been performed, it is possible to automatically generate data type declarations",[25] and procedure or subroutine templates.[12]
Criticisms
[edit]Problems with data flow diagrams have included the following:[3]
- Choosing bubbles appropriately
- Partitioning bubbles in a meaningful and mutually agreed upon manner,
- Documentation size needed to understand the Data Flows,
- Data flow diagrams are strongly functional in nature and thus subject to frequent change
- Though "data" flow is emphasized, "data" modeling is not, so there is little understanding the subject matter of the system
- Customers have difficulty following how the concept is mapped into data flows and bubbles
- Designers must shift the DFD organization into an implementable format
See also
[edit]References
[edit]- ^ Tricia Gilbert (2006) FCS Evaluation criterea for technology assessment Archived 2008-09-18 at the Wayback Machine
- ^ Edward Yourdon (1986). Managing the Structured Techniques: Strategies for Software Development in the 1990s. Yourdon Press. p.35.
- ^ a b FAA (2000). FAA System Safety Handbook, Appendix D. December 30, 2000.
- ^ a b Dave Levitt (2000). "Introduction to Structured Analysis and Design." at faculty.inverhills.edu/dlevitt. Retrieved 21 Sep 2008. No longer online 2017.
- ^ a b Stevens, Myers & Constantine 1974.
- ^ a b Yourdon & Constantine 1979.
- ^ McMenamin, Stephen M.; Palmer, John F. (1984). Essential Systems Analysis. Yourdon Press. ISBN 978-0-13-287905-7.
- ^ Gavriel Salvendy (2001). Handbook of Industrial Engineering: Technology and Operations Management.. p.508.
- ^ Yourdon, Edward (1989). Modern Structured Analysis. Prentice-Hall. ISBN 978-0-13-598632-5.
- ^ David C. Hay (1999) Achieving buzzword compliance in Object orientation Archived 2008-10-20 at the Wayback Machine Essential Strategies, Inc.
- ^ a b c DoD Architecture Framework Working Group (2003). DoDAF 1.5 Volume 2, 15 August 2003.
- ^ a b c d e f g Alan Hecht and Andy Simmons (1986) Integrating Automated Structured Analysis and Design with Ada Programming Support Environments NASA 1986.
- ^ Tom DeMarco (1978). Structured Analysis and System Specification. Yourdon Press, New York, 1978.
- ^ NDE Project Management Archived 2008-11-07 at the Wayback Machine (NPOESS) Data Exploitation web site. 2008.
- ^ a b Alexander Kossiakoff, William N. Sweet (2003). Systems Engineering: Principles and Practices p. 413.
- ^ a b c Data Integration Glossary Archived 2012-02-18 at the Wayback Machine, U.S. Department of Transportation, August 2001.
- ^ TechTarget, SearchSOA, What is a data dictionary?
- ^ AHIMA Practice Brief, Guidelines for Developing a Data Dictionary, Journal of AHIMA 77, no.2 (February 2006): 64A-D.
- ^ John Azzolini (2000). Introduction to Systems Engineering Practices. July 2000.
- ^ W. Stevens, G. Myers, L. Constantine, "Structured Design", IBM Systems Journal, 13 (2), 115-139, 1974.
- ^ a b "Configuration Management" In: IRS Resources Part 2. Information Technology Chapter 27. Configuration Management. Accessed 14 Nov 2008.
- ^ James Martin, Carma L. McClure (1988). Structured Techniques: The Basis for Case. Prentice Hall. p.56.
- ^ David Wolber "Structure Charts Archived 2009-02-19 at the Wayback Machine: Supplementary Notes Structure Charts and Bottom-up Implementation: Java Version.
- ^ Page-Jones 1980.
- ^ Belkhouche, B., and J.E. Urban. (1986). "Direct Implementation of Abstract Data Types from Abstract Specifications". In: IEEE Transactions on Software Engineering pp. 549-661, May 1986.
Further reading
[edit]- Stevens, W. P.; Myers, G. J.; Constantine, L. L. (June 1974). "Structured design". IBM Systems Journal. 13 (2): 115–139. doi:10.1147/sj.132.0115.
- Yourdon, Edward; Constantine, Larry L. (1979) [1975]. Structured Design: Fundamentals of a Discipline of Computer Program and Systems Design. Yourdon Press. ISBN 0-13-854471-9.
- Tom DeMarco (1978). Structured Analysis and System Specification. Yourdon. ISBN 0-91-707207-3
- Page-Jones, M (1980), The Practical Guide to Structured Systems Design, New York: Yourdon Press
- Derek J. Hatley, Imtiaz A. Pirbhai (1988). Strategies for Real Time System Specification. John Wiley and Sons Ltd. ISBN 0-932633-04-8
- Stephen J. Mellor und Paul T. Ward (1986). Structured Development for Real-Time Systems: Implementation Modeling Techniques: 003. Prentice Hall. ISBN 0-13-854803-X
- Edward Yourdon (1989). Modern Structured Analysis, Yourdon Press Computing Series, 1989, ISBN 0-13-598624-9
- Keith Edwards (1993). Real-Time Structured Methods, System Analysis. Wiley. ISBN 0-471-93415-1
External links
[edit]- Structured Analysis Wiki
- Three views of structured analysis CRaG Systems, 2004.
Structured analysis
View on GrokipediaIntroduction
Definition and Scope
Structured analysis (SA) is a software engineering methodology developed to analyze and specify the functional requirements of complex systems by decomposing them into manageable components using graphical and textual models. It emphasizes modeling the logical behavior of a system—focusing on what the system does rather than how it is implemented—through techniques that represent processes, data transformations, and interactions with external entities. This approach enables analysts to translate business needs into precise specifications for software, hardware, and manual operations, ensuring clarity and reducing ambiguity in system development.[5][6] The scope of structured analysis centers on functional decomposition, where the overall system is broken down hierarchically into subprocesses, data flows, and interacting entities, prioritizing a data-centric view over object-oriented paradigms. It employs tools like data flow diagrams to illustrate how data moves and is processed within the system, alongside entity-relationship models for data structures, without delving into physical implementation details such as programming languages or hardware configurations. This methodology is particularly suited for information systems in procedural environments, addressing the challenges of managing complexity in early computing paradigms by promoting modular, top-down refinement.[5][3] A key characteristic of SA is its use of hierarchical diagrams to depict system behavior at varying levels of detail, allowing analysts to start with a high-level overview and progressively refine it without introducing implementation biases. Originating in the context of procedural programming languages like COBOL and Fortran, SA was designed to tame the intricacies of large-scale, sequential codebases by enforcing structured representations of functionality and data movement. For instance, in modeling a simple order processing system, SA would identify core processes such as order receipt, inventory verification, and invoice generation, mapping the flow of customer data and product information between them to highlight dependencies and ensure comprehensive requirement coverage.[5][7][8]Objectives and Benefits
Structured analysis aims to model system functions and data flows in a clear, graphical manner to produce precise requirements specifications that serve as a foundation for subsequent design and implementation phases. By decomposing complex systems into hierarchical components, it enables analysts to capture the essential logic of information processing without delving into implementation details, thereby focusing on what the system must accomplish using an idealized "perfect technology." This objective aligns closely with early project phases, such as feasibility studies and requirements gathering, where initial models help validate user needs and assess project viability before committing resources.[1][9] A primary goal of structured analysis is to facilitate effective communication among analysts, end-users, and developers by providing intuitive visual representations that transcend technical jargon. These models reduce ambiguity in describing system behaviors and interactions, allowing non-technical stakeholders to grasp the overall system logic and contribute feedback iteratively. For instance, during requirements elicitation, graphical depictions of data movements and processes enable users to identify omissions or errors, fostering a shared understanding that minimizes misinterpretations.[10][9] The benefits of structured analysis include enhanced traceability from high-level requirements to detailed designs, achieved through modular decomposition that links functions across abstraction levels. This modularity supports easier maintenance, as changes to one component can be isolated without affecting the entire system, and promotes reusability of process models in similar projects. Graphical representations further aid validation by allowing systematic reviews and simulations, which have historically contributed to productivity gains of up to 20% during development in large-scale endeavors by facilitating early error detection. Additionally, it empowers non-technical users to engage meaningfully, improving project acceptance and long-term system adaptability.[1][10]Historical Development
Origins and Early Influences
Structured analysis emerged in the 1970s as a response to the software crisis, characterized by escalating complexity in developing large-scale batch-processing systems programmed in languages such as COBOL, Fortran, and BASIC, which often resulted in projects exceeding budgets by 2.5 to 4 times, chronic delays, and high error rates.[11] These challenges were exacerbated by the lack of systematic approaches to managing software growth, leading to unreliable systems in critical applications like operating systems (e.g., IBM's OS/360, which required over 5,000 person-years and involved 1,043 modules).[11] The crisis underscored the need for disciplined methods to decompose and model system functions, moving beyond ad hoc programming practices prevalent in the era's data processing environments.[12] Foundational contributions included Douglas T. Ross and Kenneth E. Schoman's 1977 IEEE paper introducing structured analysis for requirements definition.[3] A pivotal event was the 1968 NATO Software Engineering Conference in Garmisch, Germany, which brought together experts to address the crisis and explicitly called for structured methods to enhance design, modularity, and reliability in software development.[11] The conference highlighted issues like exponential error growth with system size and advocated for hierarchical decomposition and top-down approaches to mitigate risks in complex projects, influencing the foundational principles of structured analysis.[11] It emphasized the separation of concerns in system design, drawing attention to the inadequacies of existing tools and the urgency for formalized engineering practices.[11] Key influences on structured analysis stemmed from systems analysis practices in operations research, which provided techniques for modeling logical flows and optimizing administrative functions in large-scale systems.[13] Additionally, early work on functional decomposition was inspired by mathematical hierarchies, enabling the breakdown of complex systems into simpler, hierarchical components to improve manageability and analysis.[14] Pioneering figures included Ken Orr, who developed Data Structured Systems Development (DSSD) in the late 1970s and contributed to the Warnier-Orr diagramming technique in the early 1980s, building on Jean-Dominique Warnier's 1976 work; these emphasized rigorous documentation and output-oriented structuring, laying groundwork for data-centric approaches in software systems.[15] Peter Chen's entity-relationship model, introduced in 1976, served as a precursor to the data modeling aspects of structured analysis by providing a semantic framework for representing real-world entities and relationships in database design.[16] Initial publications on data-oriented analysis appeared in the early 1970s, building on these foundations to promote structured techniques for capturing system requirements and flows, such as Orr's early works on DSSD that integrated decomposition with information modeling.[7] These efforts marked the transition from crisis-driven improvisation to methodical analysis, prioritizing a single abstraction mechanism derived from hierarchical principles to simplify system understanding.[7]Evolution in the 1970s and 1980s
In the 1970s, structured analysis advanced significantly through the development of core tools such as data flow diagrams (DFDs), invented by Larry Constantine in the mid-1970s and popularized by Tom DeMarco in structured analysis, with Ed Yourdon and Constantine further developing them in their 1979 seminal work Structured Design. These diagrams provided a graphical means to model data movement and system processes, enabling analysts to decompose complex systems into manageable components without focusing on implementation details. Concurrently, structured walkthroughs emerged as a key validation technique, formalized by Edward Yourdon in 1979 as a peer review process to identify defects early in the specification phase, thereby enhancing the reliability of analysis artifacts. These innovations built on earlier systems thinking, standardizing practices for requirements elicitation in an era of growing software complexity. A notable milestone was the evolution of variants like the Structured Analysis and Design Technique (SADT), developed by Douglas T. Ross in the mid-1970s at SofTech, Inc., which emphasized hierarchical functional modeling with inputs, outputs, controls, and mechanisms to represent system behavior more rigorously. SADT gained traction in government projects, particularly through its adoption in the U.S. Air Force's Integrated Computer-Aided Manufacturing (ICAM) program during the late 1970s, where it supported the creation of standardized modeling methods like IDEF0 for defense systems engineering. Key publications further propelled these advancements, including Tom DeMarco's Structured Analysis and System Specification (1978), which outlined a comprehensive framework for functional decomposition and specification using DFDs and data dictionaries, influencing widespread training and application in both academic and professional settings. By the 1980s, structured analysis reached peak popularity, integrating with Computer-Aided Software Engineering (CASE) tools that automated diagramming and consistency checks, such as early systems like Excelerator and LBMS Tools, which streamlined the creation of DFDs and entity-relationship models. This era also saw linkages to information engineering methodologies, pioneered by Clive Finkelstein, where structured analysis techniques were adapted to emphasize data-driven enterprise modeling, facilitating top-down planning for large-scale information systems in corporate environments. For real-time extensions, figures like Vaughn Frick contributed to second-generation adaptations, building on Yourdon-DeMarco foundations to address dynamic behaviors in embedded systems, as seen in enhancements for control flow and timing analysis. Adoption expanded into corporate projects, with methodologies like SADT and Yourdon's approach applied in major initiatives at firms such as IBM and General Electric, reducing development errors and improving project predictability across industries.Decline and Legacy
By the 1990s, structured analysis began to wane as object-oriented paradigms gained prominence, offering greater modularity and encapsulation that better addressed the complexities of evolving software systems.[17] This shift was driven by the limitations of structured analysis's functional decomposition, which struggled with inheritance and polymorphism in object-oriented languages like C++ and Java.[18] Additionally, its rigid, sequential nature exposed shortcomings in agile and rapid development environments, where changing requirements demanded iterative flexibility rather than exhaustive upfront documentation.[19] Waterfall-based structured methods like structured analysis often resulted in delayed feedback and higher failure rates—up to 30% compared to agile's 10%—making them less suitable for dynamic projects.[19] In the post-1980s period, structured analysis transitioned into integrated methodologies such as the Structured Systems Analysis and Design Method (SSADM) in the UK, developed by the Central Computer and Telecommunications Agency (CCTA) starting in 1981 and mandated for government projects by 1983.[7] SSADM extended structured analysis by incorporating logical data modeling, entity-relationship diagrams, and a phased approach to analysis and design, aiming to standardize information system development while addressing inconsistencies in earlier structured techniques.[7] Version 4 of SSADM, released in 1990, further refined these elements for broader application, though it retained the waterfall structure that later contributed to its own decline in favor of more adaptive methods.[7] The legacy of structured analysis endures in foundational elements of modern modeling languages and standards. Its data flow diagrams directly influenced UML activity diagrams, which extend control and object flows to represent process sequencing in object-oriented contexts, providing a bridge for maintaining legacy systems built with structured techniques.[20] Similarly, structured analysis's emphasis on process modeling contributed to the development of Business Process Model and Notation (BPMN), which became a standard in 2004.[17] In requirements engineering, it shaped standards like IEEE 830-1998, which recommends structured formats for software requirements specifications, including functional and non-functional details derived from data and process analyses. Contemporary applications reflect structured analysis's adaptability in niche domains. It persists in legacy system maintenance, where data flow diagrams aid in reverse engineering and understanding outdated architectures without full redesign.[20] In embedded systems, real-time structured analysis integrates with hardware description languages like VHDL for specifying behavioral logic in ASIC design, ensuring reliable control flows in resource-constrained environments.[21] Tools like Enterprise Architect support hybrid modeling by incorporating structured analysis artifacts, such as data flow diagrams, alongside UML and BPMN for seamless transitions in mixed-method projects.[22]Core Principles
Single Abstraction Mechanism
In structured analysis, the single abstraction mechanism refers to the consistent use of functional decomposition as the primary representational technique, primarily through data flow diagrams (DFDs) with functional bubbles (processes), to model the system's functions, data flows, and interactions in a hierarchical manner. This approach provides a unified framework for the core functional model while allowing supplementary notations, such as entity-relationship diagrams (ERDs) for data structures and state-transition diagrams (STDs) for behaviors, to ensure completeness without introducing undue inconsistency.[2] The primary purpose of this mechanism is to foster uniformity in the core modeling practices, which streamlines the learning process for practitioners and minimizes errors in functional representation. By emphasizing a primary abstraction form centered on processes, it contrasts with methodologies that lack such a focused functional hierarchy, thereby enhancing overall analytical efficiency and model maintainability. Additionally, it reduces cognitive load on analysts by standardizing how complex systems are conceptualized and refined.[23] Implementation of the single abstraction mechanism involves functional decomposition, wherein the system is progressively divided into interconnected processes and associated data stores across hierarchical levels. For example, a payroll system might begin with a high-level abstraction of overall compensation processing, then decompose into subordinate elements such as wage computation, tax deduction application, and payment issuance, each represented uniformly to preserve inputs, outputs, controls, and mechanisms. This top-down refinement maintains balance and traceability throughout the hierarchy.[24] The mechanism is exemplified in the primary tools of structured analysis, such as DFDs, and also aligns with related standards like IDEF0, which employs a singular box notation to encapsulate functions alongside their interfaces, promoting rigorous process modeling. This standardization further aids in lowering the interpretive burden on teams, enabling clearer communication of system behaviors and requirements.[25]Top-Down Decomposition Approach
The top-down decomposition approach in structured analysis begins with a high-level representation of the entire system as a single entity, then iteratively breaks it down into successively detailed subprocesses until reaching atomic, indivisible functions that can be readily implemented. This hierarchical refinement applies the divide-and-conquer principle to manage system complexity, ensuring that each level provides a balanced and consistent view of the system's behavior.[26] The process follows a structured sequence of steps. First, the primary functions of the system are identified at the highest level, capturing the overall inputs, outputs, and interactions with external entities. Next, each major function is partitioned into sub-functions, with data flows allocated between them to reflect how information moves through the system. This partitioning continues recursively, with leveling techniques applied to refine details while maintaining balance—meaning that data entering or leaving a parent process must correspond exactly to the aggregated data flows in its child subprocesses, conserving information across levels. The decomposition halts at primitive processes, which are simple enough to specify without further breakdown.[26][27] This approach offers several advantages, including ensuring completeness by systematically covering all system aspects and enhancing manageability by limiting the scope of each level to a small number of elements, typically no more than seven to avoid cognitive overload. It also facilitates parallel development, as teams can work independently on different branches of the hierarchy once higher levels are defined.[26] A representative example is the decomposition of an inventory management system. At the context level, the system is viewed as a whole, handling inputs like purchase orders from suppliers and sales data from customers, and producing outputs such as stock reports and reorder notifications. This is then partitioned into main functions, such as order processing, stock updating, and reporting. Further refinement might break order processing into sub-functions like validate order and check availability, with data flows (e.g., order details) allocated accordingly. Leveling ensures balance, for instance, by matching the "order details" flow entering the parent process to the combined validation and availability check outputs in the child level, preventing inconsistencies in data conservation.[26]Key Techniques
Context Diagrams
In structured analysis, the context diagram represents the highest-level data flow diagram (DFD), known as level 0, which depicts the entire system as a single process interacting with external entities solely through data flows. This diagram establishes the system's boundaries by focusing exclusively on inputs and outputs, without revealing any internal structure or operations, thereby providing a clear overview of the system's scope and external dependencies during the requirements elicitation phase. Developed as part of the foundational tools in structured analysis by pioneers like Tom DeMarco and Ed Yourdon, it serves as the starting point for top-down decomposition in system modeling.[26][28][29] The key components of a context diagram include: the central process, illustrated as a single bubble or circle symbolizing the whole system; external entities, represented as rectangles acting as sources or sinks of data (e.g., users, external systems, or organizations); and directed arrows denoting data flows, which carry information into or out of the system and must be labeled with descriptive names for clarity. Importantly, this diagram omits data stores, subprocesses, or control elements to maintain its high-level, boundary-focused nature, ensuring all interactions are captured without delving into implementation details. In the Yourdon-DeMarco notation, these elements adhere to specific graphical conventions: processes as open circles, entities as named rectangles, and flows as labeled arrows with optional directional indicators.[26][30] To construct a context diagram, analysts first identify all relevant external entities by consulting stakeholders to list actors that provide inputs or receive outputs from the system, such as customers or interfacing databases. The system is then modeled as one cohesive process at the diagram's center, with data flows drawn to connect entities directly to it, naming each flow to reflect the data exchanged (e.g., "customer request" or "validation response"). Guidelines stress completeness—ensuring no external interaction is overlooked—while prohibiting internal details to avoid premature decomposition; the diagram should remain simple, typically fitting on one page, and is iterated based on requirements reviews to refine scope. This approach aligns with structured analysis's emphasis on graphical specification for unambiguous communication in the early project stages.[26][29] A representative example is the context diagram for a banking automated teller machine (ATM) system, where the ATM is shown as the single central process. External entities include the bank customer (providing inputs like card and PIN), the central bank database (handling account verification), and the cash dispenser (outputting funds). Data flows connect these, such as "card insertion data" from customer to ATM, "transaction authorization request" from ATM to bank database, "approval/denial signal" from bank database to ATM, and "dispense cash command" from ATM to cash dispenser, illustrating the system's external interfaces without internal transaction processing details.[31]Data Flow Diagrams
Data flow diagrams (DFDs) serve as the primary graphical tool in structured analysis for modeling the movement and transformation of data within a system, emphasizing functional decomposition without regard to implementation details. Developed by Tom DeMarco, this notation uses four fundamental symbols: processes depicted as circles or bubbles representing data transformations, external entities as rectangles denoting sources or sinks of data outside the system boundary, data stores as open-ended rectangles (two parallel horizontal lines) for persistent data repositories, and directed arrows labeled with data flow names to indicate the movement of information packets between components.[32][30] DFDs employ a hierarchical leveling structure to progressively detail the system, beginning with the context diagram at level 0—which outlines the entire system as a single process interacting with external entities—and decomposing into successively lower levels until reaching primitive processes that perform atomic functions without further subdivision. This top-down approach ensures comprehensive coverage while maintaining manageability, with each level providing a balanced view of data interactions.[30][26] Key rules govern DFD construction to ensure consistency and clarity: the balancing principle requires that all inputs and outputs on a parent-level process match exactly those on its corresponding child-level diagram, preserving data integrity across decompositions. Basic DFDs exclude control flows, decision rules, or loops, focusing exclusively on data transformations to avoid conflating logic with flow; however, for real-time systems, extensions introduce transaction flows—such as control signals or timed events—to model temporal behaviors while retaining the data-centric core.[30][26] The development of DFDs proceeds iteratively, starting with high-level sketches derived from requirements analysis and refined through successive decompositions, where analysts identify inconsistencies or missing flows and adjust accordingly. At the primitive level, each process is specified in detail using techniques like pseudocode for sequential logic or decision tables to enumerate conditions and actions, providing a bridge to implementation without embedding programming specifics.[29][33] A representative multi-level DFD for an e-commerce order fulfillment system illustrates these elements: the level 0 diagram shows the system as a central "Fulfill Order" process receiving "Customer Order" from the external "Customer" entity and "Inventory Status" from the "Supplier" entity, producing "Shipment Confirmation" outputs while accessing a "Orders Database" data store. Level 1 decomposes this into subprocesses like "Validate Order," "Check Inventory," and "Generate Shipment," with data flows such as "Validated Order Details" connecting them and ensuring balance by mirroring the parent inputs/outputs. Further leveling, say for "Check Inventory" at level 2, might reveal sub-flows to query stock levels, but partitioning challenges arise in allocating shared data accesses without duplication—addressed by refining boundaries to minimize coupling and maintain flow consistency.[30][34]Data Dictionaries
In structured analysis, the data dictionary serves as a centralized textual repository that provides precise definitions for all data flows, data stores, and external entities depicted in the models, thereby eliminating ambiguity and ensuring consistent understanding among analysts and stakeholders. This component is essential for documenting the meaning, structure, and constraints of data elements during the requirements analysis phase, facilitating clear communication and reducing misinterpretation in system specifications. As outlined in Tom DeMarco's foundational work, the data dictionary complements graphical models by offering a formal, exhaustive catalog that supports iterative refinement of the analysis.[35][36] The data dictionary comprises detailed entries for individual data elements, including attributes such as name, aliases, data type (e.g., integer, string), range or domain (e.g., valid values or constraints), and sources/destinations (e.g., originating processes or entities). For composite data structures, definitions use a notation to specify relationships, such as "=" for equivalence, "+" for concatenation or sequence, "[]" for optional elements, and "{}" for iterative or choice elements, enabling hierarchical decomposition of complex data flows. These entries also incorporate validation rules, such as format requirements or dependencies, to enforce data integrity from the outset of analysis. This structured format, derived from DeMarco's methodology, ensures that every data item referenced in the data flow diagrams has a verifiable definition.[35][36][37] Maintenance of the data dictionary involves continuous cross-referencing with data flow diagrams to verify alignment, with updates performed iteratively as new details emerge during analysis sessions or stakeholder reviews. Analysts must ensure completeness by including definitions for all elements appearing in the models, propagating changes across related entries to maintain consistency, and using tools like automated repositories for traceability in larger projects. This ongoing process, integral to DeMarco's structured specification approach, prevents inconsistencies that could propagate into design and implementation phases.[35][36] For example, in a retail system, the data dictionary entry for "Customer Order" might be defined as follows:- Name: Customer Order
- Aliases: Order, Purchase Request
- Description: A record of items requested by a customer for purchase, including identification and fulfillment details.
- Structure: Customer Order = Customer-ID + Order-Date + {Line-Item}
- Where Line-Item = Item-Number + Quantity + Unit-Price
- Type: Composite (structured record)
- Range: Customer-ID (alphanumeric, 10 characters); Quantity (positive integer, 1-999); Unit-Price (decimal, 0.01-9999.99)
- Sources/Destinations: Generated by "Receive Order" process; destined to "Validate Order" process and "Order Store" data store
- Validation Rules: Total value must exceed $10; Quantity cannot exceed stock availability.
Design Integration
Structure Charts
Structure charts are tree-like diagrams that depict the hierarchical organization of a program's modules, illustrating the calls between routines, the passing of data, and the flows of control within a software system. Developed as a key artifact in structured design, these charts provide a static, time-independent representation of module interdependencies, emphasizing modularity and top-down decomposition to facilitate implementation and maintenance. Unlike procedural flowcharts, structure charts focus on the architectural breakdown rather than sequential execution steps, enabling designers to visualize how high-level processes from analysis are refined into callable components.[39] The notation in structure charts uses simple, standardized symbols to convey relationships clearly. Modules are represented as rectangles or boxes, each encapsulating a specific function or procedure. Arrows or solid lines connect these boxes to indicate control flow from a parent module to its subordinates, while dotted or dashed lines denote data exchanges or pathological couplings that deviate from hierarchical norms. Additional symbols include diamonds for conditional branches, looping arrows for iteration or recursion, and numerals to mark one-time executions. Striped rectangles may denote pre-existing or system-provided modules, ensuring the diagram distinguishes custom code from inherited components. These elements collectively highlight fan-in patterns, where multiple modules converge control to a shared subordinate, and fan-out patterns, where a single module invokes several parallel routines.[39] Structure charts are typically derived from data flow diagrams (DFDs) through structured design techniques, which map functional processes into modular hierarchies. Two primary approaches guide this mapping: transform analysis and transaction analysis. Transform analysis applies to systems with continuous, sequential data flows, partitioning the structure into afferent (input-handling) branches, a central transform (core processing) level, and efferent (output-generation) branches to create balanced, input-process-output architectures. In contrast, transaction analysis suits event-driven systems processing discrete inputs, organizing modules around specific transaction types—such as present, type, analyze, and dispatch levels—to handle varied control paths efficiently. Both methods ensure the resulting chart reflects the system's logical boundaries while minimizing complexity in inter-module communications.[39] A representative example is a structure chart for a report generation module in a personnel system, such as the GETPME (Get Personnel Master Entries) process. At the top level, the main module "GETPME" fans out to subordinates like "DEBLOC" for deblocking input records, "GETBLOC" for block retrieval, "MORTEST" for morning test validation, "BUILDITEM" for item construction, and "MAKEREADY" for final preparation. Control flows downward via solid arrows, with data passed laterally (e.g., record buffers between deblocking and building modules), forming a "pancake" hierarchy with nested loops indicated by looping arrows to handle iterative record processing. This illustrates fan-out from the root for parallel input tasks and fan-in as results converge for output, promoting a clean separation of concerns in report assembly.[39]Structured Design Principles
Structured design principles serve as the methodological bridge between the outputs of structured analysis, such as data flow diagrams (DFDs), and the modular implementation of software systems, emphasizing a systematic decomposition into independent, hierarchical modules to ensure maintainability and clarity.[39] Developed by Edward Yourdon and Larry L. Constantine, this approach transforms abstract process models into concrete program structures by focusing on information flow rather than procedural details, thereby aligning design with the problem domain while facilitating reusability across implementations.[39] The process begins with identifying primary data streams in the DFDs, distinguishing between transform streams—which involve sequential input-to-output data processing—and transaction streams—which handle event-driven, selective processing based on specific inputs.[39] Next, modules are allocated to the identified processes, partitioning the system into afferent (input-handling), central transform (core processing), and efferent (output-handling) components to distribute responsibilities logically and minimize interdependencies.[39] Finally, the design is refined for reusability by iteratively simplifying interfaces, eliminating redundant paths, and ensuring each module performs a single, well-defined function, often guided by heuristics for optimal structure.[39] Central to these principles are concepts like fan-out, which promotes parallel processing by allowing a module to invoke multiple subordinate modules simultaneously, ideally with an average of 3-4 subordinates to balance control distribution without overwhelming complexity.[39] Hierarchy is equally vital, enforcing a top-down control structure that avoids unstructured "spaghetti code" through strict subordinating relationships and normal connections, thereby maintaining a clear chain of command and enabling black-box treatment of modules.[39] These principles are typically visualized using structure charts, which depict the modular hierarchy and connections.[39] A representative example is the design of a database query subsystem derived from DFD inputs, where transform analysis identifies an input stream for query parsing, allocates modules like GETREC for record retrieval and TEST for validation in the central transform branch, and refines efferent modules for result formatting, ensuring hierarchical fan-out for parallel query execution while preserving data flow integrity.[39]Cohesion and Coupling Metrics
In structured analysis and design, cohesion and coupling serve as fundamental metrics for assessing the quality of modules, promoting modularity, maintainability, and reliability by evaluating how tightly related a module's internal elements are and how loosely interconnected modules are with one another.[39] Cohesion measures the degree to which elements within a module contribute to a single, well-defined function, ranked from lowest to highest quality, while coupling quantifies the interdependence between modules, with lower levels preferred to minimize ripple effects from changes. These metrics, introduced in the seminal work on structured design, guide designers in refining module boundaries during the transition from data flow diagrams to structure charts.[39]Cohesion Types
Cohesion is categorized into seven types, ordered from worst (coincidental) to best (functional), based on the semantic relatedness of module elements. Designers aim for high cohesion to ensure modules perform singular, cohesive tasks, reducing complexity and errors. The following table summarizes the types, with definitions and examples:| Type | Definition | Example | Ranking (1=worst, 7=best) |
|---|---|---|---|
| Coincidental | Elements are unrelated, grouped arbitrarily without meaningful connection. | A module mixing payroll calculations, inventory updates, and error logging. | 1 |
| Logical | Elements perform related operations but not toward a single goal, often by logical class. | A module handling all input validations regardless of context. | 2 |
| Temporal | Elements are grouped by execution timing, such as initialization or shutdown. | A module initializing variables, opening files, and starting timers at program startup. | 3 |
| Procedural | Elements follow a specific control sequence or procedure. | A module executing sequential steps like read, process, and write in a loop. | 4 |
| Communicational | Elements operate on the same data or resource, though independently. | A module editing multiple fields of a single record. | 5 |
| Sequential | Elements form a chain where output of one serves as input to the next. | A module pipeline: read file, transform data, then output to database. | 6 |
| Functional | All elements contribute to one well-defined task, ideally a single abstraction. | A module solely computing sales tax based on input parameters. | 7 |
Coupling Types
Coupling assesses inter-module dependencies, ranked from lowest (data) to highest (content), with strategies focused on simplification and encapsulation to minimize it. High coupling increases the risk of cascading changes, whereas low coupling enhances reusability and testing. The types are outlined below:| Type | Definition | Example | Ranking (1=best, 6=worst) |
|---|---|---|---|
| Data | Modules exchange simple parameters without shared structure or control. | Passing a single integer value between modules. | 1 |
| Stamp | Modules share a composite data structure, passing more than needed. | Passing an entire record structure when only one field is used. | 2 |
| Control | One module passes flags or control elements to dictate another's behavior. | Sending a boolean flag to select processing mode in a called module. | 3 |
| External | Modules access the same external data or devices indirectly. | Two modules reading from the same global file without direct sharing. | 4 |
| Common | Modules share global data areas or environments. | Multiple modules accessing a common variable block. | 5 |
| Content | One module directly modifies or accesses another's internal workings. | A module altering private variables of another via direct memory access. | 6 |