Hubbry Logo
Residential areaResidential areaMain
Open search
Residential area
Community hub
Residential area
logo
8 pages, 0 posts
0 subscribers
Be the first to start a discussion here.
Residential area
Residential area
from Wikipedia
Residential area in Helena, Montana, United States
Suburban slum in Bhutan
Residential area typical for suburbs in central Poland

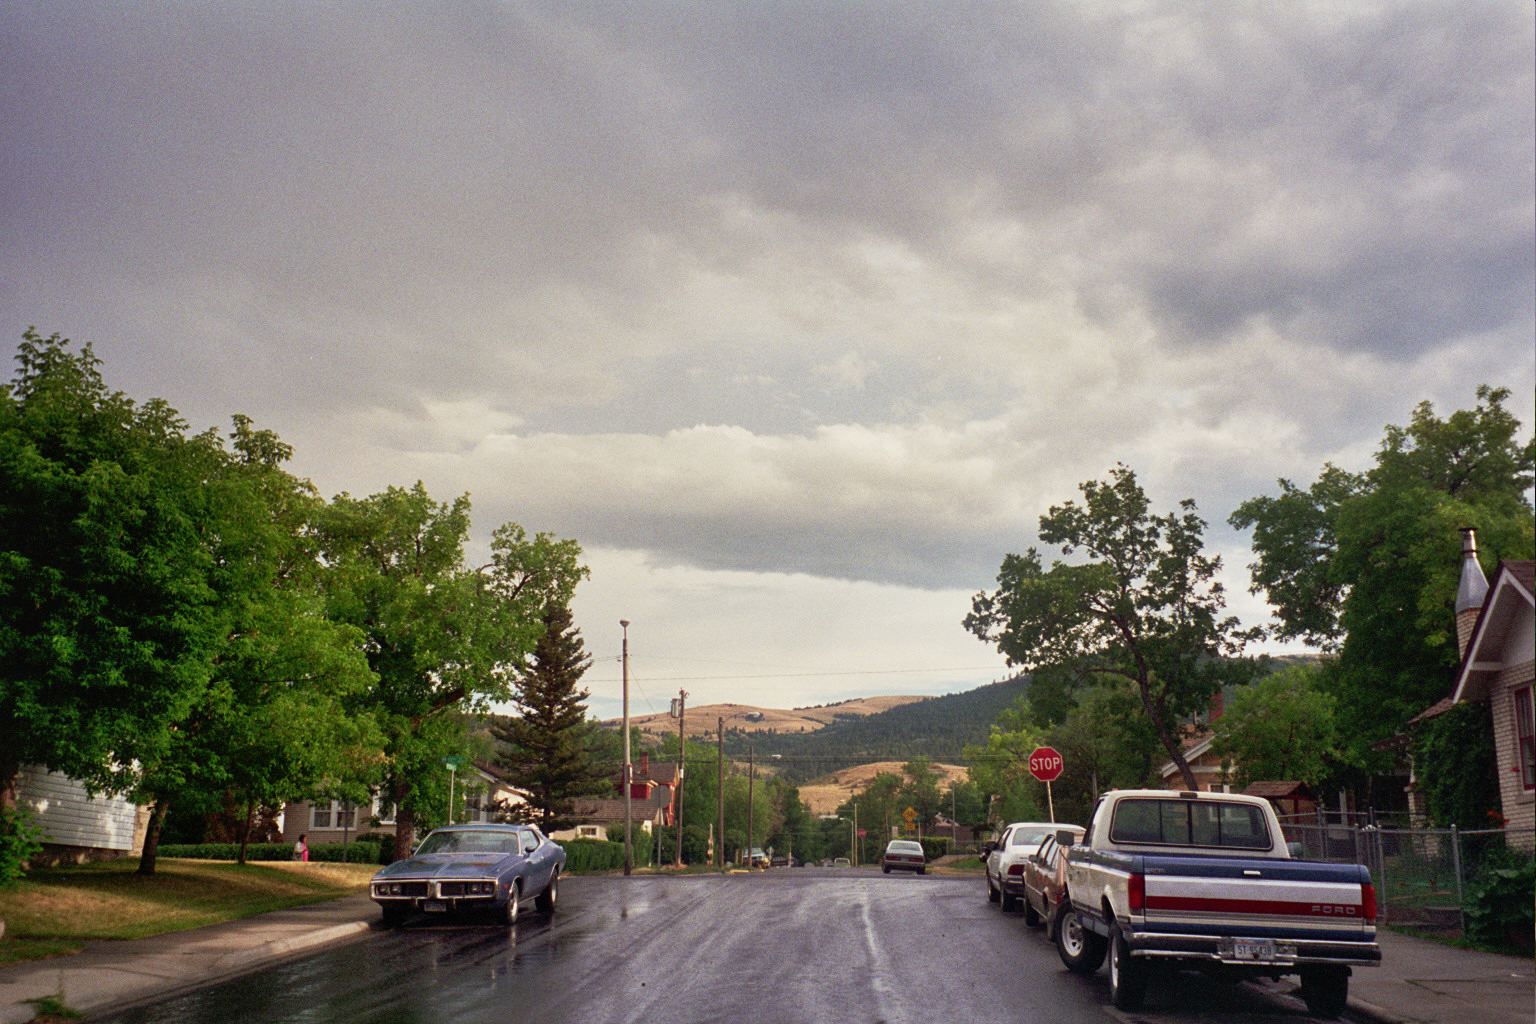
A residential area is a land used in which housing predominates, as opposed to industrial and commercial areas.[1][2]

Housing may vary significantly between, and through, residential areas. These include single-family housing, multi-family residential, or mobile homes. Zoning for residential use may permit some services or work opportunities or may totally exclude business and industry. It may permit high density land use or only permit low density uses. Residential zoning usually includes a smaller FAR (floor area ratio) than business, commercial or industrial/manufacturing zoning. The area may be large or small.[3][4][5]

Overview

[edit]
A residential area of Ikuri in Tampere, Finland

In certain residential areas, especially rural, large tracts of land may have no services whatever, such that residents seeking services must use a motor vehicle or other transportation, so the need for transportation has resulted in land development following existing or planned transport infrastructure such as rail and road. Development patterns may be regulated by restrictive covenants contained in the deeds to the properties in the development and may also result from or be reinforced by zoning. Restrictive covenants are not easily changed when the agreement of all property owners (many of whom may not live in the area) is required. The area so restricted may be large or small.

Bashundhara R/A, a private residential area in Dhaka

Residential areas may be subcategorized in the concentric zone model and other schemes of urban geography.

Residential development

[edit]
New inner city residences in Manhattan
Residential area in Brooklyn about a century after it was developed
Residential area in Mong Kok East and Ho Man Tin, Hong Kong

History

[edit]

Residential development is real estate development for residential purposes. Some such developments are called a subdivision, when the land is divided into lots with houses constructed on each lot. Such developments became common during the late nineteenth century, particularly in the form of streetcar suburbs.

In previous centuries, residential development was mainly of two kinds. Rich people bought a townlot, hired an architect and/or contractor, and built a bespoke / customized house or mansion for their family. Poor urban people lived in shantytowns or in tenements built for rental. Single-family houses were seldom built on speculation, that is for future sale to residents not yet identified. When cities and the middle class expanded greatly and mortgage loans became commonplace, a method that had been rare became commonplace to serve the expanding demand for home ownership.

Residential street in Cincinnati, Ohio

Post–World War II economic expansion in major cities of the United States, especially New York City and Los Angeles produced a demand for thousands of new homes, which was largely met by speculative building. Its large-scale practitioners disliked the term "property speculator" and coined the new name "residential development" for their activity. Entire farms and ranches were subdivided and developed, often with one individual or company controlling all aspects of entitlement (permits), land development (streets and grading), infrastructure (utilities and sewage disposal), and housing. Communities like Levittown, Long Island or Lakewood south of Los Angeles saw new homes sold at unprecedented rates—more than one a day. Many techniques which had made the automobile affordable made housing affordable: standardization of design and small, repetitive assembly tasks, advertising, and a smooth flow of capital. Mass production resulted in a similar uniformity of product, and a more comfortable lifestyle than cramped apartments in the cities. With the advent of government-backed mortgages, it could actually be cheaper to own a house in a new residential development than to rent.

As with other products, continual refinements appeared. Curving streets, greenbelt parks, neighborhood pools, and community entry monumentation appeared. Diverse floor plans with differing room counts, and multiple elevations (different exterior "looks" for the same plan) appeared. Developers remained competitive with each other on everything, including location, community amenities, kitchen appliance packages, and price.

Today, a typical residential development in the United States might include traffic calming features such as a slowly winding street, dead-end road, or looped road lined with homes.

Suburban developments help form the stereotypical image of a "suburban America" and are generally associated with the American middle-class. Most offer homes in a narrow range of age, price, size and features, thus potential residents having different needs, wishes or resources must look elsewhere. Some residential developments are gated communities or residential communities.

Problems with residential developments

[edit]
Residential area in Oleiros, Galicia, Spain.

Criticisms of residential developments may include the following:

  • They do not mesh well with the greater community. Some are isolated, with only one entrance, or otherwise connected with the rest of the community in few ways.
  • Being commuter towns, they serve no more purpose for the greater community than other specialized settlements do and thus require residents to go to the greater community for commercial or other purposes, whereas mixed-use developments provide for commerce and other activities, so residents need not go as often to the greater community.
  • Lodging advancements can frequently be isolated with only one way in and one way out. Without great streets and ways to different regions, getting around can take a pointlessly lengthy timespan - making it harder for individuals to walk and cycle.
  • Front nurseries with low walls will quite often be very much taken care of, with inhabitants keeping an eye on their front nurseries and covertly attempting to outperform their neighbors. Numerous designers lessen costs by eliminating these unobtrusive yet significant qualifications among public and confidential space. The outcome is many times puts that become unused, disliked and neglected.
  • Current roads are packed with unattended vehicles, which is not just unattractive but blocks pavements, makes roads more unsafe for kids and is also often the source of arguments with neighbours.
  • Everybody cherishes a tree-lined road, however new improvements frequently overlook them. Numerous expressways specialists deter trees and hedgerows making green and verdant roads progressively difficult to come by. As an outcome, many modern developments are dominated by hard materials and often appear colorless.

References

[edit]
[edit]
Revisions and contributorsEdit on WikipediaRead on Wikipedia
from Grokipedia
A residential area is a designated zone where predominates, consisting of structures such as single-family homes, multi-family apartments, and other dwellings intended primarily for living, sleeping, and associated domestic activities. These zones are established through municipal ordinances to segregate residential development from industrial or commercial activities, thereby minimizing , , and that could disrupt habitation. Residential areas vary widely in density and form, ranging from high-density urban clusters with multi-story apartment buildings integrated into city cores, to medium-density suburban neighborhoods featuring detached single-family houses with yards and green spaces, and low-density rural settlements incorporating larger lots often adjacent to farmland. Zoning regulations in these areas typically enforce setbacks, lot sizes, and building heights to preserve neighborhood character, prevent overcrowding, and maintain property values, though such restrictions have been linked empirically to reduced housing supply and elevated costs in many markets. The institutionalization of exclusive residential zoning began in the United States in the early , with New York City's 1916 zoning resolution marking the first comprehensive effort to regulate land uses, building bulk, and heights amid unchecked urban growth that had previously encroached on living spaces. This approach was constitutionally affirmed by the U.S. in Village of Euclid v. Ambler Realty Co. (1926), enabling widespread adoption of Euclidean zoning that prioritizes single-use districts. In contrast, European planning traditions, as seen in , have favored more flexible regulations allowing mixed residential-commercial uses, reflecting denser historical urban fabrics without the same degree of segregation. While intended to promote orderly development and , rigid residential zoning has faced criticism for originally serving exclusionary purposes, including socioeconomic and , and for causally constraining housing affordability through supply limitations in high-demand regions.

Definition and Characteristics

Core Elements

A residential area is a designated zone where the predominant structures and activities center on human habitation, encompassing single-family homes, multi-family dwellings, apartments, and other housing types, in contrast to zones allocated for , industry, or . These areas are defined by laws that restrict development to residential purposes, ensuring a focus on living environments with minimal intrusion from incompatible uses such as heavy or large-scale retail. Essential infrastructure forms the backbone of residential areas, including networked utilities for water supply, electricity, sewage disposal, and telecommunications, alongside paved streets and sidewalks for access and mobility. These elements enable daily living functions while regulations often mandate setbacks, lot coverage limits, and height restrictions to preserve light, air, and privacy for inhabitants. Limited ancillary facilities, such as small-scale convenience stores or religious institutions, may be permitted under conditional zoning to serve immediate resident needs without altering the area's primary residential character. Communal features like parks, playgrounds, and pathways contribute to the functional and aesthetic , fostering recreational opportunities and social interaction within . Density variations—ranging from low-density single-detached homes on large lots to high-density clusters—characterize residential zones, with ratios typically lower than in non-residential districts to prioritize open space and . Such configurations arise from principles aimed at balancing population accommodation with environmental and quality-of-life considerations.

Density and Design Variations

Residential density in areas is quantified by the number of units or inhabitants per unit of , commonly expressed as units per (du/ha) or persons per square kilometer. Low-density developments typically range from 5 to 20 du/ha, dominated by single-family detached homes on larger lots averaging 0.1 to 0.4 s per unit, which provide ample private yards and separation between structures. Such low-density designs emerged prominently in post-World War II suburban expansions in the United States and , where ordinances restricted multi-unit construction to preserve property values and reduce perceived congestion; by 2020, over 70% of U.S. residential land remained zoned for single-family use, correlating with higher costs for roads, utilities, and utilities maintenance—estimated at 2-3 times those of high-density zones due to extended service lengths. These configurations promote vehicle dependency, with residents in low-density suburbs traveling an average of 20-30% farther for daily needs compared to urban counterparts, elevating transportation emissions by up to 40% in life-cycle analyses. In contrast, high-density residential areas exceed 50-100 du/ha, incorporating mid-rise apartments, townhouses, or high-rises that stack units vertically to optimize land efficiency in constrained urban cores. Empirical data from European and North American studies demonstrate that higher densities reduce average trip distances by 15-25% and support viable transit, yielding lower overall use for heating, cooling, and mobility—high-density buildings often achieve 20-30% less operational emissions through shared walls and centralized systems. However, unchecked densification without adequate can strain local resources, as observed in rapidly growing Asian megacities where densities over 200 du/ha have led to elevated levels (exceeding 60 dB) and reduced access to in poorly ventilated blocks. Design variations further modulate density effects, with street networks playing a pivotal role: orthogonal grid patterns facilitate efficient circulation and shorter routes, enhancing in dense settings, whereas curvilinear layouts with cul-de-sacs—prevalent in U.S. suburbs since the 1950s—prioritize and play space but diminish connectivity, increasing walking distances by 20-50% in modeled scenarios. Building orientations and setbacks influence microclimates and health outcomes; south-facing facades in northern latitudes maximize passive , reducing heating demands by 10-15%, while excessive clustering without green buffers correlates with higher urban heat islands, raising summer temperatures 2-4°C in affected zones. Studies attribute greater life satisfaction gains to improved interconnectivity over mere increases, underscoring that fragmented designs exacerbate isolation despite lower loads. Hybrid approaches, such as transit-oriented developments integrating varied densities around rail nodes, empirically balance these trade-offs by concentrating higher intensities near amenities while buffering with lower-density edges, as evidenced in Scandinavian projects achieving 15-20% reductions in rates.
Density TypeTypical Units/haKey Design FeaturesEmpirical Impacts
Low5-20Detached homes, large lots, cul-de-sacsHigher infrastructure costs (2-3x per capita); increased vehicle miles traveled (20-30% more)
Medium20-50Townhouses, duplexes, mixed gridsBalanced walkability; moderate emissions savings (10-20%)
High50+Apartments/high-rises, orthogonal networksShorter commutes (15-25% less); lower energy use (20-30% ) but potential overheating risks

Historical Evolution

Pre-Modern Settlements

Pre-modern residential settlements emerged with the Neolithic Revolution around 10,000 BCE, as hunter-gatherer groups transitioned to agriculture, enabling permanent habitation clustered near fertile lands and water sources for defense and resource efficiency. Early examples, such as Pre-Pottery Neolithic sites in the Near East dating to circa 9500–7000 BCE, featured densely packed rectangular houses built from mudbrick or stone, often abutting one another without formal streets, reflecting communal social structures and a shift toward sedentism that supported population growth and specialization. These clusters, housing 100–200 individuals per settlement, prioritized contiguity for mutual protection against environmental hazards and raids, with interiors divided into living, storage, and ritual spaces. In ancient urban centers like those of from the 4th millennium BCE, residential areas consisted of multi-room houses arranged around central courtyards, constructed from sun-dried mudbricks with flat roofs for additional living space, typically accommodating extended in neighborhoods radiating from temples or palaces. Layouts were largely organic, evolving through accretion rather than central planning, though later examples in cities like (circa 2100 BCE) incorporated paved open areas and alleys for access, with house sizes varying by status—larger units for elites featuring up to 20 rooms, smaller ones for commoners limited to 4–6. This pattern stemmed from causal needs for privacy within dense populations, where courtyards facilitated ventilation and light in hot climates while minimizing exposure to dust storms. The Indus Valley Civilization (circa 2600–1900 BCE) represented an early exception with deliberate residential planning, as seen in and , where baked-brick houses formed uniform blocks along grid-patterned streets oriented north-south and east-west, ensuring efficient drainage via covered sewers and wells in nearly every unit. These two-story dwellings, averaging 200–300 square meters for wealthier residents and smaller for others, clustered in lower towns separated from citadels, promoting and airflow in subtropical conditions that otherwise fostered disease in unplanned agglomerations. Such standardization likely arose from administrative oversight tied to trade and flood control, contrasting with the ad-hoc growth in contemporaneous . By the medieval period in (circa 500–1500 CE), residential patterns diversified into nucleated villages—compact clusters of 10–50 timber-framed or wattle-and-daub houses around a church or —prevalent in central regions for communal farming and defense, or linear settlements strung along roads and rivers in marginal areas to exploit . Nucleated forms, 200–500 people, facilitated open-field where strips were allocated by lot, with houses backed onto tofts for and fronting streets for markets, driven by feudal obligations that concentrated labor near manors. Dispersed hamlets, conversely, scattered farmsteads across pastures in upland or zones, reflecting ecological adaptation where isolation reduced conflict but limited cooperation, as evidenced in Anglo-Saxon and post-Norman distributions. Overall, pre-modern residential evolution prioritized survival imperatives—proximity for security and subsistence—over aesthetic or egalitarian ideals, with planning emerging only where surplus and governance permitted.

Industrial Era Urbanization

The , commencing in Britain around 1760, triggered massive rural-to-urban migration as agricultural workers sought employment in emerging factories concentrated in cities such as and . This influx caused England's urban population—defined as residing in centers of 2,500 or more inhabitants—to rise from approximately 30% in 1801 to over 50% by 1851, marking Britain as the first predominantly urban society. The concentration of industry near coalfields and ports amplified this trend, with residential areas evolving into dense clusters of rudimentary housing to accommodate the labor force, often built hastily by landowners converting farmland or erecting basic structures without regard for or ventilation. In the United States, industrialization accelerated post-1820s, drawing migrants to manufacturing hubs like New York and ; the urban population share grew from 6% in 1800 to 40% by 1900, as factories demanded proximate workforces and families required affordable shelter. Residential developments manifested primarily as tenements—multi-family dwellings of 4-6 stories housing up to 20 people per unit—in grid-patterned blocks, with units averaging 300-400 square feet lacking indoor plumbing or natural light. Overcrowding ensued, with densities reaching 500-1,000 persons per acre in areas like New York's , exacerbating disease transmission; outbreaks in 1832 and 1849 killed thousands due to shared privies and contaminated water sources shared among residents. In , similar tenements proliferated after the 1871 fire, sheltering immigrants but fostering vermin infestations and rates 2-3 times higher than rural areas. These conditions stemmed from housing supply lagging behind demand, as speculative builders prioritized quantity over quality amid population surges, though early efforts remained minimal until late in the era. By the 1890s, reformers documented ills like 80% of buildings in major U.S. cities violating basic fire codes, prompting legislation such as New York's 1901 Tenement House Act mandating indoor toilets, windows in every room, and yard spaces to mitigate fire and health risks. In Britain, analogous pressures led to the 1875 Act, which enforced drainage and ventilation standards in new working-class housing, gradually shifting residential construction toward terraced rows with shared walls but improved airflow. Despite these reforms, industrial-era residential zones retained stark class divides, with affluent suburbs emerging peripherally while core areas persisted as overcrowded worker enclaves until post-1900 investments.

20th-Century Suburbanization

In the United States, suburbanization intensified after , transforming residential patterns amid economic expansion and policy support. Prior to 1945, suburbs housed about 13% of the , but mass migration ensued, with suburbs accommodating over half by the century's end. The Servicemen's Readjustment Act of 1944, known as the , provided low-interest home loans to veterans, facilitating 4.3 million loans totaling $33 billion by 1955 and enabling purchases of 20% of all new homes built during that period. This demand coincided with a that added 40 million to the U.S. between 1945 and 1960, amplifying needs. Pioneering developments like Levittown, New York, initiated in 1947 by Levitt & Sons, demonstrated efficient mass production techniques, erecting a home every 16 minutes and completing 17,000 units to shelter 84,000 residents at prices starting at $7,900. Rising automobile ownership—from 26 million registered vehicles in 1945 to 73 million by 1960—coupled with the Federal-Aid Highway Act of 1956, which funded over 40,000 miles of interstate highways, enhanced commuter access to peripheral areas. These factors drew middle-class families seeking larger lots and single-family dwellings, often away from urban cores facing industrial decline and density-related challenges. Federal housing policies, including guarantees, prioritized suburban lending while practices like restricted minority access, resulting in predominantly white enclaves and contributing to inner-city depopulation. By 1960, suburban homes constituted 85% of the 13 million new units built nationwide since 1948. In , post-war reconstruction spurred similar outward growth, particularly in Western nations, though tempered by land scarcity, stronger , and lower car penetration; for instance, suburban populations expanded notably from the onward in countries like the and via policies promoting peripheral housing. This global shift reflected preferences for spacious, low-density living enabled by motorized transport and economic recovery, reshaping metropolitan landscapes.

Types and Classifications

Urban Residential Districts

Urban residential districts form the primary housing zones in city centers, featuring high population densities and a predominance of multi-family structures such as apartments and condominiums. These areas are defined by zoning regulations that prioritize residential use while permitting limited commercial elements, typically on ground floors, to support daily needs. In the United States, urban areas encompass densely settled cores with minimum housing unit densities of at least 2 housing units per acre or population densities of 1,000 persons per square mile, as delineated by the Census Bureau for the 2020 Census. Such districts enable efficient in constrained urban environments, fostering proximity to employment centers and public transit. Housing types in urban residential districts vary by density and regulatory frameworks, ranging from low-rise row houses and townhomes in transitional zones to mid- and high-rise buildings in core areas. For instance, New York City's residence districts span R1 zones for detached single-family homes to R10 zones accommodating residential , with densities escalating accordingly. Multi-family dwellings dominate, including duplexes, multiplexes, and larger complexes, which house a significant portion of urban populations; in 2020, U.S. urban areas averaged 2,553 persons per , reflecting intensified residential clustering. These configurations arise from historical pressures, where land scarcity drives vertical development and mixed typologies like "missing middle" housing—such as fourplexes and cottage courts—to bridge single-family and high-density extremes. Examples abound in major cities, where urban residential districts exhibit stark density gradients. New York City's represents one of the densest square kilometers in the U.S., with over 50,000 residents per square kilometer in peak blocks, sustained by high-rise apartments. In contrast, districts like Cincinnati's Oakley feature walkable streets lined with attached homes and small apartments, achieving urban densities around 5,000-10,000 persons per square mile while maintaining neighborhood cohesion. in these areas enforces stability for family-oriented living, yet often incorporates accessory uses like conversions to address demand, as seen in recent New York City reforms allowing non-residential buildings to adapt for diverse residential needs. Challenges include elevated land values and infrastructure strain, but these districts underpin urban economic vitality through concentrated housing supply.

Suburban Developments

Suburban developments consist of residential areas situated on the outskirts of cities, featuring lower population densities than urban cores, with primarily comprising single-family detached homes on larger lots that accommodate private yards and vehicle storage. These areas often incorporate planned layouts with curving streets and cul-de-sacs to promote a isolation from through-traffic, alongside amenities such as local schools, parks, and shopping centers accessible mainly by car. The design emphasizes spatial separation from commercial and industrial zones, fostering environments suited for family living but increasing dependence on personal automobiles for daily mobility. The modern suburban model emerged in the 19th century as elite enclaves enabled by but proliferated after due to economic prosperity, government policies, and technological advancements in construction. In the United States, the GI Bill's provision of low-cost mortgages to veterans, combined with federal highway investments under the Interstate Highway Act of 1956, drove rapid outward migration, elevating the suburban population share from 19.5% in 1940 to over 30% by the 1950s. This boom addressed wartime housing shortages through mass-produced, standardized homes, attracting predominantly young, white middle-class families seeking affordability and separation from urban congestion, though it also perpetuated via restrictive covenants and lending practices. Globally, suburban expansion has characterized much of the urban growth since the mid-20th century, with peripheral low-density development outpacing central densification in many regions. As of 2018, 55% of the world's resided in urban areas, projected to reach 68% by 2050, with a substantial portion of this increase occurring in suburban forms that consume more land and strain . In developing countries, similar patterns arise from rising middle-class aspirations for private , though often constrained by informal settlements rather than planned communities. Recent trends include suburbs with mixed-use developments to mitigate sprawl's environmental costs, such as higher use for , while preserving benefits like elevated property values and lower crime rates compared to dense urban zones.

Exurban and Rural Residential Zones

Exurban residential zones consist of low-density developments situated beyond suburban boundaries but within the commuting shed of , where at least 20 percent of workers commute to urbanized cores, blending single-family homes with preserved open spaces and agricultural uses. These areas exhibit population densities typically below suburban levels, often featuring larger parcels—frequently one acre or more—to accommodate equestrian facilities, hobby farms, or recreational amenities while maintaining a semi-rural aesthetic. Unlike denser suburbs, exurban zones prioritize spatial separation from urban , with infrastructure like roads and utilities extended sparingly to minimize environmental disruption and fiscal burdens on local governments. Rural residential zones, by distinction, designate lands for sparse amid dominant agricultural, , or activities, enforcing minimum lot sizes—often five acres or greater—to safeguard rural character and prevent fragmentation of farmland. These zones limit non-residential development, such as commercial or industrial uses, to preserve low-intensity settlement patterns that support self-sufficient lifestyles, including on-site water systems and septic facilities rather than . Planning regulations in such areas emphasize buffering urban expansion, with tools like agricultural or conservation easements restricting subdivision to maintain services and agricultural viability. Demographic shifts have accelerated exurban growth, particularly in the United States, where suburbs and exurbs netted 2 million domestic migrants from urban cores between 2010 and 2020, driven by preferences for affordable larger homes and reduced congestion amid rising post-2020. Exurban construction surged by approximately 20 percent in 2021, outpacing suburban rates, as households sought balances between urban access and rural tranquility. Rural zones, however, experience slower residential , with often capping densities to under one dwelling per ten acres in prime agricultural districts, reflecting causal priorities of land preservation over expansion. In both, property values hinge on proximity to urban hubs for exurbs versus intrinsic rural amenities like for the latter, though exurban parcels command premiums due to commuter —evident in U.S. counties where exurban appreciated 15-25 percent faster than rural counterparts from 2010-2020.

Planning and Regulation

Fundamental Planning Principles

Residential planning principles prioritize efficient land allocation, human-scale , and empirical correlations between elements and resident outcomes like mobility, , and resource use. These derive from analyses of settlement functionality, where causal factors such as street configuration influence and , while affects demands and commute distances. Core tenets include interconnected networks over isolated pods to minimize travel inefficiencies and enhance informal oversight, reducing isolation-linked issues like delayed emergency response. Street layout forms the backbone, with hierarchical, permeable grids—covering at least 25-30% of area—enabling block perimeters under 1 km for feasibility and distributing loads to curb congestion. Evidence from indicates connected streets correlate with 20-30% higher walking rates and lower per-capita vehicle miles, as they foster shorter routes and incidental activity, though excessive arterials can elevate speeds and accident risks without buffers. Cul-de-sacs, by contrast, limit through- but fragment connectivity, potentially increasing navigation errors and isolation in low-density contexts. Density calibration balances population thresholds against service viability, targeting 80-150 persons in urban zones to sustain local amenities without sprawling costs that inflate utility extensions by factors of 2-4 . Higher densities empirically boost via proximity—e.g., 15-20% more steps in connected high-density blocks—but demand ventilation standards and open-space ratios (10-20% of area) to mitigate heat islands and respiratory strains observed in underspaced developments. Low-density sprawl, conversely, correlates with doubled infrastructure spending and elevated emissions from longer commutes averaging 20-50% more fuel use. Open-space integration mandates accessible greens—within 400 m of dwellings—for and flood mitigation, with layouts orienting buildings for and privacy via setbacks of 5-10 m. embeds "eyes " through front-facing units and lit paths, empirically halving opportunistic crimes via visibility gradients. scales to projected loads, with /sewer capacities matching to avert overloads seen in underplanned expansions. Housing diversity—mixing unit sizes and tenures—counters segregation, as uniform stock correlates with 15-25% lower social ties in monocultural zones. embeds passive efficiencies, like orientation reducing heating needs by 20-30%, grounded in lifecycle cost data. Zoning frameworks regulate by designating areas for specific purposes, such as residential, to mitigate conflicts between incompatible activities like industrial operations and housing. In the United States, the earliest residential ordinance emerged in in 1908, establishing districts to separate homes from factories and railroads, driven by concerns over noise, pollution, and property value depreciation. This approach formalized in New York City's 1916 comprehensive resolution, which introduced height and setback requirements to preserve light and air in dense urban residential zones. The prevailing model, Euclidean zoning, derives its name from the 1926 Supreme Court case Village of Euclid v. Ambler Realty Co., which upheld municipalities' authority to exclude non-residential uses from designated areas, including apartments from single-family zones, as a valid exercise of police power for and welfare. Under this system, residential zones are stratified by density—such as R-1 for single-family detached homes limiting units to one per lot—and impose constraints like minimum lot sizes (often 5,000–10,000 square feet in suburban areas), setbacks from property lines (typically 20–50 feet), and height caps (e.g., 35 feet for two stories). These rules, administered locally via ordinances, require variances or rezoning for deviations, processes that can delay projects by months or years through public hearings and administrative reviews. Legal constraints extend beyond zoning to building codes enforcing structural integrity, fire safety, and utilities. The International Building Code (IBC), adopted variably by U.S. states since its 2000 inception, mandates residential constructions meet standards like load-bearing capacities (e.g., 40 pounds per square foot live load for floors) and egress requirements (minimum 0.33-inch clear opening per occupant for windows). Permits are mandatory for new builds or alterations, with inspections verifying compliance; non-adherence incurs fines up to $1,000 per violation daily in many jurisdictions. Environmental overlays, such as floodplain restrictions under the U.S. (established 1968), prohibit development in high-risk zones without elevation, while historic preservation laws in districts like those under the National Register (1966) constrain alterations to maintain architectural integrity. Internationally, frameworks diverge: Germany's Bebauungsplan integrates zoning with detailed site plans under federal building codes (BauGB 1960), allowing mixed-use in residential areas with performance metrics for density rather than strict separation, contrasting U.S. rigidity. In the UK, the Town and Country Planning Act 1947 centralizes control via local plans emphasizing use classes (e.g., Class C3 for dwellings), with fewer density mandates but stringent environmental impact assessments. These systems, while varying, universally constrain residential development to balance growth with externalities, though U.S. Euclidean models have empirically correlated with reduced housing supply—e.g., single-family zoning covering 75% of residential land in major metros by 2020—elevating costs via restricted density.

Development Processes and Market Dynamics

The development of residential areas typically proceeds through sequential stages, beginning with pre-development activities such as land acquisition, , and feasibility studies to assess viability based on projected costs, revenues, and regulatory hurdles. Developers evaluate site suitability, including , access to utilities, and proximity to centers, while conducting environmental impact assessments to mitigate risks like or flood zones. Financing arrangements are secured during this phase, often involving equity from investors and debt from banks, with feasibility hinges on models projecting returns exceeding 15-20% in competitive markets. Once entitlements and approvals are obtained—processes that can span 1-3 years depending on local regulations— and follow, incorporating architectural plans compliant with building codes and input to optimize and amenities. then commences, involving site preparation, installation (e.g., roads, sewers), and building erection, typically lasting 12-24 months for mid-sized subdivisions and managed via general contractors to control costs averaging $150-300 per square foot in the U.S. for single-family homes. Post-construction phases include , , and , where units are leased or sold, with certificates issued upon inspections confirming adherence to safety standards. Market dynamics profoundly shape these processes, driven primarily by supply-demand imbalances, where population growth and household formation rates dictate development pace; for instance, U.S. net household additions averaged 1.1 million annually from 2010-2020, fueling suburban expansions but slowing amid 2023-2025 high interest rates exceeding 7% that elevated mortgage costs and deterred buyer demand. Economic cycles amplify volatility: expansions boost construction via job creation and income rises, as seen in post-2009 recovery where housing starts rebounded from 554,000 units in 2009 to over 1.4 million by 2020, while recessions contract activity through credit tightening. Government policies, including tax incentives like mortgage interest deductions or zoning reforms, further influence site selection and density, with restrictive land-use rules in coastal U.S. cities correlating to 30-50% higher home prices via reduced supply. Demographic shifts, such as millennial household formation peaking around 2025 and aging-in-place trends among , redirect development toward multifamily urban infill or age-restricted communities, while migration patterns—e.g., Sun Belt inflows adding 1-2% annual population growth in states like and —concentrate activity in exurban fringes. Interest rate fluctuations exert causal leverage on financing feasibility, with each 1% hike potentially reducing starts by 10-15% through higher borrowing costs, as evidenced in 2022-2024 data showing a drop from 1.8 million to under 1.4 million units amid rate surges. Developers mitigate risks via forward contracts or phased rollouts, but oversupply phases, triggered by speculative booms, can lead to price corrections of 20-30%, underscoring the interplay of macroeconomic signals and local absorptive capacity.

Economic Dimensions

Housing Supply and Market Forces

Housing supply in residential areas is primarily determined by the rate of new , which responds to market signals but is often constrained by regulatory barriers, costs, and production factors such as labor and materials. In economic terms, supply elasticity—the responsiveness of housing output to changes—varies significantly by location, with inelastic supply in regulated markets leading to amplified volatility and persistent shortages. Empirical studies indicate that local land-use regulations, including restrictions favoring single-family homes, reduce construction activity and lower supply elasticity, thereby elevating prices without commensurate increases in affordability. Zoning frameworks exemplify a distortion, as they limit and building types, artificially constraining developable and raising marginal production costs. A comprehensive review attributes up to 78% of price variations in U.S. markets to such regulations, which prioritize existing values over new supply, often through exclusionary practices that deter multifamily development. Reforms easing these restrictions, such as allowing higher , have been associated with modest supply increases of approximately 0.8% within three to nine years, though effects on prices remain limited without broader . In markets with higher elasticity, such as historically less-regulated Sunbelt cities, supply responds more readily to demand pressures, mitigating bubbles and supporting affordability relative to coastal metros. In the United States, chronic under-supply has resulted in an estimated deficit of 4.5 to 4.9 million units as of 2023-2024, driven by post-2008 construction slowdowns and persistent regulatory hurdles that have kept annual housing starts below household formation rates. Median home prices reached $412,300 in the second quarter of 2024, with inventory at just 3.2 months' supply—far below the balanced market threshold of five to six months—exacerbating affordability strains amid population growth and income gains. Market forces like rising interest rates further dampen demand responsiveness, but supply-side inelasticity, rooted in zoning and permitting delays, sustains upward price pressure independent of monetary policy. Globally, similar dynamics prevail, with supply shortages in urban centers attributed to planning restrictions, land scarcity, and input costs, as seen in Australia's zoning-induced deficits and Europe's historic preservation mandates that curb density. In less-regulated contexts, such as parts of prior to recent interventions, market-driven construction has outpaced demand, stabilizing rents and prices, underscoring the causal primacy of regulatory freedom over exogenous demand shocks in determining residential market outcomes.

Property Valuation and Investment Returns

Property valuation in residential areas primarily relies on the sales comparison approach, which estimates value by analyzing recent sales of comparable in the vicinity, adjusted for differences in size, condition, and features. This method dominates for single-family homes and condominiums due to abundant market transaction data, with appraisers typically selecting three to five comparables within a similar neighborhood. The cost approach, calculating replacement cost minus plus land value, serves as a secondary method for unique or new constructions, while the income approach—capitalizing net operating income—is less common but applied to rental-focused like multi-family units. Key determinants of residential property values include location-specific attributes such as proximity to centers, quality, and low rates, which can elevate prices by 10-20% compared to less desirable areas. Economic factors like interest rates and supply-demand imbalances exert broader influence; for instance, rate hikes from 2022 to 2023 increased costs, suppressing demand and slowing appreciation in many U.S. markets. Property-specific elements, including square footage, age, maintenance condition, and upgrades like modern kitchens, further modulate values, with well-maintained homes often commanding 5-15% premiums over comparables in disrepair. Investment returns from residential properties derive from capital appreciation, rental income yields, and tax benefits, though net returns vary by leverage and holding period. Historical data from 1870 to 2015 indicate U.S. residential delivered average annual real total returns of approximately 7%, encompassing both price gains and imputed rents, outperforming bonds but trailing equities in volatility-adjusted terms. Over shorter horizons, such as 1972-2023, direct ownership yields averaged 4-8% annually from appreciation alone, augmented by gross yields of 3-6% in major metros, though after expenses like (1-2% of value yearly) and vacancies, net internal rates of return typically range 5-10% for leveraged purchases. rates, a key metric dividing net operating by property value, averaged 5-7% for single-family rentals in 2023, reflecting potential relative to purchase price. Risks temper these returns, including market cyclicality—evident in the downturn when U.S. home prices fell 20-30% nationally—and illiquidity, as selling residential assets can take 3-6 months amid transaction costs of 5-10% (commissions, closing fees). Tenant-related issues, such as defaults or , erode yields, while volatility amplifies leverage risks; a 1% rate rise can reduce affordability and force distressed sales. Environmental hazards like flooding in coastal zones or regulatory changes, including zoning restrictions, further depress values in susceptible areas by 5-15%. Investors mitigate these through diversification, on local comparables, and conservative financing, ensuring returns align with opportunity costs against alternatives like .

Contributions to Broader Economies

Residential and development directly bolster national and local economies by contributing to through new builds, renovations, and related investments, averaging 3-5% of GDP in the United States. Including services like owners' , the sector's overall impact expands to 15-18% of GDP, reflecting both and ongoing consumption tied to occupancy. These inputs support upstream industries such as materials production and , creating indirect economic linkages that enhance and output. Multiplier effects from residential development amplify these gains, particularly during the building phase, where each project generates jobs, wages, and secondary spending. For example, constructing 100 multifamily units yields an average of 161 jobs and $11.7 million in local economic activity within the first year, with spillovers into non-construction sectors via worker expenditures. Nationally, communities and their residents add $3.9 trillion annually to the U.S. economy, equivalent to $52.8 billion per 100 units built, through combined direct, indirect, and induced effects. Ongoing contributions stem from revenues, which funded 30% of U.S. local general revenues in 2021, totaling $609 billion, with residential properties forming the predominant base for these levies. These funds sustain public services like and , enabling , while resident proximity to employment centers facilitates labor market and reduces commuting costs, indirectly supporting industrial output.

Social and Demographic Patterns

Community Formation and Social Cohesion

In residential areas, communities form primarily through repeated interpersonal interactions enabled by physical proximity, shared public spaces, and organized local institutions such as homeowners' associations or neighborhood councils. These mechanisms foster emergent social networks where residents engage in mutual aid, informal surveillance, and collective problem-solving, as documented in studies of small-scale residential communities in regions like South Korea, where network density correlates with voluntary participation rates exceeding 60% in cohesive groups. Empirical evidence from urban planning research emphasizes that initial formation often hinges on self-selection by residents seeking similarity in lifestyle or values, leading to voluntary clustering that strengthens early bonds. Social cohesion, defined as the presence of trust, reciprocity, and shared norms among neighbors, is measurably higher in demographically homogeneous residential settings. Peer-reviewed analyses, including Robert Putnam's 2007 examination of U.S. neighborhoods, reveal that ethnic diversity prompts residents across racial groups to "hunker down," reducing trust and by up to 20-30% in diverse areas compared to homogeneous ones. A 2020 of 90 studies across contexts confirms a statistically significant negative association between ethnic diversity and social trust (effect size ≈ -0.15), attributing this to perceived threats and reduced informal interactions rather than mere proximity. Socioeconomic uniformity similarly bolsters cohesion, with homogeneous neighborhoods reporting 15-25% higher rates of neighborly cooperation, as homogeneity minimizes conflicts over norms and . Physical design elements critically influence cohesion by shaping opportunities for interaction; for instance, walkable layouts and front-facing communal areas in single-family residential zones increase spontaneous encounters by 40% relative to isolated cul-de-sac developments. Well-maintained green spaces and low-disorder environments further promote gatherings, with studies showing that neighborhoods investing in such amenities experience 10-20% elevations in reported trust and reduced isolation. Conversely, in low-density residential areas diminishes cohesion by limiting accessible interaction sites, leading to weaker networks and higher reliance on digital rather than face-to-face ties. These patterns hold across empirical datasets, underscoring causal links between design-induced visibility and sustained reciprocity, independent of broader societal trends like declining overall noted since the 1960s.

Lifestyle and Family Structure Influences

Households with dependent children predominantly select suburban and exurban residential areas, which feature single-family detached homes with yards and lower densities conducive to -oriented lifestyles. This preference drives the proliferation of spacious, low-density neighborhoods designed for child-rearing, access, and vehicle-dependent . Empirical data indicate that large urban counties lost over 8% of their under-five population between April 2020 and July 2024, as families relocated to suburbs offering greater affordability and safety for raising children. Such migrations reinforce suburban expansion, where often prioritizes family-scale lots over high-rise alternatives. The surge in single-person households, reaching 27.6% of U.S. occupied households by —a quadrupling from 7.7% in 1940—propels development of compact, urban-centric residential forms like studio apartments and micro-units. These individuals, often young professionals or retirees, favor walkable city environments with proximity to amenities, stimulating infill construction and mixed-use districts rather than expansive tracts. This demographic shift elevates demand for rental-heavy, high-density zones, altering urban residential landscapes toward efficiency over expansiveness. Declining rates, hitting a record low in the U.S. by September 2025 amid soaring costs, diminish pressure for multi-bedroom dwellings, curbing new suburban single-family builds while boosting smaller-unit supply in established areas. density causally constrains size, with women in apartments exhibiting markedly lower than those in single-family homes, as limited space discourages additional children. Conversely, rising multi-generational households, driven by affordability needs in 2025, foster residential designs incorporating in-law suites or larger adaptable homes in peripheral zones, enhancing suburban versatility for extended kin networks.

Migration and Demographic Shifts

Migration has profoundly influenced the demographic composition of residential areas worldwide, with internal movements often reshaping urban and suburban landscapes through rural-to-urban flows. , domestic migration contributed to population declines in major metropolitan counties during the early , as residents relocated to lower-density suburbs and rural areas, with net out-migration from urban cores exceeding 1 million between 2020 and 2022. However, by 2023, this trend reversed in many populous counties, with inbound domestic migration rebounding due to returning workers and preferences for urban amenities, stabilizing residential populations in high-density neighborhoods. Globally, has accelerated , with the urban population share rising from 55% in 2018 to projections of 60% by 2030, concentrating younger cohorts in residential districts of expanding cities in and . International migration has driven sharper demographic shifts in residential areas, particularly through the settlement of immigrants in gateway neighborhoods, altering ethnic and socioeconomic profiles. U.S. data indicate that international migration accounted for nearly 80% of the 2.8 million population increase from 2023 to 2024, with immigrants disproportionately concentrating in urban and suburban residential zones of states like and , where foreign-born shares in metro areas grew by 2-5 percentage points over the decade. This influx has offset domestic out-migration losses in 85% of major metros, but empirical studies show correlated native-born exits from neighborhoods experiencing rapid immigrant growth, leading to reduced white and higher-educated resident proportions in affected areas. In European contexts, such as and , nationality-based segregation indices for immigrants rose modestly from 2008 to 2018, reflecting preferences for co-ethnic residential clustering amid housing market pressures. These migrations have yielded mixed outcomes in residential demographic stability, with increased diversity alongside persistent patterns of spatial sorting. U.S. segregation indices between 2010 and 2020 declined by 7-14% across most racial pairs, yet Black-white dissimilarity remained above 50 in many metros, indicating that while overall integration advanced, immigrant-driven changes often reinforced ethnic enclaves in lower-income residential pockets. Native responses, including "" documented in studies of high-immigration districts, have elevated housing turnover and price volatility in transitioning neighborhoods, with average values dropping relative to unaffected areas due to perceived cultural mismatches. In rural U.S. counties, recent net domestic in-migration surged to 0.35% annually post-2020, attracting retirees and remote workers to exurban residential developments, countering aging demographics but straining local . Such shifts underscore migration's role in both revitalizing and polarizing residential demographics, with causal links to economic opportunities and social preferences overriding policy interventions in many cases.

Environmental and Sustainability Factors

Resource Use and Infrastructure Demands

Residential areas impose substantial demands on natural resources and public infrastructure to support daily habitation, including water supply, energy consumption, and waste management systems. In the United States, the average person uses 82 gallons of water per day for household purposes, with outdoor uses such as lawn irrigation accounting for up to 30% of total residential consumption nationally, though this rises significantly in arid regions. Energy demands are similarly intensive, as the residential sector consumed 18.4 quadrillion Btu of primary energy in 2024, representing 19.6% of total U.S. energy use, primarily for space heating, cooling, water heating, and appliances. Municipal solid waste generation from households contributes to broader environmental pressures, with the U.S. producing 4.9 pounds of waste per person per day in 2018, totaling 292.4 million tons annually, much of which originates from residential sources like food scraps, packaging, and yard waste. Energy consumption varies markedly by housing typology within residential areas, with low-density single-family detached homes exhibiting higher per-household usage than multifamily apartments due to greater exposed surface areas for loss and individual utility connections. In 2020, U.S. households in single-family detached homes consumed nearly three times more total annually than those in apartments, while multifamily units used approximately half the of detached homes when adjusted for efficiency factors like reduced transportation needs. Electricity patterns follow suit, with single-family homes in warmer climates like the averaging higher annual use than apartments in cooler regions such as the Northeast, driven by and larger living spaces. These disparities underscore how residential influences resource intensity, as compact developments enable shared walls and centralized systems that minimize thermal losses and distribution inefficiencies. Infrastructure requirements for residential areas escalate with sprawl, as low-density configurations necessitate extensive networks of roads, sewers, mains, and power lines , elevating capital and maintenance costs compared to compact urban forms. Studies indicate that suburban development can increase expenses by spreading services over larger areas, with costs for utilities and roadways often 30-50% higher in sprawling residential zones than in denser alternatives, contributing to an estimated $1 trillion annual national burden from inefficient land-use patterns. Compact residential designs, by contrast, lower these demands through , reducing the length of pipelines and paving needed to serve equivalent populations, though they may face higher upfront urban land acquisition expenses. This dynamic highlights a causal : while low-density residential areas offer spatial amenities, they amplify long-term fiscal and resource strains on municipalities by diluting the tax base relative to service delivery.

Sprawl Versus Compact Development Trade-offs

Urban , characterized by low-, automobile-oriented residential expansion into peripheral areas, contrasts with compact development, which emphasizes higher-, mixed-use urban forms with walkable access to amenities. Empirical analyses indicate that compact patterns generally reduce vehicle miles traveled (VMT), with studies showing that doubling residential can lower annual VMT by approximately 2,200 miles per person, thereby decreasing transportation-related . However, this correlation weakens when controlling for socioeconomic factors and transit availability, as alone does not fully explain travel behavior reductions. On land use efficiency, compact development minimizes conversion of undeveloped land, preserving ecosystems and reducing compared to sprawl, which consumes farmland and natural areas at rates up to 3.7 times faster than urban densification in analyzed cities from 2000 to 2020. Sprawl, conversely, disperses impervious surfaces over larger areas, exacerbating runoff and flood risks while increasing total regional heat exposure, with sprawling metropolitan regions experiencing over twice the rate of relative to compact ones. Compact forms intensify urban heat islands in cores due to building density, though mitigation via can offset this, and sprawl's spread-out low-rises often yield higher per capita energy demands from inefficient single-family heating and cooling. Infrastructure demands further highlight trade-offs, as sprawl elevates costs for roads, utilities, and services—averaging $750 annually in highly sprawled U.S. cities versus half that in compact ones—due to extended networks serving fewer residents per unit area. Systematic reviews of over 300 studies find compact growth yields positive environmental outcomes in 69% of cases for pollution control, transport , and energy efficiency, though benefits diminish without complementary policies like transit investment. Sprawl, while enabling larger private green spaces, fragments regional and amplifies cumulative resource extraction, underscoring a causal tension between localized amenities and broader ecological .

Controversies and Policy Debates

NIMBY Resistance Versus Pro-Development Advocacy

(Not In My Backyard) opposition manifests as localized resistance to new residential developments, often citing concerns such as increased , strain on public schools, degradation of neighborhood aesthetics, and potential declines in existing property values. Proponents argue these measures preserve community character and , but empirical analyses indicate that such restrictions primarily serve to limit supply, thereby inflating prices and exacerbating affordability issues rather than addressing underlying needs. In , for instance, NIMBY-driven barriers have contributed to a statewide housing shortage estimated at 3.8 to 8.2 million units as of 2025, with median home prices reaching 2.5 times the national average in 2022. In contrast, pro-development advocates, often aligned with YIMBY (Yes In My Backyard) movements, emphasize first-principles economics: prices are fundamentally determined by , and regulatory constraints like and height limits artificially suppress supply. Studies confirm that stringent correlates with higher costs, with land-use controls explaining a dominant share of price escalation beyond construction fundamentals. Reforms such as upzoning—allowing higher densities—have demonstrated potential to boost supply; a 2023 analysis of U.S. relaxations found an associated 0.8% increase in units three to nine years post-reform, though effects vary by design and location. Upzoning in transit-accessible areas, as in Chicago's reforms, sometimes elevates nearby property values due to anticipated development, but broader supply increases tend to moderate long-term growth. The debate intensifies in high-demand regions, where activism has thwarted state-level interventions; California's Senate Bill 827, aimed at easing density restrictions near transit in 2018, failed amid local opposition prioritizing incumbent homeowners' interests over regional needs. Economic modeling underscores causal realism: without , persistent undersupply drives out-migration and , as evidenced by California's net loss of over three million taxpayers since 1990 due to unaffordability. Pro-development coalitions counter that targeted infrastructure investments can mitigate concerns like , but data from relaxed regimes show no disproportionate negative impacts on existing residents' welfare when supply expands. This tension reflects a broader policy tradeoff, where short-term local preferences often yield long-term societal costs in the form of reduced mobility and heightened inequality.

Affordability Crises and Regulatory Impacts

Housing affordability crises in residential areas have intensified globally, particularly in urban and suburban markets, where median home prices have outpaced wage growth for decades. In the United States, for instance, the national median home price reached approximately $412,000 in 2024, while the median household income hovered around $74,000, resulting in a price-to-income ratio exceeding 5.5, far above the historical norm of 3. This disparity has led to a shortage estimated at 3.8 to 4 million housing units, constraining supply relative to demand from population growth and household formation. Renters face acute burdens, with 22.6 million U.S. households—over half of all renters—classified as cost-burdened in 2023, spending more than 30% of income on housing. Similar patterns emerge in high-demand regions like California and the Northeast, where affordability indices have declined sharply due to persistent undersupply. Regulatory restrictions on supply constitute a primary causal driver of these crises, as evidenced by empirical analyses linking land-use controls to elevated prices. ordinances, which often mandate low-density single-family configurations, minimum lot sizes, and height limits, artificially constrain developable land and permissible units, reducing overall . A comprehensive review of U.S. metropolitan areas found that stringent regulations correlate with 20-50% higher costs, as they elevate expenses through prolonged permitting processes and compliance requirements. For example, in cities, regulatory barriers account for up to 40% of the gap between costs and market prices, per econometric models isolating supply elasticities. These effects disproportionately burden lower-income households by limiting multifamily and affordable unit , thereby inflating rents and barriers without commensurate public benefits. Environmental and procedural regulations further exacerbate supply shortages by imposing delays and costs that deter development. Impact fees, wetland protections, and mandatory reviews under laws like the U.S. can extend project timelines by years, increasing holding costs and financing burdens. Studies indicate that such barriers reduce housing starts by 10-20% in regulated jurisdictions, contributing to price escalations that persist even after demand shocks subside. Reforms easing these constraints, such as upzoning to permit higher densities, have demonstrably boosted supply: one analysis of U.S. cities post-reform showed a 0.8% increase in units three to nine years later, modestly alleviating price pressures. However, entrenched regulations often reflect interests rather than , as basic economic principles predict that inelastic supply amplifies price volatility from demographic or interest-rate fluctuations. While some academic sources attribute crises primarily to income inequality or , rigorous supply-focused research underscores regulations' outsized role, given their direct interference with market responses to .

Claims of Segregation and Equity Interventions

Claims of racial residential segregation in the United States persist despite legal prohibitions since the Fair Housing Act of 1968, with the Black-White dissimilarity index—a measure of evenness in —averaging around 59 in 2020 across major metropolitan areas, indicating moderate to high segregation levels comparable to the . This index reflects the percentage of Black or White residents who would need to relocate for perfect integration, though it has declined from peaks above 70 in the 1970s due to and rising Black incomes. Economic segregation, however, has intensified, with 28% of lower-income households residing in majority lower-income census tracts in 2010, up from 23% in 1980, driven by widening income inequality rather than racial factors alone. Proponents of segregation claims often attribute persistence to historical and ongoing , yet empirical analyses highlight voluntary factors, including racial preferences for co-ethnic neighbors and socioeconomic sorting, as primary drivers in contemporary patterns. Equity interventions, such as the Department of Housing and Urban Development's Affirmatively Furthering Fair Housing (AFFH) rule reinstated in 2021, aim to counteract segregation by requiring localities to assess and remedy barriers to integrated , including restrictions that limit multifamily development. The Moving to Opportunity (MTO) experiment, a randomized program from 1994 to 2010, successfully relocated families to lower-poverty neighborhoods and yielded long-term benefits like improved and reduced among youth, but achieved only modest as participants often selected areas aligning with cultural or school preferences rather than fully diverse ones. Similarly, mandates for affordable units in new developments have expanded access in some cities, yet studies show limited impact on overall segregation indices, as economic disparities sustain sorting by income and family structure. Critics of these interventions argue they overlook causal mechanisms like individual choice and market dynamics, with from multi-city surveys indicating that even when is controlled for, Blacks exhibit in-group preferences comparable to , contributing to stable segregation without invoking as the sole explanation. Upzoning reforms in places like (2019) and (2019) have increased permitted density to boost supply and affordability, potentially easing economic segregation by enabling lower-income households to access middle-class areas, though early reveals uneven uptake due to costs and locational preferences. Academic sources frequently linking segregation to disparities, such as higher mortality rates, face scrutiny for correlational rather than causal , as confounding factors like family stability and behavioral patterns explain much of the variance independently of neighborhood composition. Overall, while interventions have mitigated extreme isolation, persistent patterns underscore that preferences and economic incentives, not remediable , dominate residential outcomes in a free society.

References

Add your contribution
Related Hubs
User Avatar
No comments yet.