
Community hub
Recent from talks
Contribute something
Nothing was collected or created yet.
Credit default swap
View on Wikipedia


A credit default swap (CDS) is a financial swap agreement that the seller of the CDS will compensate the buyer in the event of a debt default (by the debtor) or other credit event.[1] That is, the seller of the CDS insures the buyer against some reference asset defaulting. The buyer of the CDS makes a series of payments (the CDS "fee" or "spread") to the seller and, in exchange, may expect to receive a payoff if the asset defaults.
In the event of default, the buyer of the credit default swap receives compensation (usually the face value of the loan), and the seller of the CDS takes possession of the defaulted loan or its market value in cash. However, anyone can purchase a CDS, even buyers who do not hold the loan instrument and who have no direct insurable interest in the loan (these are called "naked" CDSs). If there are more CDS contracts outstanding than bonds in existence, a protocol exists to hold a credit event auction. The payment received is often substantially less than the face value of the loan.[2]
Overview
[edit]Credit default swaps in their current form [vague] have existed since the early 1990s and increased in use in the early 2000s. [citation needed] By the end of 2007, the outstanding CDS amount was $62.2 trillion,[3] falling to $26.3 trillion by mid-year 2010[4] and reportedly $25.5[5] trillion in early 2012.
As of 2009, CDSs were not traded on an exchange and there was no required reporting of transactions to a government agency.[6]
During the 2008 financial crisis, the lack of transparency in this large market became a concern to regulators as it could pose a systemic risk.[7][8][9] In March 2010, the Depository Trust & Clearing Corporation (see Sources of Market Data) announced it would give regulators greater access to its credit default swaps database.[10] There was "$8 trillion notional value outstanding" as of June 2018.[11]
Description
[edit]

A "credit default swap" (CDS) is a credit derivative contract between two counterparties. The buyer makes periodic payments to the seller, and in return receives a payoff if an underlying financial instrument defaults or experiences a similar credit event.[7][12][13]
The CDS may refer to a specified loan or bond obligation of a "reference entity", usually a corporation or government.[14] The reference entity is not a party to the contract. The buyer makes regular premium payments to the seller, the premium amounts constituting the "spread" charged in basis points by the seller to insure against a credit event. If the reference entity defaults, the protection seller pays the buyer the par value of the bond in exchange for physical delivery of the bond, although settlement may also be by cash or auction.[7][12]
A default is often referred to as a "credit event" and includes such events as failure to pay, restructuring and bankruptcy, or even a drop in the borrower's credit rating.[7] CDS contracts on sovereign obligations also usually include as credit events repudiation, moratorium, and acceleration.[6] Most CDSs are in the $10–$20 million range[14] with maturities between one and 10 years. Five years is the most typical maturity.[15][16]
An investor or speculator may "buy protection" to hedge the risk of default on a bond or other debt instrument, regardless of whether such investor or speculator holds an interest in or bears any risk of loss relating to such bond or debt instrument. In this way, a CDS is similar to credit insurance, although CDSs are not subject to regulations governing traditional insurance. Also, investors can buy and sell protection without owning debt of the reference entity. These "naked credit default swaps" allow traders to speculate on the creditworthiness of reference entities. CDSs can be used to create synthetic long and short positions in the reference entity.[8] Naked CDS constitute most of the market in CDS.[17][18] In addition, CDSs can also be used in capital structure arbitrage.[citation needed]
As an example, imagine that an investor buys a CDS from AAA-Bank, where the reference entity is Risky Corp. The investor—the buyer of protection—will make regular payments to AAA-Bank—the seller of protection. If Risky Corp defaults on its debt, the investor receives a one-time payment from AAA-Bank, and the CDS contract is terminated.[citation needed]
If the investor owns Risky Corp's debt (i.e., is owed money by Risky Corp), a CDS can act as a hedge. But investors can also buy CDS contracts referencing Risky Corp debt without actually owning any Risky Corp debt. This may be done for speculative purposes, to bet against the solvency of Risky Corp in a gamble to make money, or to hedge investments in other companies whose fortunes are expected to be similar to those of Risky Corp (see Uses).
If the reference entity (i.e., Risky Corp) defaults, one of two kinds of settlement can occur:
- the investor delivers a defaulted asset to Bank for payment of the par value, which is known as physical settlement;
- AAA-Bank pays the investor the difference between the par value and the market price of a specified debt obligation (even if Risky Corp defaults there is usually some recovery, i.e., not all the investor's money is lost), which is known as cash settlement.
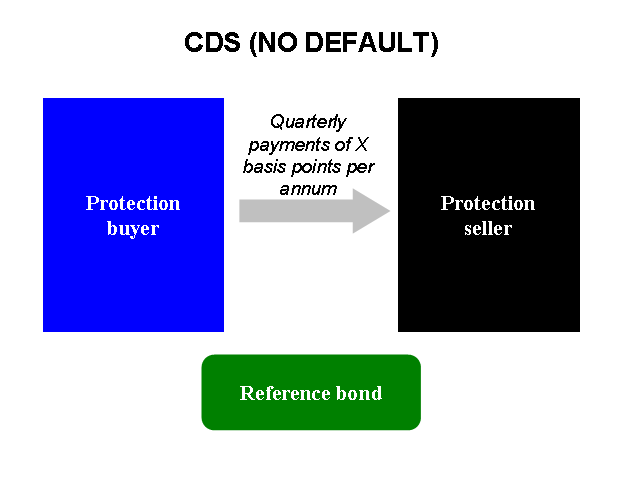
The "spread" of a CDS is the annual amount the protection buyer must pay the protection seller over the length of the contract, expressed as a percentage of the notional amount. For example, if the CDS spread of Risky Corp is 50 basis points, or 0.5% (1 basis point = 0.01%), then an investor buying $10 million worth of protection from AAA-Bank must pay the bank $50,000. Payments are usually made on a quarterly basis, in arrear. These payments continue until either the CDS contract expires or Risky Corp defaults.[citation needed]
All things being equal, at any given time, if the maturity of two credit default swaps is the same, then the CDS associated with a company with a higher CDS spread is considered more likely to default by the market, since a higher fee is being charged to protect against this happening. However, factors such as liquidity and estimated loss given default can affect the comparison. Credit spread rates and credit ratings of the underlying or reference obligations are considered among money managers to be the best indicators of the likelihood of sellers of CDSs having to perform under these contracts.[7]
Differences from insurance
[edit]CDS contracts have obvious similarities with insurance contracts because the buyer pays a premium and, in return, receives a sum of money if an adverse event occurs.
However, there are also many differences, the most important being that an insurance contract provides an indemnity against the losses actually suffered by the policy holder on an asset in which it holds an insurable interest. By contrast, a CDS provides an equal payout to all holders, calculated using an agreed, market-wide method. The holder does not need to own the underlying security and does not even have to suffer a loss from the default event.[19][20][21][22] The CDS can therefore be used to speculate on debt objects.
The other differences include:
- The seller might in principle not be a regulated entity (though in practice most are banks);
- The seller is not required to maintain reserves to cover the protection sold (this was a principal cause of AIG's financial distress in 2008; it had insufficient reserves to meet the "run" of expected payouts caused by the collapse of the housing bubble);
- Insurance requires the buyer to disclose all known risks, while CDSs do not (the CDS seller can in many cases still determine potential risk, as the debt instrument being "insured" is a market commodity available for inspection, but in the case of certain instruments like CDOs made up of "slices" of debt packages, it can be difficult to tell exactly what is being insured);
- Insurers manage risk primarily by setting loss reserves based on the Law of large numbers and actuarial analysis. Dealers in CDSs manage risk primarily through hedging with other CDS deals and in the underlying bond markets;
- CDS contracts are generally subject to mark-to-market accounting, introducing income statement and balance sheet volatility while insurance contracts are not;
- Hedge accounting may not be available under US Generally Accepted Accounting Principles (GAAP) unless the requirements of FAS 133 are met. In practice this rarely happens;
- To cancel the insurance contract, the buyer can typically stop paying premiums, while for CDS the contract needs to be unwound.
Risk
[edit]When entering into a CDS, both the buyer and seller of credit protection take on counterparty risk:[7][16][23]
- The buyer takes the risk that the seller may default. If AAA-Bank and Risky Corp. default simultaneously ("double default"), the buyer loses its protection against default by the reference entity. If AAA-Bank defaults but Risky Corp. does not, the buyer might need to replace the defaulted CDS at a higher cost.
- The seller takes the risk that the buyer may default on the contract, depriving the seller of the expected revenue stream. More importantly, a seller normally limits its risk by buying offsetting protection from another party — that is, it hedges its exposure. If the original buyer drops out, the seller squares its position by either unwinding the hedge transaction or by selling a new CDS to a third party. Depending on market conditions, that may be at a lower price than the original CDS and may therefore involve a loss to the seller.
In the future, in the event that regulatory reforms require that CDS be traded and settled via a central exchange/clearing house, such as ICE TCC, there will no longer be "counterparty risk", as the risk of the counterparty will be held with the central exchange/clearing house.[citation needed]
As is true with other forms of over-the-counter derivatives, CDS might involve liquidity risk. If one or both parties to a CDS contract must post collateral (which is common), there can be margin calls requiring the posting of additional collateral. The required collateral is agreed on by the parties when the CDS is first issued. This margin amount may vary over the life of the CDS contract, if the market price of the CDS contract changes, or the credit rating of one of the parties changes. Many CDS contracts even require payment of an upfront fee (composed of "reset to par" and an "initial coupon.").[24]
Another kind of risk for the seller of credit default swaps is jump risk or jump-to-default risk ("JTD risk").[7] A seller of a CDS could be collecting monthly premiums with little expectation that the reference entity may default. A default creates a sudden obligation on the protection sellers to pay millions, if not billions, of dollars to protection buyers.[25] This risk is not present in other over-the-counter derivatives.[7][25]
Sources of market data
[edit]Data about the credit default swaps market is available from three main sources. Data on an annual and semiannual basis is available from the International Swaps and Derivatives Association (ISDA) since 2001[26] and from the Bank for International Settlements (BIS) since 2004.[27] The Depository Trust & Clearing Corporation (DTCC), through its global repository Trade Information Warehouse (TIW), provides weekly data but publicly available information goes back only one year.[28] The numbers provided by each source do not always match because each provider uses different sampling methods.[7] Daily, intraday and real time data is available from S&P Capital IQ through their acquisition of Credit Market Analysis in 2012.[29]
According to DTCC, the Trade Information Warehouse maintains the only "global electronic database for virtually all CDS contracts outstanding in the marketplace."[30]
The Office of the Comptroller of the Currency publishes quarterly credit derivative data about insured U.S commercial banks and trust companies.[31]
Uses
[edit]Credit default swaps can be used by investors for speculation, hedging and arbitrage.
Speculation
[edit]Credit default swaps allow investors to speculate on changes in CDS spreads of single names or of market indices such as the North American CDX index or the European iTraxx index. An investor might believe that an entity's CDS spreads are too high or too low, relative to the entity's bond yields, and attempt to profit from that view by entering into a trade, known as a basis trade, that combines a CDS with a cash bond and an interest rate swap.[citation needed]
Finally, an investor might speculate on an entity's credit quality, since generally CDS spreads increase as credit-worthiness declines, and decline as credit-worthiness increases. The investor might therefore buy CDS protection on a company to speculate that it is about to default. Alternatively, the investor might sell protection if it thinks that the company's creditworthiness might improve. The investor selling the CDS is viewed as being "long" on the CDS and the credit, as if the investor owned the bond.[8][16] In contrast, the investor who bought protection is "short" on the CDS and the underlying credit.[8][16]
Credit default swaps opened up important new avenues to speculators. Investors could go long on a bond without any upfront cost of buying a bond; all the investor need do was promise to pay in the event of default.[32] Shorting a bond faced difficult practical problems, such that shorting was often not feasible; CDS made shorting credit possible and popular.[16][32] Because the speculator in either case does not own the bond, its position is said to be a synthetic long or short position.[8]
For example, a hedge fund believes that Risky Corp will soon default on its debt. Therefore, it buys $10 million worth of CDS protection for two years from AAA-Bank, with Risky Corp as the reference entity, at a spread of 500 basis points (=5%) per annum.
- If Risky Corp does indeed default after, say, one year, then the hedge fund will have paid $500,000 to AAA-Bank, but then receives $10 million (assuming zero recovery rate, and that AAA-Bank has the liquidity to cover the loss), thereby making a profit. AAA-Bank, and its investors, will incur a $9.5 million loss minus recovery unless the bank has somehow offset the position before the default.
- However, if Risky Corp does not default, then the CDS contract runs for two years, and the hedge fund ends up paying $1 million, without any return, thereby making a loss. AAA-Bank, by selling protection, has made $1 million without any upfront investment.
Note that there is a third possibility in the above scenario; the hedge fund could decide to liquidate its position after a certain period of time in an attempt to realise its gains or losses. For example:
- After 1 year, the market now considers Risky Corp more likely to default, so its CDS spread has widened from 500 to 1500 basis points. The hedge fund may choose to sell $10 million worth of protection for 1 year to AAA-Bank at this higher rate. Therefore, over the two years the hedge fund pays the bank 2 * 5% * $10 million = $1 million, but receives 1 * 15% * $10 million = $1.5 million, giving a total profit of $500,000.
- In another scenario, after one year the market now considers Risky much less likely to default, so its CDS spread has tightened from 500 to 250 basis points. Again, the hedge fund may choose to sell $10 million worth of protection for 1 year to AAA-Bank at this lower spread. Therefore, over the two years the hedge fund pays the bank 2 * 5% * $10 million = $1 million, but receives 1 * 2.5% * $10 million = $250,000, giving a total loss of $750,000. This loss is smaller than the $1 million loss that would have occurred if the second transaction had not been entered into.
Transactions such as these do not even have to be entered into over the long-term. If Risky Corp's CDS spread had widened by just a couple of basis points over the course of one day, the hedge fund could have entered into an offsetting contract immediately and made a small profit over the life of the two CDS contracts.[citation needed]
Credit default swaps are also used to structure synthetic collateralized debt obligations (CDOs). Instead of owning bonds or loans, a synthetic CDO gets credit exposure to a portfolio of fixed income assets without owning those assets through the use of CDS.[9] CDOs are viewed as complex and opaque financial instruments. An example of a synthetic CDO is Abacus 2007-AC1, which is the subject of the civil suit for fraud brought by the SEC against Goldman Sachs in April 2010.[33] Abacus is a synthetic CDO consisting of credit default swaps referencing a variety of mortgage-backed securities.
Naked credit default swaps
[edit]Parts of this article (those related to legality of naked CDS in Europe) need to be updated. (November 2012) |
In the examples above, the hedge fund did not own any debt of Risky Corp. A CDS in which the buyer does not own the underlying debt is referred to as a naked credit default swap, estimated to be up to 80% of the credit default swap market.[17][18][when?] There is currently a debate in the United States and Europe about whether speculative uses of credit default swaps should be banned. Legislation is under consideration by Congress as part of financial reform.[18]
Critics assert that naked CDSs should be banned, comparing them to buying fire insurance on your neighbor's house, which creates a huge incentive for arson. Analogizing to the concept of insurable interest, critics say you should not be able to buy a CDS—insurance against default—when you do not own the bond.[34][35][36] Short selling is also viewed as gambling and the CDS market as a casino.[18][37] Another concern is the size of the CDS market. Because naked credit default swaps are synthetic, there is no limit to how many can be sold. The gross amount of CDSs far exceeds all "real" corporate bonds and loans outstanding.[6][35] As a result, the risk of default is magnified leading to concerns about systemic risk.[35]
Financier George Soros called for an outright ban on naked credit default swaps, viewing them as "toxic" and allowing speculators to bet against and "bear raid" companies or countries.[38] His concerns were echoed by several European politicians who, during the Greek government-debt crisis, accused naked CDS buyers of making the crisis worse.[39][40]
Despite these concerns, former United States Secretary of the Treasury Geithner[18][39] and Commodity Futures Trading Commission Chairman Gensler[41] are not in favor of an outright ban on naked credit default swaps. They prefer greater transparency and better capitalization requirements.[18][25] These officials think that naked CDSs have a place in the market.
Proponents of naked credit default swaps say that short selling in various forms, whether credit default swaps, options or futures, has the beneficial effect of increasing liquidity in the marketplace.[34] That benefits hedging activities. Without speculators buying and selling naked CDSs, banks wanting to hedge might not find a ready seller of protection.[18][34] Speculators also create a more competitive marketplace, keeping prices down for hedgers. A robust market in credit default swaps can also serve as a barometer to regulators and investors about the credit health of a company or country.[34][42]
Germany's market regulator BaFin found that naked CDS did not worsen the Greek credit crisis.[40] Without credit default swaps, Greece's borrowing costs would be higher.[40] As of November 2011, the Greek bonds have a bond yield of 28%.[43]
A bill in the U.S. Congress proposed giving a public authority the power to limit the use of CDSs other than for hedging purposes, but the bill did not become law.[44]
Hedging
[edit]Credit default swaps are often used to manage the risk of default that arises from holding debt. A bank, for example, may hedge its risk that a borrower may default on a loan by entering into a CDS contract as the buyer of protection. If the loan goes into default, the proceeds from the CDS contract cancel out the losses on the underlying debt.[14]
There are other ways to eliminate or reduce the risk of default. The bank could sell (that is, assign) the loan outright or bring in other banks as participants. However, these options may not meet the bank's needs. Consent of the corporate borrower is often required. The bank may not want to incur the time and cost to find loan participants.[9]
If both the borrower and lender are well-known and the market (or even worse, the news media) learns that the bank is selling the loan, then the sale may be viewed as signaling a lack of trust in the borrower, which could severely damage the banker-client relationship. In addition, the bank simply may not want to sell or share the potential profits from the loan. By buying a credit default swap, the bank can lay off default risk while still keeping the loan in its portfolio.[9] The downside to this hedge is that without default risk, a bank may have no motivation to actively monitor the loan and the counterparty has no relationship to the borrower.[9]
Another kind of hedge is against concentration risk. A bank's risk management team may advise that the bank is overly concentrated with a particular borrower or industry. The bank can lay off some of this risk by buying a CDS. Because the borrower—the reference entity—is not a party to a credit default swap, entering into a CDS allows the bank to achieve its diversity objectives without impacting its loan portfolio or customer relations.[7] Similarly, a bank selling a CDS can diversify its portfolio by gaining exposure to an industry in which the selling bank has no customer base.[16][14][45]
A bank buying protection can also use a CDS to free regulatory capital. By offloading a particular credit risk, a bank is not required to hold as much capital in reserve against the risk of default (traditionally 8% of the total loan under Basel I). This frees resources the bank can use to make other loans to the same key customer or to other borrowers.[7][46]
Hedging risk is not limited to banks as lenders. Holders of corporate bonds, such as banks, pension funds or insurance companies, may buy a CDS as a hedge for similar reasons. Pension fund example: A pension fund owns five-year bonds issued by Risky Corp with par value of $10 million. To manage the risk of losing money if Risky Corp defaults on its debt, the pension fund buys a CDS from Derivative Bank in a notional amount of $10 million. The CDS trades at 200 basis points (200 basis points = 2.00 percent). In return for this credit protection, the pension fund pays 2% of $10 million ($200,000) per annum in quarterly installments of $50,000 to Derivative Bank.
- If Risky Corporation does not default on its bond payments, the pension fund makes quarterly payments to Derivative Bank for 5 years and receives its $10 million back after five years from Risky Corp. Though the protection payments totaling $1 million reduce investment returns for the pension fund, its risk of loss due to Risky Corp defaulting on the bond is eliminated.
- If Risky Corporation defaults on its debt three years into the CDS contract, the pension fund would stop paying the quarterly premium, and Derivative Bank would ensure that the pension fund is refunded for its loss of $10 million minus recovery (either by physical or cash settlement — see Settlement below). The pension fund still loses the $600,000 it has paid over three years, but without the CDS contract it would have lost the entire $10 million minus recovery.
In addition to financial institutions, large suppliers can use a credit default swap on a public bond issue or a basket of similar risks as a proxy for its own credit risk exposure on receivables.[18][34][46][47]
Although credit default swaps have been highly criticized for their role in the 2008 financial crisis, most observers conclude that using credit default swaps as a hedging device has a useful purpose.[34]
Arbitrage
[edit]Capital Structure Arbitrage is an example of an arbitrage strategy that uses CDS transactions.[48] This technique relies on the fact that a company's stock price and its CDS spread should exhibit negative correlation; i.e., if the outlook for a company improves then its share price should go up and its CDS spread should tighten, since it is less likely to default on its debt. However, if its outlook worsens then its CDS spread should widen and its stock price should fall.
Techniques reliant on this are known as capital structure arbitrage because they exploit market inefficiencies between different parts of the same company's capital structure; i.e., mis-pricings between a company's debt and equity. An arbitrageur attempts to exploit the spread between a company's CDS and its equity in certain situations.
For example, if a company has announced some bad news and its share price has dropped by 25%, but its CDS spread has remained unchanged, then an investor might expect the CDS spread to increase relative to the share price. Therefore, a basic strategy would be to go long on the CDS spread (by buying CDS protection) while simultaneously hedging oneself by buying the underlying stock. This technique would benefit in the event of the CDS spread widening relative to the equity price, but would lose money if the company's CDS spread tightened relative to its equity.
An interesting situation in which the inverse correlation between a company's stock price and CDS spread breaks down is during a Leveraged buyout (LBO). Frequently this leads to the company's CDS spread widening due to the extra debt that will soon be put on the company's books, but also an increase in its share price, since buyers of a company usually end up paying a premium.
Another common arbitrage strategy aims to exploit the fact that the swap-adjusted spread of a CDS should trade closely with that of the underlying cash bond issued by the reference entity. Misalignment in spreads may occur due to technical reasons such as:
- Specific settlement differences
- Shortages in a particular underlying instrument
- The cost of funding a position
- Existence of buyers constrained from buying exotic derivatives.
The difference between CDS spreads and asset swap spreads is called the basis and should theoretically be close to zero. Basis trades attempt to exploit this difference to make a profit, however hedging a bond with a CDS does have irreducible risks which should be considered when making basis trades.[49]
History
[edit]Conception
[edit]Forms of credit default swaps had been in existence from at least the early 1990s,[50] with early trades carried out by Bankers Trust in 1991.[51] J.P. Morgan & Co. and economist Blythe Masters are widely credited with creating the modern credit default swap in 1994.[52][53][54] In that instance, J.P. Morgan had extended a $4.8 billion credit line to Exxon, which faced the threat of $5 billion in punitive damages for the Exxon Valdez oil spill. A team of J.P. Morgan bankers led by Masters then sold the credit risk from the credit line to the European Bank of Reconstruction and Development in order to cut the reserves that J.P. Morgan was required to hold against Exxon's default, thus improving its own balance sheet.[53]
Despite early successes, credit default swaps could not be profitable until an industrialized and streamlined process was created to issue them. This changed when CDS's began to be traded as securities from JPMorgan, an effort led by Bill Demchak where he and his team created bundles of swaps and sold them to investors. The investors would get the streams of revenue, according to the risk-and-reward level they chose; the bank would get insurance against its loans, and fees for setting up the deal.[53]
In 1997, JPMorgan developed a proprietary product called BISTRO (Broad Index Securitized Trust Offering) that used CDS to clean up a bank's balance sheet.[52][54] The advantage of BISTRO was that it used securitization to split up the credit risk into little pieces that smaller investors found more digestible, since most investors lacked EBRD's capability to accept $4.8 billion in credit risk all at once. BISTRO was the first example of what later became known as synthetic collateralized debt obligations (CDOs). There were two Bistros in 1997 for approximately $10 billion (~$18.1 billion in 2024) each.[55]
Mindful of the concentration of default risk as one of the causes of the S&L crisis, regulators initially found CDS's ability to disperse default risk attractive.[51] In 2000, credit default swaps became largely exempt from regulation by both the U.S. Securities and Exchange Commission (SEC) and the Commodity Futures Trading Commission (CFTC). The Commodity Futures Modernization Act of 2000, which was also responsible for the Enron loophole,[6] specifically stated that CDSs are neither futures nor securities and so are outside the remit of the SEC and CFTC.[51]
Market growth
[edit]At first, banks were the dominant players in the market, as CDS were primarily used to hedge risk in connection with their lending activities. Banks also saw an opportunity to free up regulatory capital. By March 1998, the global market for CDS was estimated at $300 billion, with JP Morgan alone accounting for about $50 billion of this.[51]
The high market share enjoyed by the banks was soon eroded as more and more asset managers and hedge funds saw trading opportunities in credit default swaps. By 2002, investors as speculators, rather than banks as hedgers, dominated the market.[7][16][46][50] National banks in the USA used credit default swaps as early as 1996.[45] In that year, the Office of the Comptroller of the Currency measured the size of the market as tens of billions of dollars.[56] Six years later, by year-end 2002, the outstanding amount was over $2 trillion (~$3.32 trillion in 2024).[3]
Although speculators fueled the exponential growth, other factors also played a part. An extended market could not emerge until 1999, when ISDA standardized the documentation for credit default swaps.[57][58][59] Also, the 1997 Asian financial crisis spurred a market for CDS in emerging market sovereign debt.[59] In addition, in 2004, index trading began on a large scale and grew rapidly.[16]
The market size for Credit Default Swaps more than doubled in size each year from $3.7 trillion in 2003.[3] By the end of 2007, the CDS market had a notional value of $62.2 trillion.[3] But notional amount fell during 2008 as a result of dealer "portfolio compression" efforts (replacing offsetting redundant contracts), and by the end of 2008 notional amount outstanding had fallen 38 percent to $38.6 trillion.[60]
Explosive growth was not without operational headaches. On September 15, 2005, the New York Fed summoned 14 banks to its offices. Billions of dollars of CDS were traded daily but the record keeping was more than two weeks behind.[61] This created severe risk management issues, as counterparties were in legal and financial limbo.[16][62] U.K. authorities expressed the same concerns.[63]
Market as of 2008
[edit]

Since default is a relatively rare occurrence (historically around 0.2% of investment grade companies default in any one year),[64] in most CDS contracts the only payments are the premium payments from buyer to seller. Thus, although the above figures for outstanding notionals are very large, in the absence of default the net cash flows are only a small fraction of this total: for a 100 bp = 1% spread, the annual cash flows are only 1% of the notional amount.
Regulatory concerns
[edit]The market for credit default swaps attracted considerable concern from regulators after a number of large scale incidents in 2008, starting with the collapse of Bear Stearns.[65]
In the days and weeks leading up to Bear's collapse, the bank's CDS spread widened dramatically, indicating a surge of buyers taking out protection on the bank. It has been suggested that this widening was responsible for the perception that Bear Stearns was vulnerable, and therefore restricted its access to wholesale capital, which eventually led to its forced sale to JP Morgan in March. An alternative view is that this surge in CDS protection buyers was a symptom rather than a cause of Bear's collapse; i.e., investors saw that Bear was in trouble, and sought to hedge any naked exposure to the bank, or speculate on its collapse.
In September, the bankruptcy of Lehman Brothers caused a total close to $400 billion to become payable to the buyers of CDS protection referenced against the insolvent bank.[citation needed] However the net amount that changed hands was around $7.2 billion.[citation needed][66] This difference is due to the process of 'netting'. Market participants co-operated so that CDS sellers were allowed to deduct from their payouts the inbound funds due to them from their hedging positions. Dealers generally attempt to remain risk-neutral, so that their losses and gains after big events offset each other.
Also in September American International Group (AIG) required [67] an $85 billion federal loan because it had been excessively selling CDS protection without hedging against the possibility that the reference entities might decline in value, which exposed the insurance giant to potential losses over $100 billion. The CDS on Lehman were settled smoothly, as was largely the case for the other 11 credit events occurring in 2008 that triggered payouts.[65] And while it is arguable that other incidents would have been as bad or worse if less efficient instruments than CDS had been used for speculation and insurance purposes, the closing months of 2008 saw regulators working hard to reduce the risk involved in CDS transactions.
In 2008 there was no centralized exchange or clearing house for CDS transactions; they were all done over the counter (OTC). This led to recent calls for the market to open up in terms of transparency and regulation.[68]
In November 2008 the Depository Trust & Clearing Corporation (DTCC), which runs a warehouse for CDS trade confirmations accounting for around 90% of the total market,[69] announced that it will release market data on the outstanding notional of CDS trades on a weekly basis.[70] The data can be accessed on the DTCC's website here:[71]
By 2010, Intercontinental Exchange, through its subsidiaries, ICE Trust in New York, launched in 2008, and ICE Clear Europe Limited in London, UK, launched in July 2009, clearing entities for credit default swaps (CDS) had cleared more than $10 trillion in credit default swaps (CDS) (Terhune Bloomberg Business Week 2010-07-29).[72][notes 1] Bloomberg's Terhune (2010) explained how investors seeking high-margin returns use credit default swaps to bet against financial instruments owned by other companies and countries. Intercontinental's clearing houses guarantee every transaction between buyer and seller providing a much-needed safety net reducing the impact of a default by spreading the risk. ICE collects on every trade.(Terhune Bloomberg Business Week 2010-07-29).[72] Brookings senior research fellow, Robert E. Litan, cautioned however, "valuable pricing data will not be fully reported, leaving ICE's institutional partners with a huge informational advantage over other traders. He calls ICE Trust "a derivatives dealers' club" in which members make money at the expense of nonmembers (Terhune citing Litan in Bloomberg Business Week 2010-07-29).[72] (Litan Derivatives Dealers’ Club 2010)."[73] Actually, Litan conceded that "some limited progress toward central clearing of CDS has been made in recent months, with CDS contracts between dealers now being cleared centrally primarily through one clearinghouse (ICE Trust) in which the dealers have a significant financial interest (Litan 2010:6)."[73] However, "as long as ICE Trust has a monopoly in clearing, watch for the dealers to limit the expansion of the products that are centrally cleared, and to create barriers to electronic trading and smaller dealers making competitive markets in cleared products (Litan 2010:8)."[73]
In 2009 the U.S. Securities and Exchange Commission granted an exemption for Intercontinental Exchange to begin guaranteeing credit-default swaps. The SEC exemption represented the last regulatory approval needed by Atlanta-based Intercontinental.[74] A derivatives analyst at Morgan Stanley, one of the backers for IntercontinentalExchange's subsidiary, ICE Trust in New York, launched in 2008, claimed that the "clearinghouse, and changes to the contracts to standardize them, will probably boost activity".[74] IntercontinentalExchange's subsidiary, ICE Trust's larger competitor, CME Group Inc., hasn't received an SEC exemption, and agency spokesman John Nester said he didn't know when a decision would be made.
Market as of 2009
[edit]The early months of 2009 saw several fundamental changes to the way CDSs operate, resulting from concerns over the instruments' safety after the events of the previous year. According to Deutsche Bank managing director Athanassios Diplas "the industry pushed through 10 years worth of changes in just a few months". By late 2008 processes had been introduced allowing CDSs that offset each other to be cancelled. Along with termination of contracts that have recently paid out such as those based on Lehmans, this had by March reduced the face value of the market down to an estimated $30 trillion.[75]
The Bank for International Settlements estimates that outstanding derivatives total $708 trillion.[76] U.S. and European regulators are developing separate plans to stabilize the derivatives market. Additionally there are some globally agreed standards falling into place in March 2009, administered by International Swaps and Derivatives Association (ISDA). Two of the key changes are:
1. The introduction of central clearing houses, one for the US and one for Europe. A clearing house acts as the central counterparty to both sides of a CDS transaction, thereby reducing the counterparty risk that both buyer and seller face.
2. The international standardization of CDS contracts, to prevent legal disputes in ambiguous cases where what the payout should be is unclear.
Speaking before the changes went live, Sivan Mahadevan, a derivatives analyst at Morgan Stanley,[74] one of the backers for IntercontinentalExchange's subsidiary, ICE Trust in New York, launched in 2008, claimed that
A clearinghouse, and changes to the contracts to standardize them, will probably boost activity. ... Trading will be much easier.... We'll see new players come to the market because they’ll like the idea of this being a better and more traded product. We also feel like over time we'll see the creation of different types of products (Mahadevan cited in Bloomberg 2009).
In the U.S., central clearing operations began in March 2009, operated by InterContinental Exchange (ICE). A key competitor also interested in entering the CDS clearing sector is CME Group.
In Europe, CDS Index clearing was launched by IntercontinentalExchange's European subsidiary ICE Clear Europe on July 31, 2009. It launched Single Name clearing in Dec 2009. By the end of 2009, it had cleared CDS contracts worth EUR 885 billion reducing the open interest down to EUR 75 billion[77]
By the end of 2009, banks had reclaimed much of their market share; hedge funds had largely retreated from the market after the crises. According to an estimate by the Banque de France, by late 2009 the bank JP Morgan alone now had about 30% of the global CDS market.[51][77]
Government approvals relating to ICE and its competitor CME
[edit]The SEC's approval for ICE Futures' request to be exempted from rules that would prevent it clearing CDSs was the third government action granted to Intercontinental in one week. On March 3, its proposed acquisition of Clearing Corp., a Chicago clearinghouse owned by eight of the largest dealers in the credit-default swap market, was approved by the Federal Trade Commission and the Justice Department. On March 5, 2009, the Federal Reserve Board, which oversees the clearinghouse, granted a request for ICE to begin clearing.
Clearing Corp. shareholders including JPMorgan Chase & Co., Goldman Sachs Group Inc. and UBS AG, received $39 million in cash from Intercontinental in the acquisition, as well as the Clearing Corp.’s cash on hand and a 50–50 profit-sharing agreement with Intercontinental on the revenue generated from processing the swaps.
SEC spokesperson John Nestor stated
For several months the SEC and our fellow regulators have worked closely with all of the firms wishing to establish central counterparties.... We believe that CME should be in a position soon to provide us with the information necessary to allow the commission to take action on its exemptive requests.
Other proposals to clear credit-default swaps have been made by NYSE Euronext, Eurex AG and LCH.Clearnet Ltd. Only the NYSE effort is available now for clearing after starting on Dec. 22. As of Jan. 30, no swaps had been cleared by the NYSE’s London- based derivatives exchange, according to NYSE Chief Executive Officer Duncan Niederauer.[78]
Clearing house member requirements
[edit]Members of the Intercontinental clearinghouse ICE Trust (now ICE Clear Credit) in March 2009 would have to have a net worth of at least $5 billion (~$7.08 billion in 2024) and a credit rating of A or better to clear their credit-default swap trades. Intercontinental said in the statement today that all market participants such as hedge funds, banks or other institutions are open to become members of the clearinghouse as long as they meet these requirements.
A clearinghouse acts as the buyer to every seller and seller to every buyer, reducing the risk of counterparty defaulting on a transaction. In the over-the-counter market, where credit- default swaps are currently traded, participants are exposed to each other in case of a default. A clearinghouse also provides one location for regulators to view traders’ positions and prices.
J.P. Morgan losses
[edit]In April 2012, hedge fund insiders became aware that the market in credit default swaps was possibly being affected by the activities of Bruno Iksil, a trader at J.P. Morgan Chief Investment Office (CIO), referred to as "the London whale" in reference to the huge positions he was taking. Heavy opposing bets to his positions are known to have been made by traders, including another branch of J.P. Morgan, who purchased the derivatives offered by J.P. Morgan in such high volume.[79][80] Major losses, $2 billion (~$2.69 billion in 2024), were reported by the firm in May 2012 in relationship to these trades. The disclosure, which resulted in headlines in the media, did not disclose the exact nature of the trading involved, which remains in progress. The item traded, possibly related to CDX IG 9, an index based on the default risk of major U.S. corporations,[81][82] has been described as a "derivative of a derivative".[83][84]
Terms of a typical CDS contract
[edit]A CDS contract is typically documented under a confirmation referencing the credit derivatives definitions as published by the International Swaps and Derivatives Association.[85] The confirmation typically specifies a reference entity, a corporation or sovereign that generally, although not always, has debt outstanding, and a reference obligation, usually an unsubordinated corporate bond or government bond. The period over which default protection extends is defined by the contract effective date and scheduled termination date.
The confirmation also specifies a calculation agent who is responsible for making determinations as to successors and substitute reference obligations (for example necessary if the original reference obligation was a loan that is repaid before the expiry of the contract), and for performing various calculation and administrative functions in connection with the transaction. By market convention, in contracts between CDS dealers and end-users, the dealer is generally the calculation agent, and in contracts between CDS dealers, the protection seller is generally the calculation agent.
It is not the responsibility of the calculation agent to determine whether or not a credit event has occurred but rather a matter of fact that, pursuant to the terms of typical contracts, must be supported by publicly available information delivered along with a credit event notice. Typical CDS contracts do not provide an internal mechanism for challenging the occurrence or non-occurrence of a credit event and rather leave the matter to the courts if necessary, though actual instances of specific events being disputed are relatively rare.
CDS confirmations also specify the credit events that will give rise to payment obligations by the protection seller and delivery obligations by the protection buyer. Typical credit events include bankruptcy with respect to the reference entity and failure to pay with respect to its direct or guaranteed bond or loan debt. CDS written on North American investment grade corporate reference entities, European corporate reference entities and sovereigns generally also include restructuring as a credit event, whereas trades referencing North American high-yield corporate reference entities typically do not.
Finally, standard CDS contracts specify deliverable obligation characteristics that limit the range of obligations that a protection buyer may deliver upon a credit event. Trading conventions for deliverable obligation characteristics vary for different markets and CDS contract types. Typical limitations include that deliverable debt be a bond or loan, that it have a maximum maturity of 30 years, that it not be subordinated, that it not be subject to transfer restrictions (other than Rule 144A), that it be of a standard currency and that it not be subject to some contingency before becoming due.
The premium payments are generally quarterly, with maturity dates (and likewise premium payment dates) falling on March 20, June 20, September 20, and December 20. Due to the proximity to the IMM dates, which fall on the third Wednesday of these months, these CDS maturity dates are also referred to as "IMM dates".
Credit default swap and sovereign debt crisis
[edit]
The European sovereign debt crisis resulted from a combination of complex factors, including the globalisation of finance; easy credit conditions during the 2002–2008 period that encouraged high-risk lending and borrowing practices; the 2008 financial crisis; international trade imbalances; real estate bubbles that have since burst; the Great Recession; fiscal policy choices related to government revenues and expenses; and approaches used by nations to bail out troubled banking industries and private bondholders, assuming private debt burdens or socialising losses. The Credit default swap market also reveals the beginning of the sovereign crisis.
Since December 1, 2011 the European Parliament has banned naked Credit default swap (CDS) on the debt for sovereign nations.[86]
The definition of restructuring is quite technical but is essentially intended to respond to circumstances where a reference entity, as a result of the deterioration of its credit, negotiates changes in the terms in its debt with its creditors as an alternative to formal insolvency proceedings (i.e. the debt is restructured). During the 2012 Greek government-debt crisis, one important issue was whether the restructuring would trigger Credit default swap (CDS) payments. European Central Bank and the International Monetary Fund negotiators avoided these triggers as they could have jeopardized the stability of major European banks who had been protection writers. An alternative could have been to create new CDS which clearly would pay in the event of debt restructuring. The market would have paid the spread between these and old (potentially more ambiguous) CDS. This practice is far more typical in jurisdictions that do not provide protective status to insolvent debtors similar to that provided by Chapter 11 of the United States Bankruptcy Code. In particular, concerns arising out of Conseco's restructuring in 2000 led to the credit event's removal from North American high yield trades.[87]
Settlement
[edit]Physical or cash
[edit]As described in an earlier section, if a credit event occurs then CDS contracts can either be physically settled or cash settled.[7]
- Physical settlement: The protection seller pays the buyer par value, and in return takes delivery of a debt obligation of the reference entity. For example, a hedge fund has bought $5 million worth of protection from a bank on the senior debt of a company. In the event of a default, the bank pays the hedge fund $5 million cash, and the hedge fund must deliver $5 million face value of senior debt of the company (typically bonds or loans, which are typically worth very little given that the company is in default).
- Cash settlement: The protection seller pays the buyer the difference between par value and the market price of a debt obligation of the reference entity. For example, a hedge fund has bought $5 million worth of protection from a bank on the senior debt of a company. This company has now defaulted, and its senior bonds are now trading at 25 (i.e., 25 cents on the dollar) since the market believes that senior bondholders will receive 25% of the money they are owed once the company is wound up (all the defaulting company's liquidable assets are sold off). Therefore, the bank must pay the hedge fund $5 million × (100% − 25%) = $3.75 million.
The development and growth of the CDS market has meant that on many companies there is now a much larger outstanding notional of CDS contracts than the outstanding notional value of its debt obligations. (This is because many parties made CDS contracts for speculative purposes, without actually owning any debt that they wanted to insure against default. See "naked" CDS) For example, at the time it filed for bankruptcy on September 14, 2008, Lehman Brothers had approximately $155 billion of outstanding debt[88] but around $400 billion notional value of CDS contracts had been written that referenced this debt.[89] Clearly not all of these contracts could be physically settled, since there was not enough outstanding Lehman Brothers debt to fulfill all of the contracts, demonstrating the necessity for cash settled CDS trades. The trade confirmation produced when a CDS is traded states whether the contract is to be physically or cash settled.
Auctions
[edit]When a credit event occurs on a major company on which a lot of CDS contracts are written, an auction (also known as a credit-fixing event) may be held to facilitate settlement of a large number of contracts at once, at a fixed cash settlement price. During the auction process participating dealers (e.g., the big investment banks) submit prices at which they would buy and sell the reference entity's debt obligations, as well as net requests for physical settlement against par. A second stage Dutch auction is held following the publication of the initial midpoint of the dealer markets and what is the net open interest to deliver or be delivered actual bonds or loans. The final clearing point of this auction sets the final price for cash settlement of all CDS contracts and all physical settlement requests as well as matched limit offers resulting from the auction are actually settled. According to the International Swaps and Derivatives Association (ISDA), who organised them, auctions have recently proved an effective way of settling the very large volume of outstanding CDS contracts written on companies such as Lehman Brothers and Washington Mutual.[90] Commentator Felix Salmon, however, has questioned in advance ISDA's ability to structure an auction, as defined to date, to set compensation associated with a 2012 bond swap in Greek government debt.[91] For its part, ISDA in the leadup to a 50% or greater "haircut" for Greek bondholders, issued an opinion that the bond swap would not constitute a default event.[92]
Below is a list of the auctions that have been held since 2005.[93][94]
| Date | Name | Final price as a percentage of par |
|---|---|---|
| 2005-06-14 | Collins & Aikman - Senior | 43.625 |
| 2005-06-23 | Collins & Aikman - Subordinated | 6.375 |
| 2005-10-11 | Northwest Airlines | 28 |
| 2005-10-11 | Delta Air Lines | 18 |
| 2005-11-04 | Delphi Corporation | 63.375 |
| 2006-01-17 | Calpine Corporation | 19.125 |
| 2006-03-31 | Dana Holding Corporation | 75 |
| 2006-11-28 | Dura - Senior | 24.125 |
| 2006-11-28 | Dura - Subordinated | 3.5 |
| 2007-10-23 | Movie Gallery | 91.5 |
| 2008-02-19 | Quebecor World | 41.25 |
| 2008-10-02 | Tembec Inc | 83 |
| 2008-10-06 | Fannie Mae - Senior | 91.51 |
| 2008-10-06 | Fannie Mae - Subordinated | 99.9 |
| 2008-10-06 | Freddie Mac - Senior | 94 |
| 2008-10-06 | Freddie Mac - Subordinated | 98 |
| 2008-10-10 | Lehman Brothers | 8.625 |
| 2008-10-23 | Washington Mutual | 57 |
| 2008-11-04 | Landsbanki - Senior | 1.25 |
| 2008-11-04 | Landsbanki - Subordinated | 0.125 |
| 2008-11-05 | Glitnir - Senior | 3 |
| 2008-11-05 | Glitnir - Subordinated | 0.125 |
| 2008-11-06 | Kaupthing - Senior | 6.625 |
| 2008-11-06 | Kaupthing - Subordinated | 2.375 |
| 2008-12-09 | Masonite [2] - LCDS | 52.5 |
| 2008-12-17 | Hawaiian Telcom - LCDS | 40.125 |
| 2009-01-06 | Tribune - CDS | 1.5 |
| 2009-01-06 | Tribune - LCDS | 23.75 |
| 2009-01-14 | Republic of Ecuador | 31.375 |
| 2009-02-03 | Millennium America Inc | 7.125 |
| 2009-02-03 | Lyondell - CDS | 15.5 |
| 2009-02-03 | Lyondell - LCDS | 20.75 |
| 2009-02-03 | EquiStar | 27.5 |
| 2009-02-05 | Sanitec [3] - 1st Lien | 33.5 |
| 2009-02-05 | Sanitec [4] - 2nd Lien | 4.0 |
| 2009-02-09 | British Vita [5] - 1st Lien | 15.5 |
| 2009-02-09 | British Vita [6] - 2nd Lien | 2.875 |
| 2009-02-10 | Nortel Ltd. | 6.5 |
| 2009-02-10 | Nortel Corporation | 12 |
| 2009-02-19 | Smurfit-Stone CDS | 8.875 |
| 2009-02-19 | Smurfit-Stone LCDS | 65.375 |
| 2009-02-26 | Ferretti | 10.875 |
| 2009-03-09 | Aleris | 8 |
| 2009-03-31 | Station Casinos | 32 |
| 2009-04-14 | Chemtura | 15 |
| 2009-04-14 | Great Lakes | 18.25 |
| 2009-04-15 | Rouse | 29.25 |
| 2009-04-16 | LyondellBasell | 2 |
| 2009-04-17 | Abitibi | 3.25 |
| 2009-04-21 | Charter Communications CDS | 2.375 |
| 2009-04-21 | Charter Communications LCDS | 78 |
| 2009-04-22 | Capmark | 23.375 |
| 2009-04-23 | Idearc CDS | 1.75 |
| 2009-04-23 | Idearc LCDS | 38.5 |
| 2009-05-12 | Bowater | 15 |
| 2009-05-13 | General Growth Properties | 44.25 |
| 2009-05-27 | Syncora | 15 |
| 2009-05-28 | Edshcha | 3.75 |
| 2009-06-09 | HLI Operating Corp LCDS | 9.5 |
| 2009-06-10 | Georgia Gulf LCDS | 83 |
| 2009-06-11 | R.H. Donnelley Corp. CDS | 4.875 |
| 2009-06-12 | General Motors CDS | 12.5 |
| 2009-06-12 | General Motors LCDS | 97.5 |
| 2009-06-18 | JSC Alliance Bank CDS | 16.75 |
| 2009-06-23 | Visteon CDS | 3 |
| 2009-06-23 | Visteon LCDS | 39 |
| 2009-06-24 | RH Donnelley Inc LCDS | 78.125 |
| 2009-07-09 | Six Flags CDS | 14 |
| 2009-07-09 | Six Flags LCDS | 96.125 |
| 2009-07-21 | Lear CDS | 38.5 |
| 2009-07-21 | Lear LCDS | 66 |
| 2009-11-10 | METRO-GOLDWYN-MAYER INC. LCDS | 58.5 |
| 2009-11-20 | CIT Group Inc. | 68.125 |
| 2009-12-09 | Thomson | 77.75 |
| 2009-12-15 | Hellas II | 1.375 |
| 2009-12-16 | NJSC Naftogaz of Ukraine | 83.5 |
| 2010-01-07 | Financial Guarantee Insurance Compancy (FGIC) | 26 |
| 2010-02-18 | CEMEX | 97.0 |
| 2010-03-25 | Aiful | 33.875 |
| 2010-04-15 | McCarthy and Stone | 70.375 |
| 2010-04-22 | Japan Airlines Corp | 20.0 |
| 2010-06-04 | Ambac Assurance Corp | 20.0 |
| 2010-07-15 | Truvo Subsidiary Corp | 3.0 |
| 2010-09-09 | Truvo (formerly World Directories) | 41.125 |
| 2010-09-21 | Boston Generating LLC | 40.75 |
| 2010-10-28 | Takefuji Corp | 14.75 |
| 2010-12-09 | Anglo Irish Bank | 18.25 |
| 2010-12-10 | Ambac Financial Group | 9.5 |
| 2011-11-29 | Dynegy Holdings, LLC | 71.25 |
| 2011-12-09 | Seat Pagine Gialle | 10.0 |
| 2011-12-13 | PMI Group | 16.5 |
| 2011-12-15 | AMR Corp | 23.5 |
| 2012-02-22 | Eastman Kodak Co | 22.875 |
| 2012-03-19 | Hellenic Republic | 21.75 |
| 2012-03-22 | Elpida Memory | 20.125 |
| 2012-03-29 | ERC Ireland Fin Ltd | 0.0 |
| 2012-05-09 | Sino Forest Corp | 29.0 |
| 2012-05-30 | Houghton Mifflin Harcourt Publishing Co | 55.5 |
| 2012-06-06 | Residential Cap LLC | 17.625 |
| 2015-02-19 | Caesars Entmt Oper Co Inc | 15.875 |
| 2015-03-05 | Radio Shack Corp | 11.5 |
| 2015-06-23 | Sabine Oil Gas Corp | 15.875 |
| 2015-09-17 | Alpha Appalachia Hldgs Inc | 6 |
| 2015-10-06 | Ukraine | 80.625 |
Pricing and valuation
[edit]There are two competing theories usually advanced for the pricing of credit default swaps. The first, referred to herein as the 'probability model', takes the present value of a series of cashflows weighted by their probability of non-default. This method suggests that credit default swaps should trade at a considerably lower spread than corporate bonds.
The second model, proposed by Darrell Duffie, but also by John Hull and Alan White, uses a no-arbitrage approach.
Probability model
[edit]Under the probability model, a credit default swap is priced using a model that takes four inputs; this is similar to the rNPV (risk-adjusted NPV) model used in drug development:
- the "issue premium",
- the recovery rate (percentage of notional repaid in event of default),
- the "credit curve" for the reference entity and
- the "LIBOR curve".
If default events never occurred the price of a CDS would simply be the sum of the discounted premium payments. So CDS pricing models have to take into account the possibility of a default occurring some time between the effective date and maturity date of the CDS contract. For the purpose of explanation we can imagine the case of a one-year CDS with effective date with four quarterly premium payments occurring at times , , , and . If the nominal for the CDS is and the issue premium is then the size of the quarterly premium payments is . If we assume for simplicity that defaults can only occur on one of the payment dates then there are five ways the contract could end:


- either it does not have any default at all, so the four premium payments are made and the contract survives until the maturity date, or
- a default occurs on the first, second, third or fourth payment date.
To price the CDS we now need to assign probabilities to the five possible outcomes, then calculate the present value of the payoff for each outcome. The present value of the CDS is then simply the present value of the five payoffs multiplied by their probability of occurring. For a simplified numeric example, see [95] and [96]
This is illustrated in the following tree diagram where at each payment date either the contract has a default event, in which case it ends with a payment of shown in red, where is the recovery rate, or it survives without a default being triggered, in which case a premium payment of is made, shown in blue. At either side of the diagram are the cashflows up to that point in time with premium payments in blue and default payments in red. If the contract is terminated the square is shown with solid shading.


The probability of surviving over the interval to without a default payment is and the probability of a default being triggered is . The calculation of present value, given discount factor of to is then


| Description | Premium Payment PV | Default Payment PV | Probability |
|---|---|---|---|
| Default at time | |||
| Default at time | |||
| Default at time | |||
| Default at time | |||
| No defaults |


The probabilities , , , can be calculated using the credit spread curve. The probability of no default occurring over a time period from to decays exponentially with a time-constant determined by the credit spread, or mathematically where is the credit spread zero curve at time . The riskier the reference entity the greater the spread and the more rapidly the survival probability decays with time.


To get the total present value of the credit default swap we multiply the probability of each outcome by its present value to give


![{\displaystyle +p_{1}(1-p_{2})[N(1-R)\delta _{2}-{\frac {Nc}{4}}\delta _{1}]}](https://wikimedia.org/api/rest_v1/media/math/render/svg/72dd88f04372f7350b4420a25ed42bc8eb19b7cc)
![{\displaystyle +p_{1}p_{2}(1-p_{3})[N(1-R)\delta _{3}-{\frac {Nc}{4}}(\delta _{1}+\delta _{2})]}](https://wikimedia.org/api/rest_v1/media/math/render/svg/919747662406f9d09670deab27c000c8cac922fd)
![{\displaystyle +p_{1}p_{2}p_{3}(1-p_{4})[N(1-R)\delta _{4}-{\frac {Nc}{4}}(\delta _{1}+\delta _{2}+\delta _{3})]}](https://wikimedia.org/api/rest_v1/media/math/render/svg/3ada22c2190e37e88ca3ff2f447c3bc23860d184)

Grouped by cash flow direction (receiving protection and paying premium):
![{\displaystyle N(1-R)[(1-p_{1})\delta _{1}+p_{1}(1-p_{2})\delta _{2}+p_{1}p_{2}(1-p_{3})\delta _{3}+p_{1}p_{2}p_{3}(1-p_{4})\delta _{4}]}](https://wikimedia.org/api/rest_v1/media/math/render/svg/d419f597923915afab00a8176e44e090f4703b3f)
![{\displaystyle -{\frac {Nc}{4}}[p_{1}\delta _{1}+p_{1}p_{2}\delta _{2}+p_{1}p_{2}p_{3}\delta _{3}+p_{1}p_{2}p_{3}p_{4}\delta _{4}]}](https://wikimedia.org/api/rest_v1/media/math/render/svg/d60bc578fe7dc0b67ca04ac1d7094eaa76f99adc)
No-arbitrage model
[edit]In the "no-arbitrage" model proposed by both Duffie, and Hull-White, it is assumed that there is no risk free arbitrage. Duffie uses the LIBOR as the risk free rate, whereas Hull and White use US Treasuries as the risk free rate. Both analyses make simplifying assumptions (such as the assumption that there is zero cost of unwinding the fixed leg of the swap on default), which may invalidate the no-arbitrage assumption. However the Duffie approach is frequently used by the market to determine theoretical prices.
Sensitivities
[edit]Analogous to DV01 for a bond, CS01 - the credit spread dollar value of one basis point - reflects the change [97] in market value of a CDS in response to a one basis point change in its swap premium. CS01 may also [97] be defined as the change in value for a one basis point parallel shift in the credit spread curve. [98] [99] "CS01 Risk", in turn, refers to [100] [99] any unfavorable change in value, in response to changes in underlying credit spreads.
Criticisms
[edit]Critics of the huge credit default swap market have claimed that it has been allowed to become too large without proper regulation and that, because all contracts are privately negotiated, the market has no transparency. Furthermore, there have been claims that CDSs exacerbated the 2008 financial crisis by hastening the demise of companies such as Lehman Brothers and AIG.[52]
In the case of Lehman Brothers, it is claimed that the widening of the bank's CDS spread reduced confidence in the bank and ultimately gave it further problems that it was not able to overcome. However, proponents of the CDS market argue that this confuses cause and effect; CDS spreads simply reflected the reality that the company was in serious trouble. Furthermore, they claim that the CDS market allowed investors who had counterparty risk with Lehman Brothers to reduce their exposure in the case of their default.
Credit default swaps have also faced criticism that they contributed to a breakdown in negotiations during the 2009 General Motors Chapter 11 reorganization, because certain bondholders might benefit from the credit event of a GM bankruptcy due to their holding of CDSs. Critics speculate that these creditors had an incentive to push for the company to enter bankruptcy protection.[101] Due to a lack of transparency, there was no way to identify the protection buyers and protection writers.[102]
It was also feared at the time of Lehman's bankruptcy that the $400 billion notional of CDS protection which had been written on the bank could lead to a net payout of $366 billion from protection sellers to buyers (given the cash-settlement auction settled at a final price of 8.625%) and that these large payouts could lead to further bankruptcies of firms without enough cash to settle their contracts.[103] However, industry estimates after the auction suggest that net cashflows were only in the region of $7 billion.[103] because many parties held offsetting positions. Furthermore, CDS deals are marked-to-market frequently. This would have led to margin calls from buyers to sellers as Lehman's CDS spread widened, reducing the net cashflows on the days after the auction.[90]
Senior bankers have argued that not only did the CDS market function remarkably well during the 2008 financial crisis; that CDS contracts have been acting to distribute risk just as was intended; and that it is not CDSs themselves that need further regulation but the parties who trade them.[104]
Some general criticism of financial derivatives is also relevant to credit derivatives. Warren Buffett famously described derivatives bought speculatively as "financial weapons of mass destruction." In Berkshire Hathaway's annual report to shareholders in 2002, he said, "Unless derivatives contracts are collateralized or guaranteed, their ultimate value also depends on the creditworthiness of the counterparties to them. In the meantime, though, before a contract is settled, the counterparties record profits and losses—often huge in amount—in their current earnings statements without so much as a penny changing hands. The range of derivatives contracts is limited only by the imagination of man (or sometimes, so it seems, madmen)."[105]
To hedge the counterparty risk of entering a CDS transaction, one practice is to buy CDS protection on one's counterparty. The positions are marked-to-market daily and collateral pass from buyer to seller or vice versa to protect both parties against counterparty default, but money does not always change hands due to the offset of gains and losses by those who had both bought and sold protection. Depository Trust & Clearing Corporation, the clearinghouse for the majority of trades in the US over-the-counter market, stated in October 2008 that once offsetting trades were considered, only an estimated $6 billion would change hands on October 21, during the settlement of the CDS contracts issued on Lehman Brothers' debt, which amounted to somewhere between $150 and $360 billion.[106]
Despite Buffett's criticism on derivatives, in October 2008 Berkshire Hathaway revealed to regulators that it has entered into at least $4.85 billion in derivative transactions.[107] Buffett stated in his 2008 letter to shareholders that Berkshire Hathaway has no counterparty risk in its derivative dealings because Berkshire require counterparties to make payments when contracts are initiated, so that Berkshire always holds the money.[108] Berkshire Hathaway was a large owner of Moody's stock during the period that it was one of two primary rating agencies for subprime CDOs, a form of mortgage security derivative dependent on the use of credit default swaps.
The monoline insurance companies got involved with writing credit default swaps on mortgage-backed CDOs. Some media reports have claimed this was a contributing factor to the downfall of some of the monolines.[109][110] In 2009 one of the monolines, MBIA, sued Merrill Lynch, claiming that Merrill had misrepresented some of its CDOs to MBIA in order to persuade MBIA to write CDS protection for those CDOs.[111][112][113]
Systemic risk
[edit]During the 2008 financial crisis, counterparties became subject to a risk of default, amplified with the involvement of Lehman Brothers and AIG in a very large number of CDS transactions. This is an example of systemic risk, risk which threatens an entire market, and a number of commentators have argued that size and deregulation of the CDS market have increased this risk.
For example, imagine if a hypothetical mutual fund had bought some Washington Mutual corporate bonds in 2005 and decided to hedge their exposure by buying CDS protection from Lehman Brothers. After Lehman's default, this protection was no longer active, and Washington Mutual's sudden default only days later would have led to a massive loss on the bonds, a loss that should have been insured by the CDS. There was also fear that Lehman Brothers and AIG's inability to pay out on CDS contracts would lead to the unraveling of complex interlinked chain of CDS transactions between financial institutions.[114]
Chains of CDS transactions can arise from a practice known as "netting".[115] Here, company B may buy a CDS from company A with a certain annual premium, say 2%. If the condition of the reference company worsens, the risk premium rises, so company B can sell a CDS to company C with a premium of say, 5%, and pocket the 3% difference. However, if the reference company defaults, company B might not have the assets on hand to make good on the contract. It depends on its contract with company A to provide a large payout, which it then passes along to company C.
The problem lies if one of the companies in the chain fails, creating a "domino effect" of losses. For example, if company A fails, company B will default on its CDS contract to company C, possibly resulting in bankruptcy, and company C will potentially experience a large loss due to the failure to receive compensation for the bad debt it held from the reference company. Even worse, because CDS contracts are private, company C will not know that its fate is tied to company A; it is only doing business with company B.
As described above, the establishment of a central exchange or clearing house for CDS trades would help to solve the "domino effect" problem, since it would mean that all trades faced a central counterparty guaranteed by a consortium of dealers.
Tax and accounting issues
[edit]The U.S federal income tax treatment of CDS is uncertain (Nirenberg and Kopp 1997:1, Peaslee & Nirenberg 2008-07-21:129 and Brandes 2008).[116][117][118][notes 2] Commentators have suggested that, depending on how they are drafted, they are either notional principal contracts or options for tax purposes,(Peaslee & Nirenberg 2008-07-21:129).[117] but this is not certain. There is a risk of having CDS recharacterized as different types of financial instruments because they resemble put options and credit guarantees. In particular, the degree of risk depends on the type of settlement (physical/cash and binary/FMV) and trigger (default only/any credit event) (Nirenberg & Kopp 1997:8).[116] And, as noted below, the appropriate treatment for Naked CDS may be entirely different.
If a CDS is a notional principal contract, pre-default periodic and nonperiodic payments on the swap are deductible and included in ordinary income.[119] If a payment is a termination payment, or a payment received on a sale of the swap to a third party, however, its tax treatment is an open question.[119] In 2004, the Internal Revenue Service announced that it was studying the characterization of CDS in response to taxpayer confusion.[120] As the outcome of its study, the IRS issued proposed regulations in 2011 specifically classifying CDS as notional principal contracts, and thereby qualifying such termination and sale payments for favorable capital gains tax treatment.[121] These proposed regulations, which are yet to be finalized, have already been subject to criticism at a public hearing held by the IRS in January 2012,[122] as well as in the academic press,[123] insofar as that classification would apply to Naked CDS.
The thrust of this criticism is that Naked CDS are indistinguishable from gambling wagers, and thus give rise in all instances to ordinary income, including to hedge fund managers on their so-called carried interests,[123] and that the IRS exceeded its authority with the proposed regulations. This is evidenced by the fact that Congress confirmed that certain derivatives, including CDS, do constitute gambling when, in 2000, to allay industry fears that they were illegal gambling,[124] it exempted them from "any State or local law that prohibits or regulates gaming."[125] While this decriminalized Naked CDS, it did not grant them relief under the federal gambling tax provisions.
The accounting treatment of CDS used for hedging may not parallel the economic effects and instead, increase volatility. For example, GAAP generally require that CDS be reported on a mark to market basis. In contrast, assets that are held for investment, such as a commercial loan or bonds, are reported at cost, unless a probable and significant loss is expected. Thus, hedging a commercial loan using a CDS can induce considerable volatility into the income statement and balance sheet as the CDS changes value over its life due to market conditions and due to the tendency for shorter dated CDS to sell at lower prices than longer dated CDS. One can try to account for the CDS as a hedge under FASB 133[126] but in practice that can prove very difficult unless the risky asset owned by the bank or corporation is exactly the same as the Reference Obligation used for the particular CDS that was bought.
LCDS
[edit]A new type of default swap is the "loan only" credit default swap (LCDS). This is conceptually very similar to a standard CDS, but unlike "vanilla" CDS, the underlying protection is sold on syndicated secured loans of the Reference Entity rather than the broader category of "Bond or Loan". Also, as of May 22, 2007, for the most widely traded LCDS form, which governs North American single name and index trades, the default settlement method for LCDS shifted to auction settlement rather than physical settlement. The auction method is essentially the same that has been used in the various ISDA cash settlement auction protocols, but does not require parties to take any additional steps following a credit event (i.e., adherence to a protocol) to elect cash settlement. On October 23, 2007, the first ever LCDS auction was held for Movie Gallery.[127]
Because LCDS trades are linked to secured obligations with much higher recovery values than the unsecured bond obligations that are typically assumed the cheapest to deliver in respect of vanilla CDS, LCDS spreads are generally much tighter than CDS trades on the same name.
ISDA Definitions
[edit]During the rapid growth of the credit derivatives market the 1999 ISDA Credit Derivatives Definitions[128] were introduced to standardize the legal documentation of CDS. Subsequently, replaced with the 2003 ISDA Credit Derivatives Definitions,[129] and later the 2014 ISDA Credit Derivatives Definitions,[130] each definition update seeks to ensure the CDS payoffs closely mimic the economics of the underlying reference obligations (bonds).
See also
[edit]- Bucket shop (stock market)
- Constant maturity credit default swap
- Credit default option
- Credit default swap index
- CUSIP Linked MIP Code, reference entity code
- Inside Job (2010 film), an Oscar-winning documentary film about the 2008 financial crisis by Charles H. Ferguson
- PAUG
- Recovery swap
- Toxic security
- Intercontinental Exchange
Notes
[edit]References
[edit]- ^ Azad, C (April 10, 2013). "CDOs Are Back: Will They Lead to Another Financial Crisis". University of Pennsylvania. Wharton. Retrieved January 31, 2018.
- ^ Pollack, Lisa (January 5, 2012). "Credit event auctions: Why do they exist?". FT Alphaville. Retrieved January 5, 2012.
- ^ a b c d "Chart; ISDA Market Survey; Notional amounts outstanding at year-end, all surveyed contracts, 1987–present" (PDF). International Swaps and Derivatives Association (ISDA). Archived from the original (PDF) on March 7, 2012. Retrieved April 8, 2010.
- ^ ISDA 2010 MID-YEAR MARKET SURVEY Archived September 13, 2011, at the Wayback Machine. Latest available a/o 2012-03-01.
- ^ "ISDA: CDS Marketplace :: Market Statistics". Isdacdsmarketplace.com. December 31, 2010. Archived from the original on January 19, 2012. Retrieved March 12, 2012.
- ^ a b c d Kiff, John; Jennifer Elliott; Elias Kazarian; Jodi Scarlata; Carolyne Spackman (November 2009). "Credit Derivatives: Systemic Risks and Policy Options" (PDF). IMF Working Papers. 09 (254): 1. doi:10.5089/9781451874006.001. S2CID 167560306. Retrieved April 25, 2010.
- ^ a b c d e f g h i j k l m Weistroffer, Christian (December 21, 2009). "Credit default swaps: Heading towards a more stable system" (PDF). Deutsche Bank Research: Current Issues. Retrieved December 9, 2019.
- ^ a b c d e Sirri, Erik, Director, Division of Trading and Markets U.S. Securities and Exchange Commission. "Testimony Concerning Credit Default Swaps Before the House Committee on Agriculture October 15, 2008". Retrieved April 2, 2010.
{{cite web}}: CS1 maint: multiple names: authors list (link) - ^ a b c d e Partnoy, Frank; Skeel, David A. Jr. (2007). "The Promise And Perils of Credit Derivatives". University of Cincinnati Law Review. 75. Cincinnati, Ohio: University of Cincinnati: 1019–1051. SSRN 929747.
- ^ "Media Statement: DTCC Policy for Releasing CDS Data to Global Regulators". Depository Trust & Clearing Corporation. March 23, 2010. Archived from the original on April 29, 2010. Retrieved April 22, 2010.
- ^ Boyarchenko, Nina (June 2020). "The Long and Short of It: The Post-Crisis Corporate CDS Market" (PDF). newyorkfed.org. Federal Reserve Bank of New York. Retrieved September 13, 2021.
- ^ a b International Swaps and Derivatives Association, Inc. (ISDA). "24. Product description: Credit default swaps". Archived from the original on April 16, 2010. Retrieved March 26, 2010.
ISDA is the trade group that represents participants in the privately negotiated derivatives industry
- ^ CFA Institute. (2008). Derivatives and Alternative Investments. pg G-11. Boston: Pearson Custom Publishing. ISBN 0-536-34228-8.
- ^ a b c d Federal Reserve Bank of Atlanta (April 14, 2008). "Did You Know? A Primer on Credit Default Swaps". Financial Update. 21 (2). Archived from the original on July 23, 2011. Retrieved March 31, 2010.
- ^ Koresh, Galil; Shapir, Offer Moshe; Amiram, Dan; Ben-Zion, Uri (November 1, 2018). "The Determinants of CDS Spreads" (PDF). Journal of Banking and Finance. 41: 271–282. doi:10.1016/j.jbankfin.2013.12.005. SSRN 2361872.
- ^ a b c d e f g h i Mengle, David. "Credit Derivatives: An Overview" (PDF). Economic Review (FRB Atlanta), Fourth Quarter 2007. 92 (4). Retrieved January 13, 2016.
- ^ a b Kopecki, Dawn; Shannon D. Harrington (July 24, 2009). "Banning 'Naked' Default Swaps May Raise Corporate Funding Costs". Bloomberg. Retrieved March 31, 2010.
- ^ a b c d e f g h Leonard, Andrew (April 20, 2010). "Credit default swaps: What are they good for?". Salon.com. Salon Media Group. Retrieved April 24, 2010.
- ^ Cox, Christopher, Chairman, U.S. Securities and Exchange Commission. "Testimony Concerning Turmoil in U.S. Credit Markets: Recent Actions Regarding Government Sponsored Entities, Investment Banks and Other Financial Institutions". Senate Committee on Banking, Housing, and Urban Affairs. September 23, 2008. Retrieved March 17, 2009.
- ^ Garbowski, Mark (October 24, 2008). "United States: Credit Default Swaps: A Brief Insurance Primer". Retrieved November 3, 2008.
like insurance insofar as the buyer collects when an underlying security defaults ... unlike insurance, however, in that the buyer need not have an "insurable interest" in the underlying security
- ^ Morgenson, Gretchen (August 10, 2008). "Credit default swap market under scrutiny". Retrieved November 3, 2008.
If a default occurs, the party providing the credit protection — the seller — must make the buyer whole on the amount of insurance bought.
- ^ Frielink, Karel (August 10, 2008). "Are credit default swaps insurance products?". Retrieved November 3, 2008.
If the fund manager acts as the protection seller under a CDS, there is some risk of breach of insurance regulations for the manager.... There is no Netherlands Antilles case law or literature available which makes clear whether a CDS constitutes the 'conducting of insurance business' under Netherlands Antilles law. However, if certain requirements are met, credit derivatives do not qualify as an agreement of (non-life) insurance because such an arrangement would in those circumstances not contain all the elements necessary to qualify it as such.
- ^ "Understanding Derivatives: Markets and Infrastructure - Federal Reserve Bank of Chicago". chicagofed.org.
- ^ Kramer, Stefan (April 20, 2010). "Do We Need Central Counterparty Clearing of Credit Default Swaps?" (PDF). Retrieved April 3, 2011.
- ^ a b c Gensler, Gary, Chairman Commodity Futures Trading Commission (March 9, 2010). "Keynote Address of Chairman Gary Gensler, OTC Derivatives Reform, Markit's Outlook for OTC Derivatives Markets Conference" (PDF). Archived from the original (PDF) on May 27, 2010. Retrieved April 25, 2010.
{{cite web}}: CS1 maint: multiple names: authors list (link) - ^ "Surveys & Market Statistics". International Swaps and Derivatives Association (ISDA). Archived from the original on April 14, 2010. Retrieved April 20, 2010.
- ^ "Regular OTC Derivatives Market Statistics". Bank for International Settlements. December 20, 2001. Retrieved April 20, 2010.
- ^ "Trade Information Warehouse Reports". Depository Trust & Clearing Corporation (DTCC). Archived from the original on April 29, 2010. Retrieved April 20, 2010.
- ^ "S&P Capital IQ Announces Acquisition of Credit Market Analysis Limited". S&P Capital IQ. Retrieved July 2, 2012.
- ^ "The Trade Information Warehouse (Warehouse) is the market's first and only centralized global repository for trade reporting and post-trade processing of OTC credit derivatives contracts". Depository Trust & Clearing Corporation. Archived from the original on November 13, 2007. Retrieved April 23, 2010.
- ^ "Publications: OCC's Quarterly Report on Bank Derivatives Activities". Office of the Comptroller of the Currency. Archived from the original on December 26, 2007. Retrieved April 20, 2010.
- ^ a b Lucas, Douglas; Laurie S. Goodman; Frank J. Fabozzi (May 5, 2006). Collateralized Debt Obligations: Structures and Analysis, 2nd Edition. John Wiley & Sons Inc. p. 221. ISBN 978-0-471-71887-1.
- ^ "SEC charges Goldman Sachs with fraud in subprime case". USA Today. April 16, 2010. Retrieved April 27, 2010.
- ^ a b c d e f Litan, Robert E. (April 7, 2010). "The Derivatives Dealers' Club and Derivatives Markets Reform: A Guide for Policy Makers, Citizens and Other Interested Parties" (PDF). Brookings Institution. Archived from the original (PDF) on December 22, 2010. Retrieved April 15, 2010.
- ^ a b c Buiter, Willem (March 16, 2009). "Should you be able to sell what you do not own?". Financial Times. Archived from the original on March 17, 2009. Retrieved May 11, 2025.
- ^ Munchau, Wolfgang (March 1, 2010). "Time to outlaw naked credit default swaps". Financial Times. Archived from the original on December 10, 2022. Retrieved April 24, 2010.
- ^ Leopold, Les (June 2, 2009). The Looting of America: How Wall Street's Game of Fantasy Finance Destroyed Our Jobs, Our Pensions, and Prosperity, and What We Can Do About It. Chelsea Green Publishing. ISBN 978-1-60358-205-6. Retrieved April 24, 2010.
- ^ Soros, George (March 24, 2009). "Opinion: One Way to Stop Bear Raids". The Wall Street Journal. Retrieved April 24, 2010.
- ^ a b Moshinsky, Ben; Aaron Kirchfeld (March 11, 2010). "Naked Swaps Crackdown in Europe Rings Hollow Without Washington". Bloomberg. Retrieved April 24, 2010.
- ^ a b c Jacobs, Stevenson (March 10, 2010). "Greek Debt Crisis Is At The Center Of The Credit Default Swap Debate". Huffington Post. Retrieved April 24, 2010.
- ^ "E.U. Derivatives Ban Won't Work, U.S. Says". New York Times. March 17, 2010. Retrieved April 24, 2010.
- ^ Kern, Steffen; Deutsche Bank Research (March 17, 2010). "Short Selling" (PDF). Research Briefing. Archived from the original (PDF) on July 16, 2011. Retrieved April 24, 2010.
- ^ "Greece Govt Bond 10 Year Acting as Benchmark". Bloomberg.com. March 8, 2012. Retrieved March 12, 2012.
- ^ "Bill H.R. 977". govtrack.us. Retrieved March 15, 2011.
- ^ a b "OCC 96-43; OCC Bulletin; Subject: Credit Derivatives; Description: Guidelines for National Banks". Office of the Comptroller of the Currency. August 12, 1996. Archived from the original (txt) on May 27, 2010. Retrieved April 8, 2010.
- ^ a b c McDermott, Robert. "The Long Awaited Arrival of Credit Derivatives". Derivatives Strategy, December/January 1997. Archived from the original on January 18, 2017. Retrieved April 8, 2010.
- ^ Miller, Ken (Spring 2009). "Using Letters Of Credit, Credit Default Swaps And Other Forms of Credit Enhancements in Net Lease Transactions" (PDF). Virginia Law & Business Review. 4 (1): 69–78, 80. Archived from the original (PDF) on July 28, 2011. Retrieved April 15, 2010.
the use of an exotic credit default swap (called a Net Lease CDS), which effectively hedges tenant credit risk but at a substantially higher price than a vanilla swap.
- ^ "Archived copy" (PDF). Archived from the original (PDF) on June 26, 2010. Retrieved 2016-02-08.
{{cite web}}: CS1 maint: archived copy as title (link) Chatiras, Manolis, and Barsendu Mukherjee. Capital Structure Arbitrage: Investigation using Stocks and High Yield Bonds. Amherst, MA: Center for International Securities and Derivatives Markets, Isenberg School of Management, University of Massachusetts, Amherst, 2004. Retrieved March 17, 2009. - ^ Freeman, Jake; Kapoor, Vivek (June 17, 2019). "Irreducible Risks of Hedging a Bond with a Default Swap". Rochester, NY. doi:10.2139/ssrn.3405367. S2CID 201359462. SSRN 3405367.
{{cite journal}}: Cite journal requires|journal=(help) - ^ a b Smithson, Charles; David Mengle (Fall 2006). "The Promise of Credit Derivatives in Nonfinancial Corporations (and Why It's Failed to Materialize)" (PDF). Journal of Applied Corporate Finance. 18 (4): 54–60. doi:10.1111/j.1745-6622.2006.00111.x. S2CID 153974600. Archived from the original (PDF) on July 15, 2011. Retrieved April 8, 2010.
- ^ a b c d e Tett, Gillian (2009). Fool's Gold: How Unrestrained Greed Corrupted a Dream, Shattered Global Markets and Unleashed a Catastrophe. Little Brown. pp. 48–67, 87, 303. ISBN 978-0-349-12189-5.
- ^ a b c Philips, Matthew (September 27, 2008). "The Monster That Ate Wall Street". Newsweek. Retrieved April 7, 2010.
- ^ a b c Lanchester, John (June 1, 2009). "Outsmarted". New Yorker. Retrieved April 7, 2010.
- ^ a b Tett, Gillian. "The Dream Machine: Invention of Credit Derivatives". Financial Times. March 24, 2006. Retrieved March 17, 2009.
- ^ Alex Chambers (May 1, 2006). "How the structured credit revolution started". Euromoney.
- ^ Simon, Ellen (October 20, 2008). "Meltdown 101: What are credit default swaps?". USA Today. Retrieved April 7, 2010.
- ^ "Remarks by Chairman Alan Greenspan Risk Transfer and Financial Stability To the Federal Reserve Bank of Chicago's Forty-first Annual Conference on Bank Structure, Chicago, Illinois (via satellite) May 5, 2005". Federal Reserve Board. May 5, 2005. Retrieved April 8, 2010.
- ^ McDermott, Robert. "The Long Awaited Arrival of Credit Derivatives, December–January 1997". Derivatives Strategy. Archived from the original on January 18, 2017. Retrieved April 8, 2010.
The lack of standardized documentation for credit swaps, in fact, could become a major brake on market expansion.
- ^ a b Ranciere, Romain G. (April 2002). "Credit Derivatives in Emerging Markets" (PDF). IMF Policy Discussion Paper. Archived from the original (PDF) on June 23, 2010. Retrieved April 8, 2010.
- ^ "ISDA Market Survey, Year-End 2008". Isda.org. Archived from the original on August 17, 2010. Retrieved August 27, 2010.
- ^ Atlas, Riva D. (September 16, 2005). "Trying to Put Some Reins on Derivatives". New York Times. Retrieved April 8, 2010.
- ^ Weithers, Tim. "Credit Derivatives, Macro Risks, and Systemic Risks" (PDF). Economic Review (FRB Atlanta), Fourth Quarter 2007. 92 (4): 43–69. Archived from the original (PDF) on July 23, 2011. Retrieved April 9, 2010.
- ^ "The level of outstanding credit-derivative trade confirmations presents operational and legal risks for firms" (PDF). Financial Risk Outlook 2006. The Financial Services Authority. Archived from the original (PDF) on December 3, 2009. Retrieved April 8, 2010.
- ^ "Default Rates". Efalken.com. Retrieved August 27, 2010.
- ^ a b Colin Barr (March 16, 2009). "The truth about credit default swaps". CNN / Fortune. Retrieved March 27, 2009.
- ^ "Bad news on Lehman CDS". Ft.com. October 11, 2008. Archived from the original on December 10, 2022. Retrieved August 27, 2010.
- ^ Analysis, James B. Kelleher - (September 18, 2008). "Buffett's "time bomb" goes off on Wall Street". U.S. Retrieved May 23, 2021.
- ^ "Testimony Concerning Turmoil in U.S. Credit Markets: Recent Actions Regarding Government Sponsored Entities, Investment Banks and Other Financial Institutions (Christopher Cox, September 23, 2008)". Sec.gov. September 23, 2008. Retrieved August 27, 2010.
- ^ Bowers, Simon (November 5, 2008). "Banks hit back at derivatives criticism". The Guardian. London. Retrieved April 30, 2010.
- ^ Harrington, Shannon D. (November 5, 2008). "Credit-Default Swaps on Italy, Spain Are Most Traded (Update1)". Bloomberg. Retrieved August 27, 2010.
- ^ "DTCC " DTCC Deriv/SERV Trade Information Warehouse Reports". Dtcc.com. Archived from the original on December 12, 2009. Retrieved August 27, 2010.
- ^ a b c Chad Terhune (July 29, 2010). "ICE's Jeffrey Sprecher: The Sultan of Swaps". Bloomberg Business Week. Archived from the original on August 6, 2010. Retrieved February 15, 2013.
- ^ a b c Robert E. Litan (April 7, 2010). "The Derivatives Dealers' Club and Derivatives Markets Reform: A Guide for Policy Makers, Citizens and Other Interested Parties" (PDF). Brookings Institution. Archived from the original (PDF) on May 28, 2013.
- ^ a b c "IntercontinentalExchange gets SEC exemption: The exchange will begin clearing credit-default swaps next week". Bloomberg News. March 7, 2009.
- ^ Van Duyn, Aline. "Worries Remain Even After CDS Clean-Up". The Financial Times. Archived from the original on December 10, 2022. Retrieved March 12, 2009.
- ^ Monetary and Economic Department. "OTC derivatives market activity in the first half of 2011" (PDF). Bank for International Settlements. Retrieved December 15, 2011.
- ^ a b "Report Center - Data". ICE. Archived from the original on February 22, 2012. Retrieved March 12, 2012.
- ^ Leising, Matthew; Harrington, Shannon D (March 6, 2009). "Intercontinental to Clear Credit Swaps Next Week". Bloomberg. Retrieved March 12, 2009.
- ^ Zuckerman, Gregory; Burne, Katy (April 6, 2012). "'London Whale' Rattles Debt Market". The Wall Street Journal.
- ^ Azam Ahmed (May 15, 2012). "As One JPMorgan Trader Sold Risky Contracts, Another One Bought Them". The New York Times. Retrieved May 16, 2012.
- ^ Katy Burne (April 10, 2012). "Making Waves Against 'Whale'". The Wall Street Journal. Retrieved May 16, 2012.
- ^ Farah Khalique (May 11, 2012). "Chart of the Day: London Whale trading". Financial News. Retrieved May 16, 2012.
- ^ "Crony Capitalism: After Lobbying Against New Financial Regulations, JPMorgan Loses $2B in Risky Bet". Democracy Now!. May 15, 2012. Retrieved May 16, 2012.
- ^ Jessica Silver-Greenberg; Peter Eavis (May 10, 2012). "JPMorgan Discloses $2 Billion in Trading Losses". The New York Times. Retrieved May 16, 2012.
- ^ "2003 Credit Derivatives Definitions". Isda.org. Archived from the original on August 29, 2010. Retrieved August 27, 2010.
- ^ "Euro-Parliament bans "naked" Credit Default Swaps". EUbusiness. November 16, 2011. Retrieved November 26, 2011.
- ^ "Risk.Net :: Special Report". Archived from the original on September 29, 2007.
- ^ "Settlement Auction for Lehman CDS: Surprises Ahead?". Seeking Alpha. October 10, 2008. Retrieved August 27, 2010.
- ^ "In depth: Fed to hold CDS clearance talks". Ft.com. Archived from the original on December 10, 2022. Retrieved August 27, 2010.
- ^ a b "Isda Ceo Notes Success Of Lehman Settlement, Addresses Cds Misperceptions". Isda.org. October 21, 2008. Archived from the original on December 13, 2010. Retrieved August 27, 2010.
- ^ Salmon, Felix (March 1, 2012). "How Greece's Default Could Kill The Sovereign CDS Market". Seeking Alpha. Retrieved March 1, 2012.
- ^ Watts, William L., "No Greek CDS payout on swap, panel says", MarketWatch, March 1, 2012. Retrieved 2012-03-01.
- ^ Markit. Tradeable Credit Fixings. Retrieved 2008-10-28.
- ^ "Year Credit Event Fixing". www.creditfixings.com. Retrieved January 26, 2017.
- ^ cds1.xls (Prof. Chris Lamoureux, University of Arizona)
- ^ Credit Default Swaps (Prof. Christopher Foot, Oxford University)
- ^ a b CS01, fincyclopedia.net
- ^ The Pricing and Risk Management of Credit Default Swaps, OpenGamma Quantitative Research
- ^ a b ENNs for Corporate and Sovereign CDS and FX Swaps, cftc.gov
- ^ CS01 risk, fincyclopedia.net
- ^ "Gannett and the Side Effects of Default Swaps". The New York Times. June 23, 2009. Retrieved July 14, 2009.
- ^ "Protecting GM from Credit Default Swap Holders". Firedoglake. May 14, 2009. Retrieved July 14, 2009.
- ^ a b "/ Financials — Lehman CDS pay-outs higher than expected". Ft.com. October 10, 2008. Archived from the original on December 10, 2022. Retrieved August 27, 2010.
- ^ "Daily Brief". October 28, 2008. Archived from the original on January 11, 2009. Retrieved November 6, 2008.
- ^ Buffett, Warren (February 21, 2003). "Berkshire Hathaway Inc. Annual Report 2002" (PDF). Berkshire Hathaway. Retrieved September 21, 2008.
- ^ Olsen, Kim Asger, "Pay-up time for Lehman swaps", atimes.com, October 22, 2008.
- ^ Holm, Erik (November 21, 2008). "Berkshire Asked by SEC in June for Derivative Data (Update1)". Bloomberg. Retrieved August 27, 2010.
- ^ Buffett, Warren (February 27, 2009). "Berkshire Hathaway Inc. Annual Report 2008" (PDF). Berkshire Hathaway. Retrieved December 21, 2009.
- ^ Ambac, MBIA Lust for CDO Returns Undercut AAA Success (Update2), Christine Richard, bloomberg, jan 22, 2008. Retrieved 2010 4 29.
- ^ Credit Default Swaps: Monolines faces litigious and costly endgame, Aug 2008, Louise Bowman, euromoney.com. Retrieved 2010 4 29.
- ^ Supreme Court of New York County (April 2009). "MBIA Insurance Co. v Merrill Lynch" (PDF). mbia.com. Archived from the original (PDF) on December 18, 2010. Retrieved April 23, 2010.
- ^ MBIA Sues Merrill Lynch , Wall Street Journal, Serena Ng, 2009 May 1. Retrieved 2010 4 23.
- ^ UPDATE 1-Judge dismisses most of MBIA's suit vs Merrill Apr 9, 2010, Reuters, Edith Honan, ed. Gerald E. McCormick
- ^ Investing Daily (September 16, 2008). "AIG, the Global Financial System and Investor Anxiety". Kciinvesting.com. Archived from the original on February 10, 2009. Retrieved August 27, 2010.
- ^ Unregulated Credit Default Swaps Led to Weakness. All things Considered, National Public Radio. Oct 31, 2008.
- ^ a b Nirenberg, David Z.; Steven L. Kopp. (August 1997). "Credit Derivatives: Tax Treatment of Total Return Swaps, Default Swaps, and Credit-Linked Notes". Journal of Taxation.
- ^ a b Peaslee, James M.; David Z. Nirenberg (November 26, 2007). "Federal Income Taxation of Securitization Transactions: Cumulative". Supplement No. 7: 83. Retrieved July 28, 2008.
{{cite journal}}: Cite journal requires|journal=(help) - ^ Ari J. Brandes (July 21, 2008). "A Better Way to Understand Credit Default Swaps". Tax Notes. SSRN 1121263.
- ^ a b Id.
- ^ Peaslee & Nirenberg, 89.
- ^ I.R.S. REG-111283-11, IRB 2011-42 (Oct. 17, 2011).
- ^ Diane Freda, I.R.S. Proposed Rules Mistakenly Classify Section 1256 Contracts, I.R.S. Witnesses Say, DAILY TAX REP. (BNA) No. 12 at G-4 (Jan. 20, 2012).
- ^ a b James Blakey, Tax Naked Credit Default Swaps for What They Are: Legalized Gambling, 8 U. Mass. L. Rev. 136 (2013).
- ^ See Hearing to Review the Role of Credit Derivatives in the U.S. Economy, Before H. Comm. on Agriculture, at 4 (Nov. 20, 2008) (statement of Eric Dinallo, Superintendent of New York State Ins. Dept.) (declaring that "[w]ith the proliferation of various kinds of derivatives in the late 20th Century came legal uncertainty as to whether certain derivatives, including credit default swaps, violated state bucket shop and gambling laws. [The Commodity Futures Modernization Act of 2000] created a ‘safe harbor’ by . . . preempting state and local gaming and bucket shop laws . . .") available at [1].
- ^ Commodity Futures Modernization Act of 2000, H.R. 5660, 106th Cong. § 117(e)(2).
- ^ "FASB 133". Fasb.org. June 15, 1999. Archived from the original on June 29, 2010. Retrieved August 27, 2010.
- ^ "Final Results of the Movie Gallery Auction, October 23, 2007". (archived 2009)
- ^ "1999 ISDA Credit Derivatives Definitions". International Swaps and Derivatives Association. Retrieved September 13, 2020.
- ^ "2003 ISDA Credit Derivatives Definitions". International Swaps and Derivatives Association. Retrieved September 13, 2020.
- ^ "2014 ISDA Credit Derivatives Definitions". International Swaps and Derivatives Association. June 30, 2014. Retrieved September 13, 2020.
External links
[edit]- Barroso considers ban on speculation with banning purely speculative naked sales on credit default swaps of sovereign debt
- CBS '60 minutes' video on CDS
- 2003 ISDA Credit Derivatives Template. International Swaps and Derivatives Association
Credit default swap
View on GrokipediaA credit default swap (CDS) is a financial derivative in which one counterparty, the protection buyer, makes periodic premium payments to another counterparty, the protection seller, in exchange for a contingent payment triggered by a specified credit event—typically the default or bankruptcy of a reference entity such as a corporate borrower or sovereign issuer—on an underlying debt obligation.[1] The contract allows the transfer of credit risk without the need to own or trade the reference asset, functioning akin to insurance against default while enabling speculation on creditworthiness.[2] Developed in the mid-1990s by JPMorgan to hedge credit exposures in its loan portfolio, the CDS market initially facilitated risk management for banks holding illiquid loans but rapidly evolved into a vehicle for broader speculation and arbitrage as trading volumes surged.[3] By the early 2000s, notional outstanding exceeded $10 trillion, peaking at around $60 trillion before the 2008 global financial crisis, during which opaque CDS positions amplified systemic risks, particularly through naked protection sales by insurers like AIG that lacked sufficient collateral, leading to taxpayer-funded bailouts exceeding $180 billion for AIG alone.[4][5] Post-crisis reforms under the Dodd-Frank Act mandated central clearing and margin requirements for standardized CDS to mitigate counterparty risk and enhance transparency, reducing gross notional to approximately $8.5 trillion by late 2023 while preserving the instrument's utility for hedging corporate and sovereign debt.[2][4]
Definition and Basic Mechanics
Parties Involved and Contract Essentials
A credit default swap (CDS) involves two primary parties: the protection buyer and the protection seller. The protection buyer, often a lender or bondholder seeking to hedge credit risk, pays periodic premiums to the protection seller.[2][6] In return, the protection seller assumes the risk of loss from a credit event affecting the reference entity, compensating the buyer upon such an event.[2][6] These parties typically enter the contract via over-the-counter agreements governed by the International Swaps and Derivatives Association (ISDA) master agreement, which standardizes terms to facilitate trading.[7] Essential contract elements include the notional amount, representing the face value of the protected debt without requiring ownership of the underlying obligation.[2][8] The reference entity—such as a corporation, sovereign, or specific obligation like a bond—is explicitly named, with protection tied to its creditworthiness rather than the buyer's holdings.[2][6] Premiums, known as the CDS spread, are quoted in basis points per annum on the notional (e.g., 100 basis points equals 1% annually) and paid quarterly until maturity or a credit event.[2][8] Maturity terms range from 1 to 10 years, with 5-year contracts most common in practice, aligning with typical bond durations.[2] Credit events triggering payout—defined by ISDA protocols—encompass bankruptcy, failure to pay principal or interest exceeding a threshold (often $1 million), and in some jurisdictions, restructuring of debt terms.[9][6] Settlement occurs via cash (notional minus recovery value) or physical delivery of defaulted obligations, with auctions determining recovery rates post-event.[2][6] Contracts may include clauses limiting deliverable obligations, such as maturity caps on restructurings to curb moral hazard.[10]Credit Events and Payout Triggers
Credit events in credit default swap (CDS) contracts are specified occurrences affecting the reference entity's ability to meet obligations, triggering the protection seller's payout to the buyer. These events are standardized under the International Swaps and Derivatives Association (ISDA) Credit Derivatives Definitions, with the 2014 edition incorporating updates such as refined restructuring terms and a new governmental intervention credit event for financial entities to address bail-in scenarios.[11][12] Standard credit events include:- Bankruptcy: The reference entity becomes insolvent or subject to formal winding-up proceedings under applicable law.
- Failure to pay: Non-payment of principal or interest on a reference obligation exceeding a minimum threshold, typically after any grace period.[13]
- Restructuring: A reduction in the principal amount, interest rate, or maturity extension on a reference obligation, though often excluded or modified in North American contracts to reduce ambiguity and disputes.[13][14]
- Obligation acceleration: A reference obligation becomes due and payable earlier than scheduled due to default.[13]
- Repudiation or moratorium: The reference entity disavows or imposes a moratorium on payments under obligations.[13]
Distinctions from Insurance and Guarantees
Credit default swaps (CDS) differ from traditional insurance contracts primarily in the absence of an insurable interest requirement for the protection buyer. In insurance, the policyholder must demonstrate a legitimate economic stake in the insured asset or event to prevent contracts from functioning as wagers, whereas CDS permit "naked" positions where the buyer holds no underlying exposure to the reference entity, enabling speculation on credit events without ownership of the referenced debt.[17][18] This distinction arose from the derivative nature of CDS, standardized by the International Swaps and Derivatives Association (ISDA) since the 1990s, which treats them as bilateral agreements for risk transfer rather than indemnity against actual loss.[19] Regulatory treatment further separates CDS from insurance. CDS fall under derivatives oversight, such as the U.S. Commodity Futures Modernization Act of 2000 and post-2008 Dodd-Frank Act provisions mandating central clearing for certain standardized contracts, without imposing insurance-style solvency reserves or capital adequacy rules on protection sellers.[20][21] Insurance regulators, by contrast, enforce strict reserve requirements to ensure payout capacity, as seen in state-level guaranty funds for policyholders; CDS sellers rely instead on collateral posting and netting agreements, which proved insufficient during the 2008 crisis when entities like AIG faced unmatched exposures.[22] CDS contracts are also freely transferable via assignment or novation under ISDA protocols, unlike insurance policies that typically require insurer consent and cannot be traded on secondary markets.[22] Compared to financial guarantees, such as bank letters of credit or surety bonds, CDS lack a direct, unconditional obligation from the protection seller to the reference entity's creditor. Guarantees involve a third-party guarantor stepping into the primary obligor's shoes upon default, often regulated as banking products with on-balance-sheet treatment and higher capital charges under frameworks like Basel III.[23][24] In CDS, payouts occur via cash settlement based on an auction-determined recovery rate applied to the notional amount—typically (1 - recovery rate) × notional—independent of the buyer's actual holdings, and subject to two-way payments including periodic premiums until maturity or trigger.[25] This structure facilitates arbitrage and liquidity in derivatives markets but exposes counterparties to bilateral default risk, mitigated post-2008 through mandatory margining rather than guarantee-like enforceability.[26]Economic Functions and Market Uses
Hedging Against Credit Deterioration
Credit default swaps (CDS) enable entities exposed to credit assets, such as bonds or loans, to hedge against the risk of the reference entity's credit deterioration or default without liquidating their holdings. By purchasing protection, the buyer transfers the credit risk to the seller in exchange for periodic premium payments, thereby isolating and mitigating potential losses from adverse credit events like bankruptcy or failure to pay.[27][28] Banks and portfolio managers commonly employ CDS for this purpose, particularly to manage unsecured loan exposures, as evidenced by regulatory data showing banks' propensity to hedge such risks via the CDS market.[27] In a hedging scenario, the protection buyer—typically holding the underlying credit instrument—pays a fixed spread (expressed in basis points) on the notional amount to the seller over the contract's tenor, which ranges from 1 to 10 years. If a credit event occurs, the seller compensates the buyer for the loss, calculated as the notional amount multiplied by (1 minus the recovery rate on the defaulted obligation), often determined via auction processes standardized by the International Swaps and Derivatives Association (ISDA). This mechanism allows hedgers to retain the yield from their credit assets while offsetting default risk, making CDS more efficient than alternatives like diversification or asset sales, which may introduce unintended market or liquidity risks.[29][30] Empirical studies confirm CDS effectiveness in hedging, with single-name CDS spreads reflecting real-time assessments of borrower credit risk, enabling precise risk transfer for specific exposures rather than broad portfolio adjustments. For instance, during periods of credit stress, hedgers using CDS have demonstrated reduced net credit losses compared to unhedged positions, underscoring the instrument's role in stabilizing balance sheets amid borrower deterioration. However, hedging efficacy depends on factors like spread accuracy and counterparty reliability, as post-2008 reforms mandated central clearing for many CDS to mitigate systemic risks.[31][2]Enabling Speculation on Creditworthiness
Credit default swaps (CDS) enable speculation on the creditworthiness of reference entities by permitting "naked" positions, where participants buy or sell protection without holding the underlying debt obligation.[32] This contrasts with traditional hedging, as naked CDS require no insurable interest in the reference asset, allowing market participants to wager directly on the likelihood of default or credit deterioration solely through premium payments and potential payouts.[2] Such contracts facilitate leveraged bets, where the notional amount covered can vastly exceed the initial premium outlay, amplifying potential gains or losses relative to direct bond investments or short-selling, which involve borrowing costs and ownership requirements.[32] To speculate on declining creditworthiness, an investor purchases CDS protection at a low spread (e.g., 500 basis points annually), anticipating that rising default risk will widen spreads to, say, 1,500 basis points; the buyer can then unwind the position for a profit by selling equivalent protection at the higher rate or hold for a payout upon a credit event.[33] Conversely, to bet on improving or stable credit, the seller writes protection at elevated spreads, collecting premiums over the contract tenor (typically 5 years) if no default occurs, effectively earning yield on an optimistic view of the reference entity's solvency.[9] These mechanics decouple speculation from physical asset ownership, enabling rapid scaling of positions via over-the-counter trading, though they expose counterparties to settlement risks absent central clearing.[34] The scale of CDS speculation became evident in the mid-2000s, when the market's notional outstanding reached $62.2 trillion by the end of 2007, exceeding the value of underlying corporate and sovereign debt markets and indicating that hedging alone could not account for such volume.[35] This proliferation fueled bets on subprime mortgage exposures during the 2008 financial crisis, where speculators purchased CDS on collateralized debt obligations, profiting as defaults materialized and spreads surged, though it also contributed to liquidity strains when sellers like AIG faced massive payout obligations.[9] Post-crisis analyses noted that while speculation via naked CDS enhanced price discovery for credit risks, it amplified systemic vulnerabilities by concentrating unhedged exposures among a few intermediaries.[36] Regulations, such as the European Union's 2012 ban on naked sovereign CDS, aimed to curb such activity for government debt, but broader U.S. markets retained flexibility for speculative trading under Dodd-Frank mandates for clearing.[37]Facilitating Arbitrage Across Markets
Credit default swaps (CDS) enable arbitrage by allowing market participants to synthetically replicate or hedge bond exposures, exploiting pricing inefficiencies between the more liquid CDS derivatives market and the cash bond market. The CDS-bond basis—calculated as the CDS spread minus the bond's asset swap or Z-spread over the risk-free rate—quantifies such discrepancies; a negative basis occurs when the CDS spread is lower than the bond spread, implying the bond offers higher yield relative to the cost of protection. In this scenario, arbitrageurs buy the cash bond, purchase CDS protection on the same reference entity, and finance the bond purchase through low-cost repo funding, locking in risk-free profit from the basis convergence assuming no credit event, as the net carry (bond yield minus CDS premium minus funding cost) remains positive.[38][39] Conversely, a positive basis—where the CDS spread exceeds the bond spread—prompts the opposite trade: shorting the bond (via securities lending or swaps) and selling CDS protection, collecting the higher premium while offsetting the short bond's cost. These trades, prominent in investment-grade corporate credits, rely on CDS standardization under ISDA protocols to ensure deliverable obligations align between markets, minimizing basis risk from mismatched recovery assumptions. Empirical data from 2004–2007 indicate average negative bases of 20–50 basis points for U.S. corporates, widening to over -200 basis points during the 2008 crisis due to bond market illiquidity and flight-to-quality effects, which amplified arbitrage opportunities but also exposed limits from counterparty exposures and regulatory capital constraints.[38][40] CDS also facilitate cross-market arbitrage involving indices versus single-name contracts, such as discrepancies between CDX.IG index spreads and underlying constituents, driven by hedging demand or liquidity premia. For instance, if the index trades at a wider spread than the sum of single-name protections adjusted for correlation, arbitrageurs sell index protection and buy single-name CDS, profiting from mean reversion; Federal Reserve analysis shows such index-single basis trades averaged 10–30 basis points pre-crisis, narrowing post-Dodd-Frank central clearing mandates that reduced settlement frictions. These mechanisms enhance overall market efficiency by propagating credit signals across venues, though persistent bases reflect structural barriers like dealer balance sheet costs and heterogeneous investor mandates.[38][2]Historical Evolution
Origins in the 1990s
Credit default swaps emerged in the early 1990s as bilateral over-the-counter derivatives designed by major banks to transfer credit risk from loan portfolios to third-party counterparties, thereby alleviating regulatory capital burdens without requiring the sale of underlying assets that could strain client relationships. J.P. Morgan led the innovation, with its swaps team, including Blythe Masters, engineering the first CDS transaction in late 1994 to hedge exposure on a $4.8 billion credit line extended to an oil company.[41] This structure involved the protection buyer paying periodic premiums to the seller, who would compensate for losses upon a credit event such as default, effectively synthetically replicating loan securitization while circumventing traditional insurance regulations.[3] Initial adoption was limited to a handful of institutions, including precursors at Bankers Trust as early as 1991, but the instruments gained traction among commercial and investment banks facing growing loan books amid economic expansion and emerging market lending.[42] The OTC nature allowed customization to specific reference obligations, typically corporate bonds or loans, but also introduced counterparty risk and valuation challenges due to the absence of centralized pricing or clearing. Market volumes remained modest throughout the decade, reflecting nascent liquidity and reliance on dealer relationships rather than broad exchange trading.[34] Standardization efforts by the International Swaps and Derivatives Association (ISDA), originally formed in 1985, accelerated development toward the end of the 1990s, with the release of the first CDS confirmation template in 1998 paving the way for the 1999 master agreement that defined key terms like credit events and settlement protocols.[2] This facilitated wider participation beyond banks, including insurers and hedge funds, though the market's total notional value stayed under $1 trillion by decade's end, concentrated on investment-grade credits.[43] Early CDS thus served primarily as hedging tools, enabling risk dispersion but foreshadowing complexities in opaque bilateral dealings.Rapid Growth Through the Early 2000s
The notional amounts outstanding of credit default swaps expanded dramatically in the early 2000s, transitioning from a niche instrument to a cornerstone of credit markets. Bank for International Settlements (BIS) data indicate that CDS outstanding notionals reached $6.3 trillion by the end of 2004, reflecting accelerated adoption by financial institutions for risk transfer. This marked a substantial increase from earlier years, with growth rates exceeding 50% annually in some periods, driven by the market's maturation following initial standardization efforts.[34] By the end of 2005, outstanding notionals had surged to $13.7 trillion, including a 33% rise in the second half of the year alone, underscoring the instrument's appeal amid volatile credit conditions.[44] Several empirical factors propelled this expansion. High-profile corporate defaults, including Enron's bankruptcy filing on December 2, 2001, and WorldCom's on July 21, 2002, elevated perceptions of credit risk in investment-grade debt, spurring demand for CDS as a hedging mechanism against bond and loan defaults. Investors and banks, facing losses from these events totaling over $100 billion in market value for affected securities, increasingly turned to CDS for targeted protection without selling underlying assets, preserving yield in portfolios.[34] Regulatory incentives under evolving Basel frameworks further catalyzed growth, as CDS enabled banks to achieve capital relief by transferring credit risk to third parties, reducing required reserves against loans and bonds.[45] The International Swaps and Derivatives Association's (ISDA) 2003 Credit Derivatives Definitions enhanced contract uniformity, reducing legal uncertainties and broadening participation beyond major dealers to include hedge funds and insurers. This standardization, building on the 1999 ISDA Master Agreement, improved liquidity and pricing efficiency, with single-name CDS dominating early volumes. Emerging uses in structured finance amplified the trend, as CDS underpinned synthetic collateralized debt obligations (CDOs), allowing creation of leveraged credit exposures without originating physical assets.[2] Dealer banks, such as JPMorgan and major European institutions, actively intermediated, quoting tight spreads and netting positions internally to expand balance sheet capacity for loan origination. By 2004-2005, gross notionals outpaced underlying debt markets, signaling not only hedging but also speculative arbitrage on credit spreads widening post-default waves.[46] This phase established CDS as a primary tool for dynamic credit risk management, though concentrations in dealer exposures foreshadowed systemic interconnections.[21]Involvement in the 2008 Crisis
Credit default swaps (CDS) expanded dramatically in the years leading to the 2008 financial crisis, with notional amounts outstanding reaching $62.2 trillion by the end of 2007, more than doubling annually from the late 1990s.[34] This growth was fueled by their use to hedge and speculate on credit risks embedded in mortgage-backed securities (MBS) and collateralized debt obligations (CDOs), particularly those backed by subprime loans. CDS allowed banks and investors to transfer default risk off balance sheets, but the concentration of protection selling by entities like AIG created systemic vulnerabilities, as these instruments often lacked sufficient collateral or capital backing.[47] A pivotal example was American International Group (AIG), which had issued CDS protection with a notional value of $527 billion as of December 31, 2007, including significant exposure to multi-sector CDOs totaling around $78 billion.[48] As subprime mortgage defaults surged in 2007–2008, the underlying CDOs deteriorated, triggering mark-to-market losses and collateral demands on AIG. Rating agency downgrades on September 15, 2008, exacerbated this, leading to unmet collateral calls that threatened AIG's solvency and necessitated a $182 billion U.S. government bailout to prevent broader contagion, as AIG's role as a major protection seller interconnected it with numerous counterparties.[49] The episode highlighted how CDS amplified counterparty risk in an unregulated over-the-counter market, where sellers like AIG underestimated tail risks from correlated defaults in housing-related assets.[2] The bankruptcy of Lehman Brothers on September 15, 2008, tested the CDS settlement mechanism amid $400 billion in outstanding contracts on its debt.[50] An ISDA-organized auction determined recovery at 8.625 cents on the dollar, resulting in net payouts of approximately $5.2 billion from protection sellers to buyers, demonstrating the protocol's functionality despite market stress.[51] However, the event underscored CDS's role in magnifying panic, as widening spreads signaled distress and forced deleveraging across institutions, contributing to frozen credit markets. While CDS spreads had foreshadowed vulnerabilities in vulnerable credits earlier than bond prices, the instruments' speculative "naked" use—betting on defaults without owning the reference asset—intensified liquidity strains without providing the stabilizing insurance-like discipline.[52] Overall, CDS did not originate the housing bubble but propagated risks through leverage and opacity, prompting post-crisis demands for central clearing and margin requirements.[34]Reforms and Market Adaptation Post-2008
Following the 2008 financial crisis, which exposed vulnerabilities in the over-the-counter (OTC) credit default swap (CDS) market due to opacity and interconnected counterparty risks, G20 leaders in 2009 committed to reforms mandating central clearing, trade reporting, and margin requirements for standardized OTC derivatives, including CDS, to mitigate systemic risk.[53] In the United States, the Dodd-Frank Wall Street Reform and Consumer Protection Act, enacted on July 21, 2010, established Title VII to regulate swaps markets; it required clearing of eligible CDS contracts through central counterparties (CCPs) designated by the Commodity Futures Trading Commission (CFTC), with final rules for CDS and interest rate swaps issued on November 28, 2012.[54] [55] The European Union's European Market Infrastructure Regulation (EMIR), effective from August 16, 2012, imposed analogous requirements, including mandatory clearing for certain CDS indices and reporting of all derivatives trades to trade repositories to enhance transparency.[34] Market participants, led by the International Swaps and Derivatives Association (ISDA), implemented operational adaptations concurrently; the 2009 "Big Bang" and "Small Bang" protocols standardized CDS contract terms, introduced cash settlement via auctions for credit events, and established ISDA Determinations Committees to resolve disputes objectively, reducing litigation risks observed during the crisis.[56] These changes, combined with regulatory mandates, shifted much of the CDS market to CCPs; cleared CDS transactions rose from approximately 15% of the market in December 2007 to about 75% by April 2015, with further increases in subsequent years as more contracts became eligible.[57] [58] Post-reform adaptations included greater contract standardization under ISDA's 2014 definitions, which facilitated compression cycles to net out offsetting positions, contributing to a contraction in gross notional amounts outstanding—from a peak of around $60 trillion in 2007 to under $10 trillion by 2018—while maintaining hedging and price discovery functions.[59] [34] Enhanced trade reporting to repositories like the DTCC improved market transparency, enabling better regulatory oversight and reducing information asymmetries that amplified crisis-era spillovers, though some studies indicate a partial shift in price leadership dynamics away from CDS relative to cash bonds due to these mandates.[58] [60] Overall, these reforms diminished the market's systemic footprint by curtailing uncleared bilateral exposures and speculative naked positions, fostering resilience without eliminating CDS utility for credit risk transfer.[61]Developments from 2020 to 2025
In 2020, the COVID-19 pandemic triggered sharp increases in corporate and sovereign credit default swap (CDS) spreads, reflecting heightened default risks from disrupted cash flows and elevated discount rates amid global lockdowns and economic contractions.[62] The year recorded the highest number of credit default events since 2009, with CDS markets experiencing volatility peaks in March as infection rates surged, though liquidity held amid central bank interventions.[63] [64] Emerging market sovereign CDS spreads widened due to lockdown fears and confidence erosion, amplifying contagion risks.[65] Regulatory frameworks, shaped by post-2008 reforms, continued influencing CDS dynamics, with mandatory central clearing and margin requirements reducing counterparty risks but altering price discovery; studies post-2020 confirmed CDS still led equity prices in many cases despite these constraints.[66] In June 2020, FINRA extended an interim pilot under Rule 4240, adjusting margin thresholds for certain CDS to adapt to evolving market conditions without full deregulation.[67] The 2022 Russian invasion of Ukraine caused explosive CDS spread widening, with Russia's five-year sovereign CDS surging over 400 basis points in the initial weeks to exceed 1,000 bps, driven by sanctions and economic isolation, while Ukraine's reached 10,951 bps by September.[68] [69] This event heightened global risk contagion, as evidenced by correlated spikes in European and energy-exposed sovereign CDS, underscoring CDS sensitivity to geopolitical shocks over fundamentals alone.[70] From 2023 to 2025, CDS trading volumes rebounded, with European CDS notional amounts climbing 55.4% to $2.5 trillion in Q2 2025, signaling renewed hedging demand amid inflation and rate hikes.[71] U.S. sovereign CDS spreads rose notably in 2025, with one-year premiums reaching 52 basis points by May from 16 at year-start, fueled by fiscal deficit concerns and debt sustainability doubts, prompting investor hedging against potential downgrades.[72] [73] Overall, empirical reviews through mid-2025 affirmed CDS efficacy as hedges, though with persistent biases in pricing relative to realized defaults post-crisis regulations.[74]Contract Specifications
Core Terms: Premiums, Notional Amounts, and Tenors
In credit default swaps (CDS), the notional amount denotes the principal value of the reference obligation insured against credit events, serving as the reference for premium computations and contingent payouts. This amount does not involve actual principal exchange but defines the exposure transferred; for instance, a $10 million notional implies protection on debt equivalent to that sum.[75][7] The premium, or CDS spread, comprises the fixed or floating payments from the protection buyer to the seller, expressed in basis points annually on the notional and typically disbursed quarterly in arrears until maturity or a credit event. Post-2009 ISDA standardization, contracts shifted to fixed coupons—100 basis points for investment-grade credits and 500 for speculative-grade—with an upfront payment adjusting for the prevailing spread to ensure fair value at inception.[76] This structure enhances liquidity by standardizing cash flows while accommodating varying credit risks through the upfront component.[30] The tenor specifies the contract's duration, aligning the protection period with the reference entity's debt horizon, commonly 1, 3, 5, 7, or 10 years, wherein the 5-year tenor predominates due to its alignment with benchmark bond maturities and superior market depth. Tenors cannot exceed the reference obligation's maturity to maintain economic equivalence, though mismatches can arise, influencing pricing via term structure analysis.[77][75] These terms collectively delineate the CDS's risk transfer mechanics, with notional scaling exposure, premiums reflecting default probability costs, and tenor bounding temporal coverage.[7]ISDA Standard Documentation
The International Swaps and Derivatives Association (ISDA) develops standardized contractual frameworks for over-the-counter derivatives, including credit default swaps (CDS), to promote legal certainty, operational efficiency, and risk mitigation across global markets.[78] These documents establish uniform terms that counterparties adopt, reducing negotiation time and disputes by providing predefined provisions for events such as defaults, settlements, and close-outs.[79] The foundational element is the ISDA Master Agreement, available in 1992 and 2002 versions, which serves as the overarching bilateral contract governing all derivatives transactions between two parties, encompassing CDS alongside other instruments.[78] It includes a Schedule for counterparty-specific elections, such as governing law (typically English or New York), termination events, and credit support annexes for collateral requirements.[80] For CDS, the Master Agreement outlines general obligations like payment netting and close-out netting upon default, but defers product-specific terms to supplemental definitions and confirmations.[81] CDS-specific standardization occurs through the ISDA Credit Derivatives Definitions, first published in 1999 and substantially revised in the 2003 edition to address growing market complexity, including detailed credit events like bankruptcy, failure to pay, and restructuring.[11] The 2003 Definitions were supplemented post-2008 financial crisis with terms for auction-based settlements, standardized upfront payments, and determinations committees to resolve ambiguities in credit events and recovery rates.[82] These were consolidated and updated in the 2014 ISDA Credit Derivatives Definitions, effective September 22, 2014, which refined restructuring mechanics—limiting them to North American or European variants—and introduced provisions for credit default swaps on sovereigns or indices to align with regulatory reforms like Dodd-Frank and EMIR.[11] [83] Individual CDS trades are documented via Confirmations, short-form agreements referencing the Master Agreement and applicable Definitions, specifying transaction details such as the reference entity, notional amount, premium rate, tenor (e.g., 5 years), and settlement method (physical delivery or cash via auction).[84] Confirmations may include bespoke clauses negotiated for non-standard features, like credit events for distressed debt restructurings, but adherence to ISDA standards minimizes legal risks, as evidenced by widespread adoption where over 90% of CDS notional uses these templates.[85] Protocols, such as the 2014 Credit Derivatives Definitions Protocol, allow multilateral amendments to legacy trades for consistency with updated Definitions, with over 800 adherents by 2015 facilitating seamless market transitions.[79]Customization and Negotiation Clauses
Credit default swap (CDS) contracts are primarily governed by standardized documentation from the International Swaps and Derivatives Association (ISDA), including the ISDA Master Agreement and Credit Derivatives Definitions, which provide a common framework to reduce negotiation time and legal uncertainty. However, parties retain flexibility to customize and negotiate certain clauses via the Schedule to the Master Agreement and transaction-specific confirmations, allowing tailoring to particular risk profiles, reference entities, or market conditions.[86][87] A core area of negotiation involves the definition of credit events that trigger protection payments, such as bankruptcy, failure to pay, obligation default, obligation acceleration, and restructuring. Restructuring, in particular, can be customized: parties may elect "full restructuring" (covering broad debt modifications), "modified restructuring" (limiting to specific obligations), or exclude it entirely to avoid disputes over minor changes, as seen in historical variations where inclusion of restructuring affected contract pricing and liquidity.[2][10] These choices influence the contract's sensitivity to issuer-specific distress, with data from 2003 showing modified restructuring dominating North American corporate CDS quotes due to its balance of protection breadth and deliverability constraints.[10] Other negotiable terms include the reference entity (e.g., a sovereign or corporation) and eligible obligations, notional amount, tenor (typically 1-10 years), and settlement method—physical delivery of defaulted bonds or cash settlement via ISDA auctions. Parties may also negotiate succession events (e.g., mergers transferring obligations), governing law (often New York or English), and dispute resolution mechanisms to address jurisdiction-specific risks.[88][2] For bespoke needs, such as index tranches or single-name protection on non-standard credits, confirmations supplement standards with additional provisions on upfront payments or accrued premiums.[87] Negotiations typically occur bilaterally in the over-the-counter market, where dealers propose terms based on prevailing conventions, but customization enables hedging specific exposures, such as limiting protection to senior debt tranches. Post-2008 reforms via Dodd-Frank and EMIR have pushed more standardized CDS toward central clearing, yet non-cleared contracts retain these negotiation flexibilities, subject to margin requirements and reporting. Empirical evidence from market data indicates that customized restructuring elections persist, with exclusion more common for investment-grade references to minimize basis risk between CDS and underlying bonds.[2][10]Valuation and Risk Assessment
Probability-Driven Pricing Models
Probability-driven pricing models for credit default swaps, commonly known as reduced-form or intensity-based models, conceptualize default as an exogenous event arriving according to a stochastic intensity process, rather than endogenously tied to firm asset values. These models estimate default probabilities directly from market data, such as bond yields or CDS spreads, under a risk-neutral measure. In CDS quoting conventions, spreads and upfront prices are standardized per 100 par value, akin to bond market practices, where 100 represents the virtual par or face value of the notional principal for consistency; this benchmark implies a fair value price of 100 with zero upfront payment when the market par spread equals the fixed coupon, and credit event compensation is (100 minus recovery rate) per 100 notional.[89] The hazard rate λ(t) governs the instantaneous default probability, with the survival probability to time t given by Q(τ > t) = exp(-∫₀ᵗ λ(s) ds), where τ denotes the default time modeled as the first arrival of a doubly stochastic Poisson process.[90][91] The CDS spread c is calibrated such that the discounted expected value of premium payments equals the discounted expected value of protection payments. The premium leg consists of fixed periodic payments c × notional until maturity T or default, discounted and weighted by survival probabilities: approximately ∑ c Δ_i P(0, t_i) Q(τ > t_i), where Δ_i is the accrual period, P(0, t_i) is the risk-free discount factor to payment date t_i, and payments are typically quarterly.[90] The protection leg captures the expected loss upon default: ∫₀ᵀ (1 - R) P(0, t) λ(t) Q(τ > t) dt, where R is the recovery rate (often assumed constant at 40% for senior unsecured debt based on historical data).[90][92] Equilibrium requires premium leg PV = protection leg PV, yielding c ≈ [∫₀ᵀ (1 - R) P(0, t) λ(t) Q(τ > t) dt] / [∑ Δ_i P(0, t_i) Q(τ > t_i)], often solved numerically for term-structured λ(t) fitted to the CDS term structure.[90] ![Cds_paymentstream_protection_loss_event.svg.png][center] Pioneering formulations include the Jarrow-Turnbull model, introduced in 1995, which employs a discrete-time Markov chain or continuous-time diffusion for the "health" state of the reference entity, deriving default probabilities from interest rate dynamics and observable spreads to price default-contingent claims like CDS.[93][91] In this framework, default risk is captured via transition probabilities in a binomial lattice, allowing calibration to bond prices and extension to CDS by valuing contingent premium streams and loss-given-default payments. The model assumes no arbitrage and risk-neutral valuation, with intensity derived inversely from credit spreads net of funding costs.[93][94] The Duffie-Singleton model, developed in 1997 and applied to CDS in subsequent work, equivalently transforms defaultable cash flows into risk-free equivalents by adjusting the discount rate with a credit spread λ(t)(1 - R), simplifying valuation to an annuity under modified rates.[90] For CDS, the fair spread U satisfies U = [B(h, T) / A(h, T)] × f, where h is the hazard rate (e.g., 4% implying 400 basis points spread for zero recovery), A(h, T) prices the defaultable annuity for premiums, B(h, T) values a unit payment at default, and f = 1 - R.[90] Assumptions include counterparty non-defaultability, constant recovery independent of default timing, and no moral hazard, with extensions for stochastic intensity via affine diffusions for tractability.[90][92] These models facilitate bootstrapping hazard rates from CDS quotes across maturities (e.g., 1Y to 10Y), assuming piecewise constant intensity between dates, and are widely used for marking-to-market due to their flexibility in fitting observed spreads without firm-specific balance sheet data. Empirical calibration often reveals implied intensities rising with tenor for distressed credits, reflecting cumulative default risk. Limitations include sensitivity to recovery assumptions—misestimating R by 10% can bias spreads by 20-50 basis points—and inability to predict defaults out-of-sample, as intensities are market-implied rather than forward-looking fundamentals.[90][91]No-Arbitrage Frameworks
No-arbitrage frameworks for credit default swap (CDS) valuation establish pricing consistency by ensuring that the contract's payoffs can be replicated using portfolios of reference entity bonds and risk-free securities, thereby preventing riskless profits. These frameworks equate the present value (PV) of the premium leg—consisting of periodic fixed payments until default or maturity—to the PV of the protection leg, which delivers the loss given default (notional amount minus recovery value) upon credit event, all under the risk-neutral measure.[92] Default times are modeled via intensity processes or extracted from bond prices, with hazard rates calibrated to match observed credit spreads while maintaining arbitrage-free dynamics.[92] A core replication argument, developed by Duffie in 1999, posits that a CDS synthetically replicates the difference between a risk-free floating-rate note and a credit-risky floating-rate note issued by the reference entity. The protection seller receives premiums akin to coupons on the risky note and pays out upon default, mirroring the credit spread compensation; under no-arbitrage with par instruments, zero recovery adjustments, and no counterparty risk, the CDS spread equals the asset swap spread on the reference bond.[90] Deviations occur for fixed-coupon bonds due to pull-to-par effects, but the framework adjusts via annuity factors: the exact spread satisfies , where PV01 is the risky annuity value, is recovery rate, default density, and risk-free rate.[90] [92] Hull and White's 2000 model formalizes this by bootstrapping cumulative default probabilities from corporate bond prices relative to Treasuries, assuming independence of rates, defaults, and constant recovery (e.g., 48.84% historical average from Moody's data through 1999). The premium leg PV incorporates survival probabilities and accrual payments post-default notification, while the protection leg discounts expected claims; no-arbitrage is enforced as the CDS-bond portfolio replicates a Treasury strip, yielding the spread formula , approximated as yield spread times recovery adjustment for short tenors.[92] This calibration ensures model-implied bond prices match market data, ruling out arbitrage across maturities.[92] Empirical applications reveal persistent CDS-bond basis deviations from zero—e.g., positive basis pre-2008 due to balance sheet constraints—indicating frictions like funding costs and liquidity premia, yet the framework bounds fair value and informs relative trades.[95] In reduced-form extensions, stochastic intensity models (e.g., Cox processes) preserve no-arbitrage by martingale pricing, with spreads sensitive to volatility in default risk but calibrated to term structure data as of contract inception.[95] These approaches underpin market standards, such as ISDA model implementations, prioritizing observable inputs over structural defaults for consistency.[92]Key Sensitivities and Greeks
Credit default swaps exhibit sensitivities to several underlying parameters in their valuation, which are analogous to the Greeks in option pricing but tailored to credit risk dynamics. The primary sensitivity measures include the credit spread 01 (CS01 or credit DV01), which quantifies the change in the CDS's mark-to-market value for a 1 basis point parallel shift in the credit curve, typically reflecting shifts in hazard rates or survival probabilities. For a protection buyer, an increase in spreads widens the value positively, as higher implied default risk enhances the expected protection payment relative to premiums.[76] The risky present value of a basis point (RPV01), also known as risky DV01, captures sensitivity to discounting factors by measuring the impact of a 1 basis point shift in the risk-free or funding curve on the present value of expected cash flows, adjusted for default probabilities along each leg. Unlike standard DV01 in fixed income, RPV01 incorporates survival probabilities, making it shorter for riskier credits where earlier default truncates distant flows; for instance, RPV01 approximates the premium leg's duration under no-default assumptions but diminishes with higher credit risk. Interest rate DV01 (IR DV01) isolates pure discounting effects, excluding credit adjustments.[75][76] Recovery rate sensitivity assesses the change in CDS value from a 1% shift in the assumed recovery rate upon default, which directly scales the protection leg's payoff as loss given default equals 1 minus recovery. Empirical recovery rates average around 40% for corporate bonds, but market-implied rates vary; a higher recovery assumption reduces protection value for buyers, amplifying sensitivity in high-spread CDS where default payouts dominate. Jump-to-default risk measures the immediate value shift assuming instantaneous default at current recovery levels, often approximated as notional times (1 - recovery rate) discounted to the valuation date.[96][76] These sensitivities are computed via finite difference approximations in pricing models, bumping input curves or parameters and recalculating present values of the premium and protection legs under no-arbitrage or reduced-form frameworks. For portfolio risk management, they facilitate hedging; for example, CS01 hedges match spread exposures across CDS or bonds, while RPV01 informs interest rate swaps for duration matching. Bucketed versions dissect sensitivities across maturities or curve segments for precise curve risk attribution.[76][96]Settlement Procedures
Physical Delivery Processes
In physical delivery settlement of a credit default swap (CDS), upon confirmation of a credit event such as a failure to pay or bankruptcy of the reference entity, the protection buyer delivers eligible deliverable obligations—typically bonds or loans issued by the reference entity—to the protection seller, who in turn pays the buyer the full par value (100%) of the notional amount, adjusted for the face value of the delivered obligations.[97] This mechanism transfers the actual defaulted assets, allowing the seller to potentially recover value through restructuring or liquidation, while compensating the buyer for the credit loss.[13] Physical delivery has historically been the default method in ISDA-standard CDS contracts, though its use has declined with the rise of auction-based cash settlement since 2005.[98] The process begins with the protection buyer submitting a Notice of Physical Settlement (NOPS) to the seller, specifying the Deliverable Obligations to be delivered, including their outstanding principal amounts and characteristics.[99] Deliverable Obligations must satisfy strict criteria outlined in the ISDA Credit Derivatives Definitions, such as being pari passu with or senior to the reference obligation, having a minimum remaining maturity (often at least one year from the delivery date), being fully transferable without consent restrictions, and not exceeding specified subordination levels.[100] The buyer retains the "cheapest-to-deliver" option, enabling selection of the least valuable eligible obligation among multiple candidates to maximize the net payout, which can introduce basis risk if the delivered asset's recovery differs from market expectations.[101] Delivery must occur within the contractual delivery period, typically up to 30 calendar days following the NOPS or the credit event notice, whichever is later, to mitigate ongoing market volatility.[102] Actual transfer involves standard securities settlement procedures, often via custodians or clearing systems like Euroclear or DTCC, with the seller paying the notional upon confirmation of receipt and validity of the obligations.[103] Failure to deliver valid obligations may result in partial or no payment, and disputes over eligibility are resolved per ISDA protocols, potentially involving dealer polls for valuation if partial delivery occurs.[99] This method exposes participants to operational risks, including shortages of deliverable obligations in stressed markets, which contributed to liquidity squeezes during events like the 2008 Lehman Brothers default.[102]Cash Settlement and Auction Mechanics
In cash settlement of credit default swaps (CDS), following a credit event such as a default on the reference obligation, the protection seller pays the protection buyer an amount equal to the notional principal multiplied by the loss percentage, calculated as 1 minus the recovery rate expressed as a fraction of par value.[16] The recovery rate is determined via a standardized auction process administered by the International Swaps and Derivatives Association (ISDA), which establishes a uniform market-based price for deliverable obligations to facilitate consistent payouts across contracts, particularly when outstanding CDS notional exceeds the available debt supply.[102] This mechanism, formalized in ISDA's 2009 protocols, replicates the economic outcome of physical settlement while avoiding logistical challenges like bond delivery squeezes.[99] The auction process commences after the ISDA Determinations Committee confirms a credit event and publishes a list of deliverable obligations, typically within 3 to 5 business days, allowing for challenges and finalization via committee vote or external review.[99] Participating CDS dealers, who handle submissions on behalf of market participants, first engage in an initial bidding phase where they provide inside market bid and offer prices for a small fixed notional amount, such as $2 million, spaced at intervals like 2% of par.[102] The best half of these submissions yield the inside market midpoint (IMM), which serves as a reference for subsequent caps, while net open interest (NOI)—the imbalance between net protection buyers and sellers intending physical settlement—is calculated to gauge directional demand.[16] The core auction then proceeds in a specific bidding phase, akin to a Dutch auction, where dealers submit limit orders to absorb the NOI: if NOI reflects net selling pressure (excess protection sellers), bids are matched starting from the highest until the imbalance clears; conversely for net buying.[102] The final price emerges as the highest accepted bid (or lowest accepted offer) that exhausts the NOI, subject to caps of the IMM plus or minus half the initial bid-offer spread to prevent manipulation.[16] For instance, in the 2008 Lehman Brothers auction, the IMM was 9.75 with NOI of $4.92 billion to sell, resulting in a final price of 8.625 after matching.[102] Similarly, the 2017 Toys "R" Us auction yielded a final price of 26 amid $81 million NOI to sell.[16] Post-auction, cash-settled CDS contracts reference the final price for payouts on the designated cash settlement date, typically shortly after finalization, with any unmatched open interest eligible for fallback physical settlement requests up to specified limits like $100 million per participant.[99] This process has conducted over 43 auctions since 2005, achieving high participation rates around 95% and recovery prices closely aligned with secondary bond markets, thereby enhancing settlement efficiency by netting gross exposures— as seen in Lehman, where $72 billion gross reduced to $5.2 billion net.[102] While effective for liquidity and uniformity, auctions incorporate anti-manipulation safeguards, though dealer dominance in positions can influence outcomes.[16]Regulatory Landscape
Pre-Crisis Environment and Oversight Gaps
Prior to the 2008 financial crisis, the credit default swap (CDS) market operated primarily as an over-the-counter (OTC) derivatives segment, characterized by bilateral contracts negotiated directly between counterparties without centralized exchange trading or mandatory disclosure.[34] The market experienced exponential growth, with gross notional amounts outstanding expanding from approximately $180 billion in 1997 to $34.4 trillion by the end of 2006, and peaking at around $62.2 trillion in late 2007.[104] [35] This surge was driven by demand for credit risk hedging and speculation, particularly on corporate debt and structured finance products, but occurred in an environment of minimal regulatory intervention that obscured systemic exposures.[105] The Commodity Futures Modernization Act (CFMA) of 2000 played a pivotal role in shaping this laissez-faire regime by granting broad exemptions for OTC derivatives, including CDS, from oversight by the Commodity Futures Trading Commission (CFTC) and prohibiting routine regulation of swaps by the Securities and Exchange Commission (SEC).[106] [107] Under the CFMA, CDS qualified as "swap agreements" excluded from securities laws such as the Securities Act of 1933 and the Securities Exchange Act of 1934, allowing them to evade registration, disclosure, and antifraud provisions typically applied to exchange-traded instruments.[108] This framework treated sophisticated institutional participants as capable of self-regulating risks, assuming limited need for public oversight, which aligned with prevailing free-market philosophies but overlooked potential externalities from interconnected leverage.[109] Oversight gaps were pronounced in several areas, including the absence of central clearinghouses, which left counterparty credit risks unmitigated and concentrated among a handful of dealers; for instance, five major banks intermediated over 80% of CDS transactions by 2007, amplifying potential contagion.[110] No mandatory margin or collateral requirements existed for non-cleared trades, enabling entities like insurers to under-reserve against massive exposures—AIG Financial Products alone held over $440 billion in notional CDS protection sold by mid-2008 without adequate hedges.[105] Furthermore, the lack of real-time trade reporting or position limits fostered opacity, as contracts were customized and privately held, preventing regulators from monitoring aggregate leverage or speculative "naked" positions where buyers held no underlying reference assets.[111] These deficiencies contributed to underestimation of tail risks during the subprime downturn, as evidenced by the rapid unraveling of CDS values on mortgage-related entities, though proponents of deregulation contend the market's innovation in risk transfer mitigated some localized defaults pre-crisis.[21] Empirical analyses post-crisis, however, highlight how bilateral netting assumptions failed under stress, exposing gaps in capital adequacy and resolution mechanisms for derivatives intermediaries.[112]Post-2008 Mandates: Central Clearing and Margins
Following the 2008 financial crisis, Title VII of the Dodd-Frank Wall Street Reform and Consumer Protection Act, enacted on July 21, 2010, introduced mandates for central clearing of standardized over-the-counter (OTC) derivatives, including specific classes of credit default swaps (CDS), to mitigate systemic risk by shifting counterparty exposure to central counterparties (CCPs). The Commodity Futures Trading Commission (CFTC) and Securities and Exchange Commission (SEC) were empowered to designate swaps for mandatory clearing through registered derivatives clearing organizations (DCOs), with the first CDS clearing requirements applying to certain untranched broad-based index CDS on North American and European corporate indices.[113] Mandatory clearing for these CDS classes commenced on March 11, 2013, for certain counterparties, expanding to cover approximately 75% of interest rate swaps and CDS notional amounts by mid-decade.[114][115] In the European Union, the European Market Infrastructure Regulation (EMIR), which entered into force on August 16, 2012, similarly required central clearing of certain OTC derivative classes through authorized CCPs to reduce counterparty and operational risks. EMIR's clearing obligation encompasses specific CDS categories, such as fixed-rate index CDS on iTraxx Europe and CDX indices, with implementation phased by counterparty type and size, beginning for financial counterparties in 2016.[116][117] The European Securities and Markets Authority (ESMA) maintains a public register of cleared classes, ensuring only standardized, liquid CDS meeting criteria like sufficient volume and low credit risk concentration qualify.[116] For non-centrally cleared CDS, post-2008 reforms imposed margin requirements under Basel Committee on Banking Supervision (BCBS) and International Organization of Securities Commissions (IOSCO) frameworks, finalized in 2013 and 2015, mandating bilateral exchange of variation margin (VM) to cover daily mark-to-market changes and initial margin (IM) to buffer potential future exposures.[118] VM posting became effective September 1, 2016, for major dealers, while IM phased in from September 2016 to September 2022 based on aggregate average notional exposure thresholds, starting at €3 trillion and descending to €8 billion, with CDS treated as non-segregated collateral subject to haircuts.[119][120] These rules apply to uncleared OTC derivatives globally for entities under G20 jurisdictions, prohibiting rehypothecation of IM beyond limited percentages and requiring gross posting without netting across parties.[118]Effects on Market Dynamics and Innovation
Post-2008 regulatory mandates, including the Dodd-Frank Wall Street Reform and Consumer Protection Act enacted on July 21, 2010, in the United States and the European Market Infrastructure Regulation (EMIR) adopted on July 4, 2012, in the European Union, imposed central clearing obligations on standardized credit default swaps (CDS), particularly index products, alongside mandatory initial and variation margin requirements for uncleared trades.[7][121] These reforms aimed to mitigate systemic risks exposed during the 2007-2009 financial crisis, such as those from uncleared CDS exposures at institutions like AIG, by shifting counterparty risk to central counterparties (CCPs) and enhancing transparency through trade reporting. Empirical evidence indicates that central clearing reduced bilateral counterparty exposures, with cleared CDS volumes rising to over 80% of index notional by 2015, fostering greater netting efficiency and collateral optimization across portfolios.[122][123] Market dynamics shifted toward improved resilience but at the cost of higher operational frictions. Variation and initial margin requirements, phased in from 2016 under rules from bodies like the Commodity Futures Trading Commission and European Securities and Markets Authority, elevated funding costs for market participants, contributing to a contraction in gross CDS notional outstanding from a peak of approximately $58 trillion in 2007 to around $8 trillion by mid-2018, though compression cycles and reduced speculative activity also played roles.[34][30] Liquidity metrics, such as bid-ask spreads, showed mixed but generally non-adverse responses; studies of voluntary clearing at platforms like ICE Clear Credit found slight liquidity enhancements post-clearing adoption, attributed to reduced informed trading fears from greater post-trade transparency, while single-name CDS spreads widened modestly by 14-19 basis points due to CCP risk premia.[124][125] However, these mandates amplified collateral demand during stress periods, potentially heightening systemic liquidity risks in interconnected CCP ecosystems, as modeled in frameworks where margin procyclicality could exacerbate fire sales.[126] Regarding innovation, regulations standardized eligible CDS contracts for clearing, prioritizing liquid index tranches over bespoke single-name deals, which narrowed the scope for customized hedging but streamlined infrastructure development, such as multilateral netting protocols that reduced gross exposures by up to 50% in compressed portfolios.[127] This shift diminished the CDS market's pre-crisis role in leading price discovery for underlying bonds, with empirical analyses post-reform showing attenuated spillovers from CDS innovations to cash bond returns, reflecting a more segmented and regulated trading environment.[66] While barriers to entry for non-standard variants like loan CDS persisted due to clearing exemptions, the safer bilateral framework arguably redirected innovation toward compliant extensions, including enhanced risk models incorporating CCP default fund contributions, though overall product diversity contracted compared to the opaque pre-crisis era.[128]Market Characteristics and Data
Evolution of Notional Volumes and Liquidity
The gross notional amount outstanding in the credit default swap (CDS) market expanded rapidly from the early 2000s, reaching a peak of approximately $61.2 trillion by the end of 2007, driven by increased demand for credit risk transfer amid low interest rates and buoyant credit markets.[34] This surge reflected a broader growth in over-the-counter (OTC) derivatives, with CDS volumes rising steadily before accelerating sharply in the lead-up to the 2007-2008 financial crisis, as institutions sought to hedge or speculate on corporate and structured credit exposures.[34] ![CDS notional outstanding compared to total nominals and debt][center] Post-crisis, gross notional amounts contracted significantly, halving to around $30 trillion by late 2010, due to widespread portfolio compression exercises that netted offsetting positions, regulatory interventions curbing speculative activity, and a flight to simpler hedging instruments.[130] By mid-2024, outstanding notional had stabilized at $9.0 trillion, a decline of about 9% from the prior period, encompassing both single-name and index CDS, with the reduction attributable to ongoing netting, maturity of legacy contracts, and higher capital requirements under post-2008 reforms like Dodd-Frank and EMIR.[131] This compression primarily affected gross measures, as net exposure (reflecting actual risk transfer) remained more stable relative to underlying credit markets.[34] Liquidity in the CDS market evolved from fragmented, dealer-dominated bilateral trading pre-crisis to a more centralized structure post-2008, with central clearing rates rising from near zero to over 70% for index CDS by the early 2020s, enhancing systemic resilience but increasing operational costs for participants.[132] Single-name CDS liquidity has trended downward since 2016, with declining trading volumes and wider bid-ask spreads for most reference entities outside major names, while index products like CDX and iTraxx captured the bulk of activity due to their standardization and lower transaction costs.[133] [64] Overall market depth improved during stress events like the COVID-19 period, as index liquidity rebounded quickly, but persistent dealer balance sheet constraints under Basel III have limited on-the-run trading for less liquid single-name contracts.[64]Sources for Real-Time Pricing and Indices
Real-time pricing for credit default swaps (CDS) is primarily sourced from data vendors that aggregate executable quotes, spreads, and liquidity metrics from major market makers and clearinghouses. S&P Global provides one of the most comprehensive CDS pricing datasets, drawing from over 4 million daily data points contributed by more than 20 market makers through official books, live quotes, and clearing submissions, covering single-name CDS, indices, tranches, options, and sector curves.[134][135] ICE Data Services offers integrated CDS pricing solutions, including real-time spreads and settlement levels for cleared instruments, delivered via APIs, SFTP, or curve viewers to support analytics and risk workflows.[136] Bloomberg terminals deliver real-time and historical CDS information, including spreads and valuations for single names and indices, enabling extraction of live market data for analysis.[8] Tradeweb facilitates access to real-time pricing, axes, and liquidity from leading dealers for single-name CDS and indices, including emerging markets, through electronic trading platforms.[137] For CDS indices, which serve as standardized benchmarks for credit risk exposure, S&P Global administers the primary families: CDX for North American and emerging market corporate credits, and iTraxx for European, Asian, and emerging market counterparts, with on-the-run series updated quarterly based on constituent selection processes.[138] ICE publishes daily settlement prices for CDX and iTraxx indices cleared through its platforms, available publicly for key tenors like 5-year, alongside full datasets for subscribers.[139] These index levels reflect composite market pricing, incorporating dealer inputs and auction outcomes to gauge sector-wide default probabilities.[138]Corporate Versus Sovereign Applications
Corporate CDS contracts primarily facilitate hedging against default risk on individual firms' debt obligations, such as bonds or loans, allowing investors to protect bond holdings or speculate on deteriorating corporate fundamentals like earnings declines or leverage increases. These instruments are integral to corporate credit portfolios, where protection buyers—often banks or asset managers—pay periodic premiums to sellers in exchange for payouts upon credit events, enabling efficient risk transfer without selling underlying bonds. Applications extend to arbitrage strategies exploiting mispricings between CDS spreads and bond yields, with corporate CDS spreads typically reflecting firm-specific metrics including balance sheet health and industry conditions.[140] Sovereign CDS, by comparison, address credit risk on government debt, hedging exposures to fiscal policy shifts, currency devaluations, or political instability rather than operational failures. These contracts are frequently used by institutional investors to manage country-level risk in fixed-income allocations, particularly for emerging market sovereigns where bond liquidity may lag. Unlike corporate applications, sovereign CDS pricing incorporates macroeconomic variables and geopolitical events, such as debt restructurings or IMF interventions, leading to heightened volatility during crises like the 2010-2012 European sovereign debt episode.[141] Market scale underscores these distinctions: in 2023, corporate single-name CDS represented 69.6% of total CDS trading activity, up from 54.5% in 2019, while sovereign CDS fell to 29.8% from 44.7%, reflecting post-crisis shifts toward diversified corporate risk amid regulatory emphasis on clearing. Sovereign notional amounts totaled approximately $1.2 trillion as of June 2022, comprising just 13% of the overall CDS market, compared to the dominant corporate segment driven by thousands of reference entities versus dozens of sovereigns.[142][143] Liquidity profiles diverge as well, with corporate CDS benefiting from broader participation and tighter bid-ask spreads due to high-volume trading in investment-grade and high-yield names, whereas sovereign CDS liquidity clusters around liquid benchmarks like Italy or Brazil but thins for smaller issuers, often exceeding underlying sovereign bond markets in tradability during stress.[144] Settlement mechanics further differentiate: corporate CDS recognize bankruptcy as a trigger, permitting physical delivery of reorganized claims, while sovereign variants omit bankruptcy—absent legal frameworks for state liquidation—and emphasize failure-to-pay or restructuring events, resolved via ISDA auctions to mitigate disputes over deliverable obligations' scarcity. This structure has historically amplified payout uncertainties in sovereign defaults, as seen in Argentina's 2001 restructuring where recovery rates varied widely.[145][141]Controversies and Broader Impacts
Assertions of Systemic Risk Amplification
Assertions that credit default swaps amplified systemic risk during the 2008 financial crisis centered on their role in concentrating uninsured exposures among a limited number of counterparties, such as insurers lacking sufficient capital buffers. Proponents of this view, including analyses from the Federal Deposit Insurance Corporation, argued that CDS enabled the packaging and resale of mortgage-related risks through collateralized debt obligations, spreading initial subprime losses into broader market disruptions via leveraged protection selling.[47] For example, American International Group (AIG) had issued CDS with a gross notional value of approximately $527 billion by mid-2008, including $441 billion on super-senior tranches of mortgage-backed securities, without commensurate reserves to cover potential payouts. When underlying defaults materialized, AIG incurred $28.6 billion in losses on these mortgage-linked CDS in 2008, triggering collateral calls it could not meet and necessitating an initial $85 billion federal bailout on September 16, 2008, to avert counterparty defaults among major banks.[146] This concentration exemplified how CDS facilitated "risk amplification" through interconnected counterparty obligations, where the failure of one large seller could propagate liquidity strains across the financial system. Scholarly assessments, such as those examining financial innovations' effects, contended that CDS allowed synthetic leverage exceeding the underlying asset base, turning localized housing market declines into global credit freezes as protection buyers demanded simultaneous settlements.[147] Global CDS notional outstanding reached about $55 trillion by mid-2008, far surpassing the size of the referenced corporate and sovereign debt markets, which critics like those in post-crisis reviews claimed obscured true leverage and encouraged moral hazard by decoupling protection from ownership.[105] AIG's exposures, held primarily by its under-regulated Financial Products unit, illustrated this dynamic: rating downgrades in September 2008 escalated margin requirements, forcing asset fire sales that pressured broader markets and required the U.S. government to ultimately disburse over $180 billion in support to stabilize interconnected institutions.[49] Further assertions highlighted CDS markets' opacity and over-the-counter structure as enablers of underestimation of tail risks, with empirical reviews post-crisis attributing amplified contagion to uncollateralized trades that turned credit events into systemic events.[148] For instance, studies on derivatives' role in crises noted that CDS permitted speculative positions unrelated to hedging, inflating notional volumes and creating feedback loops where widening spreads signaled distress but also intensified funding pressures on sellers.[74] These claims, echoed in regulatory testimonies, posited that without CDS, mortgage risks would have remained more contained within originating institutions rather than diffused into a web of bilateral contracts vulnerable to sequential failures.[105]Empirical Benefits in Risk Dispersion and Price Discovery
Credit default swaps (CDS) enable the dispersion of credit risk by permitting holders of debt instruments to transfer default exposure to specialized counterparties, such as hedge funds and insurers, thereby reducing concentration among traditional lenders like banks. Empirical evidence supports this benefit, as the introduction of CDS trading for a firm correlates with decreased overall firm risk, measured via value volatility, indicating effective offloading of credit exposure.[149] This dispersion mechanism enhances market efficiency by broadening the pool of risk bearers, with studies showing that CDS usage allows non-bank entities to absorb portions of corporate credit risk that would otherwise remain bundled with lending activities.[150] Further empirical validation comes from analyses of CDS market dynamics, where risk transfer via CDS has been linked to lower counterparty credit risk in cleared trades, achieved through multilateral netting that distributes net exposures across participants rather than bilateral concentrations.[128] Post-2008 central clearing mandates amplified this dispersion, with data from cleared single-name CDS contracts revealing reduced bilateral exposures and improved collateral efficiency, mitigating pre-crisis vulnerabilities from opaque risk holdings.[151] These findings counterbalance concerns over amplification by demonstrating how CDS facilitate granular risk allocation, evidenced by the market's role in reallocating U.S. corporate credit risk away from depository institutions toward diversified investors.[150] In terms of price discovery, CDS markets empirically lead other credit instruments in reflecting default probabilities, providing timelier signals of deteriorating creditworthiness. Norden and Weber (2004) found that CDS spreads anticipate bond spread changes and incorporate firm-specific information faster than cash bond markets, establishing CDS as the dominant forum for credit risk pricing.[152] This leading role persists in empirical comparisons, with CDS exhibiting superior information content relative to bond yields, as spreads adjust more rapidly to macroeconomic and entity-specific shocks.[153] Additional studies confirm CDS's informational efficiency, particularly for corporate and sovereign credits, where spreads predict rating downgrades and credit events ahead of equity or bond markets.[66] For instance, pre-crisis data show CDS leading bond markets in price discovery by 50-70% in information share metrics, enhancing overall market transparency and aiding investors in assessing true credit costs.[32] Even post-regulatory reforms, CDS indices maintain strong price leadership, underscoring the instrument's enduring value in aggregating dispersed market intelligence on systemic credit conditions.[66]Debates Over Naked CDS and Regulatory Interventions
Naked credit default swaps (CDS), where the buyer does not hold the underlying reference obligation, have sparked debate over their role in exacerbating market volatility and systemic risks, particularly during sovereign debt crises. Critics argue that naked CDS enable speculative "side bets" that can amplify borrowing costs and precipitate self-fulfilling prophecies of default by signaling distress and encouraging further selling pressure on bonds. For instance, in the European sovereign debt crisis around 2010, elevated CDS spreads on Greek debt were blamed for tightening funding conditions, with models suggesting that such speculation raises equilibrium interest rates and default probabilities even absent fundamental deterioration. Proponents of restrictions, including EU policymakers, contended that naked positions lack insurable interest, akin to gambling on unrelated parties' misfortunes, potentially incentivizing moral hazard where speculators profit from engineered distress.[36] Conversely, defenders maintain that naked CDS enhance market liquidity, facilitate price discovery, and allow efficient risk dispersion without net exposure creation, as every CDS position has a counterparty. Empirical analyses indicate that CDS markets often lead bond markets in incorporating credit information, providing early warnings of underlying solvency issues rather than fabricating them; for example, pre-crisis CDS spreads on subprime-related entities anticipated defaults ahead of cash markets. Banning naked trades, they argue, distorts incentives, reduces hedging opportunities for diversified portfolios, and may impair overall market depth, with theoretical models showing that such prohibitions lower bond prices and liquidity by curtailing speculative entry that stabilizes dealer intermediation. Studies post-EU interventions found no significant reduction in sovereign yields from bans, but evidence of diminished CDS-bond price linkages, suggesting curtailed informational efficiency.[32][154][155] Regulatory responses crystallized in the EU's Short Selling Regulation (EU No 236/2012), effective November 1, 2012, which imposed a permanent ban on uncovered CDS referencing EU sovereign debt for EU-domiciled entities, aiming to curb perceived attacks on member states amid the eurozone turmoil. The rule prohibits purchasing sovereign CDS without equivalent bond holdings (or hedged exposures), with exemptions for market-making and limited hedging, but allows suspensions if stability threats arise; non-EU firms trading EU sovereign CDS remain unbound if not targeting EU counterparties. In contrast, the US under Dodd-Frank Act (2010) mandated central clearing and margining for standardized CDS but preserved naked trading, prioritizing transparency over outright restrictions, as regulators like the SEC viewed bans as ineffective against global speculation. Post-ban evaluations in Europe revealed mixed outcomes: while intended to shield borrowing costs, the policy correlated with thinner sovereign CDS liquidity and slower price adjustments to news, without empirically verifiable drops in bond spreads attributable to the restriction.[156][157][158]Specialized Variants
Loan Credit Default Swaps (LCDS)
Loan credit default swaps (LCDS) are credit derivatives designed to hedge or speculate on the credit risk of syndicated secured loans, rather than bonds or other unsecured debt instruments. In an LCDS contract, the protection buyer makes periodic premium payments to the protection seller in exchange for compensation upon a credit event, such as a default, bankruptcy, or restructuring of the underlying loan borrower.[159] These instruments emerged in the mid-2000s to address the growing syndicated loan market, particularly in leveraged finance, enabling loan originators and investors to transfer default risk without selling the underlying loans.[160] Mechanically, LCDS function similarly to standard credit default swaps (CDS) but with key adaptations for loan characteristics. The reference obligation is a specific syndicated secured loan, and deliverable obligations upon settlement are restricted to similar syndicated secured loans meeting predefined criteria, such as being governed by U.S. or English law and held by non-affiliated third parties.[161] Credit events trigger settlement, often via physical delivery of the distressed loan in exchange for par value, though cash settlement through auctions is also available under ISDA's LCDS Auction Rules established in 2007. Premiums, or spreads, reflect the loan's secured status, typically pricing lower than equivalent CDS due to anticipated higher recovery rates—often modeled at 70-80% versus 40% for senior unsecured bonds—stemming from collateral enforcement priorities.[160] Unlike standard CDS, which reference corporate bonds or broader obligations and allow delivery of various debt types, LCDS emphasize loan-specific features like covenants, amortization schedules, and seniority in the capital structure, reducing basis risk for loan holders.[162] Contracts are standardized under the International Swaps and Derivatives Association (ISDA) framework, including the 2007 LCDS Protocol, which amended documentation to align with syndicated loan conventions such as fixed-rate coupons and par pricing at issuance.[163] This protocol facilitated market adoption by resolving mismatches in timing and terms between loans and traditional CDS. LCDS gained traction post-2006 amid surging leveraged loan volumes, peaking during the pre-2008 credit boom, with indices like the LCDX—comprising 100 equally weighted single-name LCDS—providing benchmarks for trading and hedging baskets of loans. Usage has since stabilized in institutional markets, primarily among banks, hedge funds, and loan mutual funds for risk management in the $1.2 trillion global syndicated loan sector as of 2023, though liquidity remains thinner than bond CDS due to the bilateral nature of loans and regulatory scrutiny on derivatives post-financial crisis.[164] Empirical data indicate LCDS spreads correlate closely with loan pricing but diverge during stress, underscoring their role in isolated credit risk transfer without broader systemic bond market spillovers.[165]Sovereign Debt-Specific Adaptations
Credit events in sovereign CDS contracts, governed by ISDA definitions, exclude bankruptcy—applicable only to corporate entities—and instead encompass failure to pay, obligation default or acceleration, restructuring, and repudiation or moratorium.[166][167] Restructuring for sovereigns typically follows the 1999 ISDA clause without maturity limits on deliverable obligations, unlike the modified restructuring in corporate CDS that caps lookback periods and maturity mismatches to prevent gaming.[144] This broader restructuring definition accommodates sovereign debt workouts, which often involve negotiated haircuts or collective action clauses, as seen in Greece's 2012 private sector involvement where ISDA confirmed a credit event only after retroactive CACs reduced bond principal by over 50%.[168] Settlement procedures for sovereign CDS mirror corporate protocols post-2009 Big Bang reforms, favoring cash settlement via dealer-led auctions to determine final price and recovery rates, though physical delivery of eligible bonds remains an option.[144] Sovereign auctions, administered by ISDA and firms like Markit and Creditex, have settled events such as Argentina's 2001 default and Uruguay's 2003 moratorium, yielding recovery rates of 30-40% based on bid-ask spreads in deliverable sovereign bonds.[141] Unlike corporates, where physical settlement historically dominated (73% in 2005), sovereign CDS shifted to cash for European names by 2012 to mitigate delivery disputes amid fragmented bond markets.[144] Deliverable obligations in sovereign CDS are non-subordinated claims for borrowed money, typically pari passu with the reference debt, denominated in major currencies like USD (61% of contracts), EUR, or JPY, without the subordination filters common in corporate deals.[144][168] This allows delivery of a wider basket of government bonds, often external sovereign issuances, enhancing liquidity but exposing payouts to currency devaluation risks absent in domestic corporate references. Sovereign contracts also standardize lower coupons (25 or 100 basis points) compared to corporate variability, reflecting thinner liquidity and higher speculative volumes from hedge funds (83% dealer-driven in H2 2011).[144]Fiscal and Legal Considerations
Taxation of Premiums and Payouts
In the United States, credit default swaps (CDS) are generally classified as notional principal contracts (NPCs) under Treasury Regulation §1.446-3 for federal income tax purposes, encompassing both cash-settled and physically settled variants. This treatment aligns CDS with other swaps, subjecting periodic premium payments to accrual-based recognition rather than insurance or option characterizations, despite early uncertainties noted in IRS Notice 2004-52.[169] Premiums paid by the protection buyer are deductible as ordinary expenses, typically accrued ratably over the contract term on an accrual-method basis, qualifying as business expenses if used for trade or business hedging or as investment expenses otherwise. For the protection seller, received premiums constitute ordinary income, similarly accrued and included in gross income periodically. Upon a credit event triggering settlement, payouts under cash-settled CDS are treated as termination payments under NPC rules, resulting in ordinary income to the protection buyer and an ordinary deduction (or loss) for the protection seller in the year the payment is determined. This characterization applies regardless of whether the CDS hedges an actual position, potentially creating mismatches with capital losses on underlying reference obligations.[77] Physically settled CDS, where the buyer delivers defaulted obligations in exchange for par value, may involve sale-or-exchange treatment for the delivered assets, yielding capital gain or loss to the buyer based on the difference between the obligations' basis and par recovery, while the seller acquires the obligations with a basis equal to the par payment made. However, proposed regulations extend NPC treatment to physical settlement elements, prioritizing ordinary treatment for the swap legs to avoid hybrid outcomes. Cross-border CDS premiums paid by U.S. persons to non-U.S. sellers generally escape withholding tax under portfolio interest exceptions or as non-FDAP income, per guidance in proposed regulations, though insurance excise taxes have been considered but not imposed on premiums.[170] In other jurisdictions, such as the United Kingdom, premiums are typically taxed as trading income for dealers or investment income for investors, with payouts as capital or revenue receipts depending on hedging status, while EU member states often apply derivative rules under local tax codes without uniform withholding on premiums.[77] These treatments reflect CDS as financial contracts rather than insurance, avoiding risk transfer doctrines due to permissible "naked" positions without insurable interest.[169]Accounting Standards for On- and Off-Balance-Sheet Treatment
Under US GAAP, credit default swaps (CDS) are classified as derivatives under ASC 815 and must be recognized on the balance sheet at fair value upon inception and subsequently remeasured, with changes in fair value recorded in earnings unless the instrument qualifies for hedge accounting.[171] This on-balance-sheet treatment, introduced by FAS 133 in 1998 and effective for fiscal years beginning after June 15, 2000, replaced prior practices where many derivatives, including early CDS, were often kept off-balance-sheet to avoid immediate recognition of potential losses.[172] For CDS not designated as hedges, the full mark-to-market volatility flows through the income statement, potentially amplifying reported earnings volatility during credit stress events.[173] Under IFRS, CDS fall within the scope of IFRS 9 (effective January 1, 2018, superseding IAS 39), requiring measurement at fair value through profit or loss (FVTPL) for those held for trading or not qualifying for other categories, with the derivative asset or liability recorded on the balance sheet.[174] Similar to US GAAP, historical treatment under pre-IAS 39 rules allowed off-balance-sheet accounting for certain swaps, contributing to underreported leverage in the 1990s and early 2000s; IAS 39's 2005 adoption mandated fair value recognition for most derivatives, aligning with post-Enron reforms.[175] Hedge accounting under IFRS 9 permits deferral of fair value changes to other comprehensive income if the CDS effectively hedges credit risk exposure, though strict documentation and effectiveness testing are required, and credit risk hedges remain challenging due to basis mismatches between hedged items (often at amortized cost) and the CDS (at FVTPL).[176] Notional amounts of CDS contracts, representing the underlying credit exposure, are not recorded on the balance sheet under either framework but are disclosed in footnotes as contingent off-balance-sheet items to inform users of potential future obligations or receivables upon credit events.[177] This disclosure practice persists from earlier regulatory guidance, such as 1996 OCC bulletins treating CDS as off-balance-sheet for risk assessment, though full fair value accounting now ensures the economic substance of the derivative is reflected on-balance-sheet.[178] Differences between US GAAP and IFRS arise in offsetting: US GAAP permits netting of derivative assets and liabilities with the same counterparty if master netting agreements exist and intent to settle net is documented, while IFRS requires settlement intent in addition to legal right of offset, often resulting in grosser balance sheet presentation under IFRS. These standards enhance transparency but have been critiqued for procyclical effects, as mark-to-market losses during market downturns can force deleveraging, as observed in CDS positions amid the 2008 crisis.[179]References
- ./assets/Credit_default_swaps_vs_total_nominals_plus_debt.png