

Community hub
Recent from talks
Contribute something
Nothing was collected or created yet.
Dashboard
View on Wikipedia
A dashboard (also called dash, instrument panel or IP, or fascia) is a control panel set within the central console of a vehicle, boat, or cockpit of an aircraft or spacecraft. Usually located directly ahead of the driver (or pilot), it displays instrumentation and controls for the vehicle's operation.[1][2] An electronic equivalent may be called an electronic instrument cluster, digital instrument panel, digital dash, digital speedometer or digital instrument cluster. By analogy, a succinct display of various types of related visual data in one place is also called a dashboard.[3]
Etymology
[edit].png)
Originally, the word dashboard applied to a barrier of wood or leather fixed at the front of a horse-drawn carriage or sleigh to protect the driver from mud or other debris "dashed up" (thrown up) by the horses' hooves.[1] The first known use of the term (hyphenated as dash-board, and applied to sleighs) dates from 1847.[2] Commonly these boards did not perform any additional function other than providing a convenient handhold for ascending into the driver's seat, or a small clip with which to secure the reins when not in use.
When the first "horseless carriages" were constructed in the late 19th century, with engines mounted beneath the driver such as the Daimler Stahlradwagen, the simple dashboard was retained to protect occupants from debris thrown up by the cars' front wheels. However, as car design evolved to position the motor in front of the driver, the dashboard became a panel that protected vehicle occupants from the heat and oil of the engine. With gradually increasing mechanical complexity, this panel formed a convenient location for the placement of gauges and minor controls, and from this evolved the modern instrument panel, although retaining its archaic common name.
The first mass-produced automobile, the Oldsmobile Curved Dash, got its name from its dashboard, which was curved like that of a sleigh.[4]
Dashboard features
[edit]
Where the dashboard originally included an array of simple controls (e.g., the steering wheel) and instrumentation to show speed, fuel level and oil pressure, the modern dashboard may accommodate a broad array of gauges, and controls as well as information, climate control and entertainment systems. Although a clock is typically embedded within the entertainment system, some cars have a separate dashboard clock.
Contemporary dashboards may include the speedometer, tachometer, odometer, engine coolant temperature gauge, and fuel gauge, turn indicators, gearshift position indicator, seat belt warning light, parking-brake warning light,[5] and engine-malfunction lights. Heavy vehicles that feature air brakes, such as trucks and buses will also have gauges to indicate the available air pressure in the braking system. Other features may include a gauge for alternator voltage, indicators for low fuel, low oil pressure, low tire pressure and faults in the airbag (SRS) systems, glove compartment, ashtray and a cigarette lighter or power outlet – as well as heating and ventilation systems, lighting controls, safety systems, entertainment equipment and information systems, e.g., navigation systems.
Padding and safety
[edit]In 1937, Chrysler, Dodge, DeSoto, and Plymouth cars came with a safety dashboard that was flat, raised above knee height, and had all the controls mounted flush.[6]
Padded dashboards were advocated in the 1930s by car safety pioneer Claire L. Straith.[7] In 1948, the Tucker 48 became the first car with a padded dashboard.[8]
One of the safety enhancements of the 1970s was the widespread adoption of padded dashboards. The padding is commonly polyurethane foam, while the surface is commonly either polyvinyl chloride (PVC) or leather in the case of luxury models.
In the early and mid-1990s, airbags became a standard feature of steering wheels and dashboards.
Fashion in instrumentation
[edit]

In the 1940s through the 1960s, American car manufacturers and their imitators designed aesthetically shaped instruments on a dashboard accented with chrome and transparent plastic, which could be less readable, but was often thought to be more stylish. Sunlight could cause a bright glare on the chrome, particularly for a convertible. On North American vehicles in particular, this trend lingered on until the late-1980s, which still featured dashboards with wood and fake chrome embellishment along with square instruments – long after European and Japanese manufacturers had long embraced a plainer, more functional and austere approach for dashboard and instrument panel design.
With the advent of the VFD, LED and LCD in consumer electronics, some manufacturers used instruments with digital readouts to make their cars appear more up to date. Some cars use a head-up display to project the speed of the car onto the windscreen in imitation of fighter aircraft, but in a far less complex display.
In recent years, spurred on by the growing aftermarket use of dash kits, many automakers have taken the initiative to add more stylistic elements to their dashboards. One prominent example of this is the Chevrolet Sonic which offers both exterior (e.g., a custom graphics package) and interior cosmetic upgrades.[9] In addition to OEM dashboard trim and upgrades a number of companies offer domed polyurethane or vinyl applique dash trim accent kits or "dash kits".
Manufacturers such as BMW, Honda, Toyota and Mercedes-Benz have included fuel-economy gauges in some instrument clusters, showing fuel mileage in real time, which was limited mainly to luxury vehicles and later, hybrids. Following a focus on increasing fuel economy in the late 2000s along with increased technology, most vehicles in the 2010s now come with either real-time or average mileage readouts on their dashboards. The ammeter was the gauge of choice for monitoring the state of the charging system until the 1970s. Later it was replaced by the voltmeter. Today most family vehicles have warning lights instead of voltmeters or oil pressure gauges in their dashboard instrument clusters, though sports cars often have proper gauges for performance purposes and driver appeasement along with larger trucks, mainly to monitor system function during heavy usage such as towing or off-road usage.
Electronic instrument cluster
[edit].jpg)
.jpg)


In an automobile, an electronic instrument cluster, digital instrument panel or digital dash for short, is a set of instrumentation, including the speedometer, that is displayed with a digital readout rather than with the traditional analog gauges. Many refer to it either simply as a digital speedometer or a digital instrument cluster.
History
[edit]
The first application of an electronic instrument cluster, in a production automobile, was in the 1976 Aston Martin Lagonda. The first American manufacturer application was the 1978 Cadillac Seville with available Cadillac Trip Computer. In the United States they were an option in many motor vehicles manufactured in the 1980s and 1990s, and were standard on some luxury vehicles at times, including some models made by Cadillac, Chrysler and Lincoln. They included not only a speedometer with a digital readout, but also a trip computer that displayed factors like the outdoor temperature, travel direction, fuel economy and distance to empty (DTE). In 1983, the Renault 11 Electronic was the first European hatchback to have a digital dashboard.[10] Many vehicles made today have an analog speedometer paired with the latter in digital form. In the late 1980s into the early 1990s, General Motors had touch-screen CRTs with features such as date books and hands-free cell phone integration built into cars such as the Oldsmobile Toronado, Buick Riviera and Buick Reatta.
Advantages and drawbacks
[edit]When accelerating, digital speedometers generally step through a freeze frame of whole numbers at a constant sample rate. It is as precise as the number displaced, whereas a gauged speedometer pointer could sweep through an infinite range between its major markings at 10 mph or 20 km/h intervals. The latter provides a sense of continuous acceleration albeit with less precision: a gauge reading could only be estimated to the pointer's nearest halfway point between the markings.[11][12][13]
The first digital instrument clusters were considered to be unpopular during the years when they were widely produced, and were heavily criticized by reviewers in automotive magazines. Some of the criticism they received was as follows:
- They were hard to see in the strong sunlight or other bright light
- They took away the sense of continuous acceleration that is provided by an analog speedometer.[14]
- They were expensive to repair in the event of a malfunction
As a result of these issues, digital instrument panels were phased out of vehicles throughout the 1990s, and have been replaced with traditional analog gauges in most vehicles (with notable exceptions from French manufacturers Renault and Citroën), including those from luxury divisions. However, many vehicles are made today with a standard or optional trip computer located independently from the speedometer.
Digital units received information from a variety of sensors installed throughout the engine and transmission, while traditional analog units were attached to a cable that provided information from the transmission. Modern analog displays receive information in the same manner as the digital units, with very few manufacturers still using the speedometer cable method.
This section possibly contains original research. (April 2017) |


In the 2000s, digital speedometers were produced in some hybrid vehicles, including the Toyota Prius and Honda Insight.[15]
Most digital speedometers have had green numbers displayed on a dark green or black background. The 8th and 9th generation Honda Civic have a "two-tier" instrument panel. The upper digital dashboard with white numbers against a blue screen (the latter of which changes to green according to driving habits), digital fuel and temperature gauges. The lower dashboard has an analog tachometer and digital odometer. The 10th and present generation saw the two-tier design replaced with a single instrument panel, which in higher tiers is a fully digital and partially customizable design.[16]
Since the mid-2010s and early 2020s, fully customizable digital instrument clusters have become popular. The modern implementation allows the driver to choose which information to project where and how in the instrument cluster, such as navigation aid, connected phone information and blind spot camera view.[17][18] The customization can also reduce distraction for the driver and allow the manufacturer to use the same hardware in different models while retaining differentiation between models.[19]
Automotive head-up displays have seen applications in several cars, augmenting analog gauges with a digital readout on the windshield glass.
LCDs
[edit]Vehicle instruments have been augmented by software-powered display panels conveying information on display panels. Digital instruments present data in the form of numeric parameters, textual messages, or graphical gauges. Unlike the electro-mechanical instrument clusters of the past, these interactive displays are much more versatile and flexible.
Many modern motorcycles are now equipped with digital speedometers, most often these are sports bikes.
Toyota is using electronic instruments for showing the cars parameters for its Yaris/Vitz model, the car employs a vacuum fluorescent display to indicate the speed, RPM, fuel level, odometer, etc.
For the 2011 model year, Chrysler began using a common dashboard across their model line that has an integrated trip computer in addition to the analog gauges. This trip computer can also be used to show a digital speedometer, making these hybrid digital-analog dashboards. the speedometer needle to be too wide, they are relying on the digital speedometer more than the analog gauge.
The French manufacturer Citroën, is using digital indicators as speedometer for many models in its range, including the C2, C3, C4 and C6.
- High resolution displays
The 2007 Lamborghini Reventon introduced one of the first high resolution LCD displays used on a production vehicle.[20] A trend setter that would be taken seriously by mainstream manufacturers on years to come and become a selling point of consideration during the next following decade.
The 2009 Lexus LFA was one of the first cars to use a modern LCD screen. Lexus claimed a digital speedometer was required since an analogue tachometer wouldn't be able to keep up with the rev changes of the car's engine.[21] This statement however was mainly marketing-driven; there is no technical reason why an analog needle would not keep up with the (far heavier) engine itself.[original research?]
The third generation Range Rover (L322) also introduced the first use and largest TFT LCD displays used on a production luxury SUV for the facelifted 2010, and end of the cycle model.[22][23] A trend setter that would follow further adaptation from other manufacturers.
In 2014, Audi launched[24] its 'virtual cockpit' on Audi TT, and has later introduced it to several other models. The technology has been developed[25] together with the Finnish company Rightware, using its Kanzi software suite.
Railway applications
[edit]Electronic instrument clusters are being increasingly common features on railway vehicles, in which individual instruments are replaced by various forms of digital readouts. Early uses of instrument clusters often employed LEDs to display analog-type or numeric readings for pressure gauges, electrical gauges, and other displays. They have been increasingly integrated with various cab signalling systems and together with the installation of multi-function displays, have simplified the cab layout and improved user interaction with the engineer.[26]
-
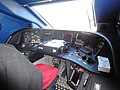 France: Full view of the cab controls in an SNCF TGV Duplex set.
 -
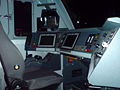
 Germany: Various electronic displays in the cab of a DB Class 407 for ICE high-speed lines.
 -
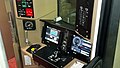
 Japan: Digital instrument cluster in the cockpit of a JR East E531 series.
 -
 Russia: Engineer at the controls of a Lastochka train from the Siemens Desiro family.
 -
 Switzerland: Interior of an IC 2000 for the Swiss Federal Railways.
 -
 United Kingdom: Mockup of the British Rail Class 700 cab for Thameslink.
 -
 United States: Control stand in an M8 railcar operated by Metro-North.
 -


See also
[edit]- Air core gauge
- Binnacle
- Car audio
- Carputer
- Control panel
- Control stand
- Dashcam
- Data and information visualization
- Flight instruments
- Glass cockpit
- GM Instrument Cluster Settlement
- Head unit
- Head-up display
- In car entertainment
- List of auto parts
- Saab Information Display
- Telematics
- Vehicular communication systems
References
[edit]- ^ a b "Dictionary entry for dashboard". Merriam–Webster. Archived from the original on 2007-09-29. Retrieved 2006-10-11.
- ^ a b "dashboard". Oxford English Dictionary (Online ed.). Oxford University Press. (Subscription or participating institution membership required.); citing Annual Report of the Commissioner of Patents, 1846, 81, in United States Congressional Serial Set (29th Congress, 2nd Session: House of Representatives Executive Document 52), III.
- ^ "What is a dashboard? A complete overview". tableau.com. Salesforce, Inc. 2024. Archived from the original on 2024-03-30. Retrieved 10 July 2024.
- ^ Soule, Gardner (December 1951). Torrey, Volta (ed.). "From Coast to Coast in an Old Old Olds". Popular Science. Vol. 159, no. 6. New York: Popular Science Publishing. pp. 129–132, 258. Article on a 1904 Olds making a coast to coast trip with detailed photo of subject on p. 130.
- ^ "Signal to Warn Driver That the Emergency Brake Is Engaged", Popular Science, February 1919, page 86 (unlabeled), via Google Books.
- ^ "Ever Gave Such Safety". Archived from the original on 2014-03-09. Retrieved 2012-02-04.
- ^ "History of Straith Clinic in Birmingham, Dearborn, and West Bloomfield MI". straithclinic.com. Archived from the original on 25 February 2009. Retrieved 4 May 2018.
- ^ "Step into the New Automotive Age in the Rear Engine Tucker". Archived from the original on 2010-12-04. Retrieved 2012-05-27.
- ^ "Chevrolet Accessories". www.chevrolet.com. Archived from the original on 21 February 2017. Retrieved 4 May 2018.
- ^ "Fiat Tipo". carsfromitaly.net. Retrieved 2009-12-25.
- ^ Whitman, William C.; Johnson, William M.; Tomczyk, John (October 2004). Refrigeration & air conditioning ... – Google Books. Thomson Delmar Learning. ISBN 1401837654. Retrieved 2009-12-08.
- ^ Pohlmann, Ken C. (January 1989). The compact disc handbook – Google Books. A-R Editions. ISBN 9780895792280. Retrieved 2009-12-08.
- ^ Popular Science. Bonnier Corporation. March 1931. p. 96. Retrieved 2009-12-08 – via Internet Archive.
digital speedometer.
- ^ Capehart, Barney L. (2004). Information technology for energy ... – Google Books. Fairmont Press. ISBN 9780881734508. Retrieved 2009-12-08.
- ^ "3rd Generation Toyota Prius – 2010 Pictures and Photo Gallery". Toyota.com. Archived from the original on 2008-08-29. Retrieved 2009-12-08.
- ^ Hellwig, Ed (March 9, 2016). "2016 Honda Civic: Unique Gauge Cluster Works Well". Edmunds. Retrieved April 24, 2017.
- ^ "Audi Virtual Cockpit: What is It and do You Want It?". 13 February 2018.
- ^ "Hyundai's Blindspot View Monitor: Does it work?".
- ^ "Clemson Vehicular Electronics Laboratory: Instrument Clusters".
- ^ Campbell, Bryan (2019-10-24). "15 of the Greatest Automotive Instrument Clusters of All Time". Gear Patrol. Retrieved 2022-10-13.
- ^ "15 of the Greatest Automotive Instrument Clusters of All Time". 24 October 2019.
- ^ "2010 Range Rover Gets World's Largest TFT Display". Jalopnik. 2009-04-08. Retrieved 2022-10-13.
- ^ "An idiosyncratic review of the 2011 Range Rover Autobiography – Intro & Part 1: TFT-LCD Instrument Cluster #rangerover". OVALNEWS.com – Always fanatical; Occasionally interesting Land Rover & Range Rover News. 2011-02-25. Retrieved 2022-10-13.
- ^ Gibbs, Samuel (29 March 2014). "Audi builds hi-tech 'virtual cockpit' into the new TT". The Guardian. Retrieved 22 December 2015.
- ^ Singh, Sarbjeet (14 October 2015). "Audi pushing more virtual cockpit clusters with Rightware for next-generation A3, A4, Q7, others". IHS Technology. Retrieved 22 December 2015.
- ^ Federal Railroad Administration (July 2005). "Information in Cab Displays for High-Speed Locomotives". U.S. Department of Transportation. Archived from the original (PDF) on March 20, 2017. Retrieved March 18, 2017.
External links
[edit] Media related to Dashboards at Wikimedia Commons
 The dictionary definition of dash at Wiktionary
Car interior | |
|---|---|
Part of a series of articles on cars | |
| Instruments | |
| Controls | |
| Anti-theft | |
| Other elements | |
| Convenience | |
Dashboard
View on Grokipedia- Automobile instrument panel: Displays speed, fuel level, engine temperature, and warning lights, enabling drivers to monitor vehicle status in real time while focused on driving.
- Airplane cockpit: Provides pilots with gauges and displays for altitude, airspeed, fuel, and system status to support immediate situational awareness and control.
- Fitness tracker or smartwatch: Shows metrics such as steps taken, heart rate, calories burned, and activity summaries in simple visual formats for quick health monitoring.
- Home thermostat: Indicates current temperature, setpoint, and often energy usage in an easy-to-read display for rapid adjustments.
- Sports scoreboard: Presents live scores, time remaining, player statistics, and other game data for spectators to follow developments instantly.