Hubbry Logo
Heat indexHeat indexMain
Open search
Heat index
Community hub
Heat index
logo
8 pages, 0 posts
0 subscribers
Be the first to start a discussion here.
Heat index
Heat index
from Wikipedia

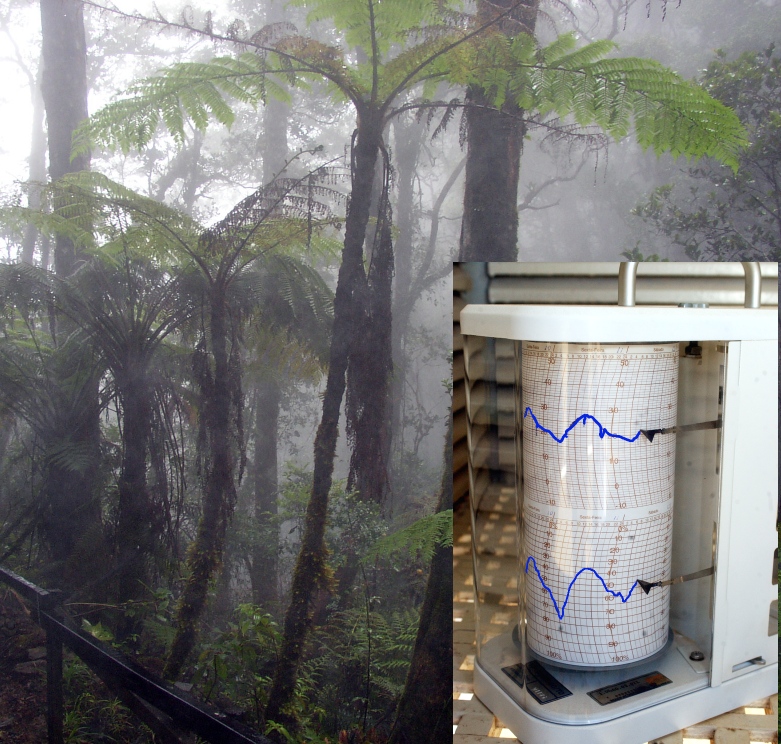
The heat index (HI) is an index that combines air temperature and relative humidity, in shaded areas, to posit a human-perceived equivalent temperature, as how hot it would feel if the humidity were some other value in the shade. For example, when the temperature is 32 °C (90 °F) with 70% relative humidity, the heat index is 41 °C (106 °F) (see table below). The heat index is meant to describe experienced temperatures in the shade, but it does not take into account heating from direct sunlight, physical activity or cooling from wind.

The human body normally cools itself by evaporation of sweat. High relative humidity reduces evaporation and cooling, increasing discomfort and potential heat stress. Different individuals perceive heat differently due to body shape, metabolism, level of hydration, pregnancy, or other physical conditions. Measurement of perceived temperature has been based on reports of how hot subjects feel under controlled conditions of temperature and humidity. Besides the heat index, other measures of apparent temperature include the Canadian humidex, the wet-bulb globe temperature, "relative outdoor temperature", and the proprietary "RealFeel".

History

[edit]

The heat index was developed in 1979 by Robert G. Steadman.[1][2] Like the wind chill index, the heat index contains assumptions about the human body mass and height, clothing, amount of physical activity, individual heat tolerance, sunlight and ultraviolet radiation exposure, and the wind speed. Significant deviations from these will result in heat index values which do not accurately reflect the perceived temperature.[3]

In Canada, the similar humidex (a Canadian innovation introduced in 1965)[4] is used in place of the heat index. While both the humidex and the heat index are calculated using dew point, the humidex uses a dew point of 7 °C (45 °F) as a base, whereas the heat index uses a dew point base of 14 °C (57 °F).[further explanation needed] Further, the heat index uses heat balance equations which account for many variables other than vapor pressure, which is used exclusively in the humidex calculation. A joint committee[who?] formed by the United States and Canada to resolve differences has since been disbanded.[citation needed]

Definition

[edit]
A generalized view of the heat index showing how the perception of heat by the human body increases with temperature but more rapidly at higher humidity levels.

The heat index of a given combination of (dry-bulb) temperature and humidity is defined as the dry-bulb temperature which would feel the same if the water vapor pressure were 1.6 kPa. Quoting Steadman, "Thus, for instance, an apparent temperature of 24 °C (75 °F) refers to the same level of sultriness, and the same clothing requirements, as a dry-bulb temperature of 24 °C (75 °F) with a vapor pressure of 1.6 kPa."[1]

This vapor pressure corresponds for example to an air temperature of 29 °C (84 °F) and relative humidity of 40% in the sea-level psychrometric chart, and in Steadman's table at 40% RH the apparent temperature is equal to the true temperature between 26–31 °C (79–88 °F). At standard atmospheric pressure (101.325 kPa), this baseline also corresponds to a dew point of 14 °C (57 °F) and a mixing ratio of 0.01 (10 g of water vapor per kilogram of dry air).[1]

A given value of relative humidity causes larger increases in the heat index at higher temperatures. For example, at approximately 27 °C (81 °F), the heat index will agree with the actual temperature if the relative humidity is 45%, but at 43 °C (109 °F), any relative-humidity reading above 18% will make the heat index higher than 43 °C.[5]

It has been suggested that the equation described is valid only if the temperature is 27 °C (81 °F) or more.[6] The relative humidity threshold, below which a heat index calculation will return a number equal to or lower than the air temperature (a lower heat index is generally considered invalid), varies with temperature and is not linear. The threshold is commonly set at an arbitrary 40%.[5]

The heat index and its counterpart the humidex both take into account only two variables, shade temperature and atmospheric moisture (humidity), thus providing only a limited estimate of thermal comfort. Additional factors such as wind, sunshine and individual clothing choices also affect perceived temperature; these factors are parameterized as constants in the heat index formula. Wind, for example, is assumed to be 5 knots (9.3 km/h).[5] Wind passing over wet or sweaty skin causes evaporation and a wind chill effect that the heat index does not measure. The other major factor is sunshine; standing in direct sunlight can add up to 15 °F (8.3 °C) to the apparent heat compared to shade.[7] There have been attempts to create a universal apparent temperature, such as the wet-bulb globe temperature, "relative outdoor temperature", "feels like", or the proprietary "RealFeel".

Meteorological considerations

[edit]

Outdoors in open conditions, as the relative humidity increases, first haze and ultimately a thicker cloud cover develops, reducing the amount of direct sunlight reaching the surface. Thus, there is an inverse relationship between maximum potential temperature and maximum potential relative humidity. Because of this factor, it was once believed that the highest heat index reading actually attainable anywhere on Earth was approximately 71 °C (160 °F). However, in Dhahran, Saudi Arabia on July 8, 2003, the dew point was 35 °C (95 °F) while the temperature was 42 °C (108 °F), resulting in a heat index of 81 °C (178 °F).[8] On August 28, 2024, a weather station in southern Iran recorded a heat index of 82.2 °C (180.0 °F), which will be a new record if confirmed.[9]

The human body requires evaporative cooling to prevent overheating. Wet-bulb temperature and Wet-bulb globe temperature are used to determine the ability of a body to eliminate excess heat. A sustained wet-bulb temperature of about 35 °C (95 °F) can be fatal to healthy people; at this temperature our bodies switch from shedding heat to the environment, to gaining heat from it.[10] Thus a wet bulb temperature of 35 °C (95 °F) is the threshold beyond which the body is no longer able to adequately cool itself.[11]

Table of values

[edit]

The table below is from the U.S. National Oceanic and Atmospheric Administration. The columns begin at 80 °F (27 °C), but there is also a heat index effect at 79 °F (26 °C) and similar temperatures when there is high humidity.

NOAA national weather service: heat index
Tempera­ture
Relative humidity
80 °F (27 °C) 82 °F (28 °C) 84 °F (29 °C) 86 °F (30 °C) 88 °F (31 °C) 90 °F (32 °C) 92 °F (33 °C) 94 °F (34 °C) 96 °F (36 °C) 98 °F (37 °C) 100 °F (38 °C) 102 °F (39 °C) 104 °F (40 °C) 106 °F (41 °C) 108 °F (42 °C) 110 °F (43 °C)
40% 80 °F (27 °C) 81 °F (27 °C) 83 °F (28 °C) 85 °F (29 °C) 88 °F (31 °C) 91 °F (33 °C) 94 °F (34 °C) 97 °F (36 °C) 101 °F (38 °C) 105 °F (41 °C) 109 °F (43 °C) 114 °F (46 °C) 119 °F (48 °C) 124 °F (51 °C) 130 °F (54 °C) 136 °F (58 °C)
45% 80 °F (27 °C) 82 °F (28 °C) 84 °F (29 °C) 87 °F (31 °C) 89 °F (32 °C) 93 °F (34 °C) 96 °F (36 °C) 100 °F (38 °C) 104 °F (40 °C) 109 °F (43 °C) 114 °F (46 °C) 119 °F (48 °C) 124 °F (51 °C) 130 °F (54 °C) 137 °F (58 °C)
50% 81 °F (27 °C) 83 °F (28 °C) 85 °F (29 °C) 88 °F (31 °C) 91 °F (33 °C) 95 °F (35 °C) 99 °F (37 °C) 103 °F (39 °C) 108 °F (42 °C) 113 °F (45 °C) 118 °F (48 °C) 124 °F (51 °C) 131 °F (55 °C) 137 °F (58 °C)
55% 81 °F (27 °C) 84 °F (29 °C) 86 °F (30 °C) 89 °F (32 °C) 93 °F (34 °C) 97 °F (36 °C) 101 °F (38 °C) 106 °F (41 °C) 112 °F (44 °C) 117 °F (47 °C) 124 °F (51 °C) 130 °F (54 °C) 137 °F (58 °C)
60% 82 °F (28 °C) 84 °F (29 °C) 88 °F (31 °C) 91 °F (33 °C) 95 °F (35 °C) 100 °F (38 °C) 105 °F (41 °C) 110 °F (43 °C) 116 °F (47 °C) 123 °F (51 °C) 129 °F (54 °C) 137 °F (58 °C)
65% 82 °F (28 °C) 85 °F (29 °C) 89 °F (32 °C) 93 °F (34 °C) 98 °F (37 °C) 103 °F (39 °C) 108 °F (42 °C) 114 °F (46 °C) 121 °F (49 °C) 128 °F (53 °C) 136 °F (58 °C)
70% 83 °F (28 °C) 86 °F (30 °C) 90 °F (32 °C) 95 °F (35 °C) 100 °F (38 °C) 105 °F (41 °C) 112 °F (44 °C) 119 °F (48 °C) 126 °F (52 °C) 134 °F (57 °C)
75% 84 °F (29 °C) 88 °F (31 °C) 92 °F (33 °C) 97 °F (36 °C) 103 °F (39 °C) 109 °F (43 °C) 116 °F (47 °C) 124 °F (51 °C) 132 °F (56 °C)
80% 84 °F (29 °C) 89 °F (32 °C) 94 °F (34 °C) 100 °F (38 °C) 106 °F (41 °C) 113 °F (45 °C) 121 °F (49 °C) 129 °F (54 °C)
85% 85 °F (29 °C) 90 °F (32 °C) 96 °F (36 °C) 102 °F (39 °C) 110 °F (43 °C) 117 °F (47 °C) 126 °F (52 °C) 135 °F (57 °C)
90% 86 °F (30 °C) 91 °F (33 °C) 98 °F (37 °C) 105 °F (41 °C) 113 °F (45 °C) 122 °F (50 °C) 131 °F (55 °C)
95% 86 °F (30 °C) 93 °F (34 °C) 100 °F (38 °C) 108 °F (42 °C) 117 °F (47 °C) 127 °F (53 °C)
100% 87 °F (31 °C) 95 °F (35 °C) 103 °F (39 °C) 112 °F (44 °C) 121 °F (49 °C) 132 °F (56 °C)
Key to colors:   Caution   Extreme caution   Danger   Extreme danger


For example, if the air temperature is 96 °F (36 °C) and the relative humidity is 65%, the heat index is 121 °F (49 °C)

Effects of the heat index (shade values)

[edit]
Heat index for temperature in °C with shaded caution/danger ranges
Heat index Notes
27–32 °C
(81–90 °F)
Caution: fatigue is possible with prolonged exposure and activity. Continuing activity could result in heat cramps.
32–41 °C
(90–106 °F)
Extreme caution: heat cramps and heat exhaustion are possible. Continuing activity could result in heat stroke.
41–54 °C
(106–129 °F)
Danger: heat cramps and heat exhaustion are likely; heat stroke is probable with continued activity.
over 54 °C
(129 °F)
Extreme danger: heat stroke is imminent.

Exposure to full sunshine can increase heat index values by up to 8 °C (14 °F).[12]

Formula

[edit]
Comparison of NWS heat index values (circles) with the formula approximation (curves). In the SVG file, hover over a graph to highlight it.

There are many formulas devised to approximate the original tables by Steadman. Anderson et al. (2013),[13] NWS (2011), Jonson and Long (2004), and Schoen (2005) have lesser residuals in this order. The former two are a set of polynomials, but the third one is by a single formula with exponential functions.

The formula below approximates the heat index in degrees Fahrenheit, to within ±1.3 °F (0.7 °C). It is the result of a multivariate fit (temperature equal to or greater than 80 °F (27 °C) and relative humidity equal to or greater than 40%) to a model of the human body.[1][14] This equation reproduces the above NOAA National Weather Service table (except the values at 90 °F (32 °C) & 45%/70% relative humidity vary unrounded by less than ±1, respectively).

where

  • HI = heat index (in degrees Fahrenheit)
  • T = ambient dry-bulb temperature (in degrees Fahrenheit)
  • R = relative humidity (percentage value between 0 and 100)

The following coefficients can be used to determine the heat index when the temperature is given in degrees Celsius, where

  • HI = heat index (in degrees Celsius)
  • T = ambient dry-bulb temperature (in degrees Celsius)
  • R = relative humidity (percentage value between 0 and 100)

An alternative set of constants for this equation that is within ±3 °F (1.7 °C) of the NWS master table for all humidities from 0 to 80% and all temperatures between 70 and 115 °F (21–46 °C) and all heat indices below 150 °F (66 °C) is:

A further alternate is this:[15]

where

For example, using this last formula, with temperature 90 °F (32 °C) and relative humidity (RH) of 85%, the result would be: 114.9 °F (46.1 °C).

Limitations

[edit]

The heat index does not work well with extreme conditions, like supersaturation of air, when the air is more than 100% saturated with water. David Romps, a physicist and climate scientist at the University of California, Berkeley and his graduate student Yi-Chuan Lu, found that the heat index was underestimating the severity of intense heat waves, such as the 1995 Chicago heat wave.[16]

Other issues with the heat index include the unavailability of precise humidity data in many geographical regions, the assumption that the person is healthy, and the assumption that the person has easy access to water and shade.[17]

See also

[edit]

References

[edit]
[edit]
Revisions and contributorsEdit on WikipediaRead on Wikipedia
from Grokipedia
The heat index, also known as the , is a calculated measure that combines air and relative humidity to represent the perceived felt by the in shaded conditions, accounting for the reduced efficiency of sweat evaporation in humid environments. Developed in 1979 by R. G. Steadman as part of an apparent table incorporating human physiological responses, it was adopted by the (NWS) following extensive research to better communicate heat stress risks. The index is particularly relevant in warm climates where high humidity exacerbates heat's impact, as it can make conditions feel significantly hotter than the actual air —for instance, at 100°F with 55% relative humidity, the heat index reaches 124°F, while at 15% humidity it drops to 96°F. The heat index is computed using a multiple regression derived from Steadman's foundational work and refined by Lans P. Rothfusz in 1990 through the NWS Technical Attachment SR 90-23, with the core expressed as:
HI = -42.379 + 2.04901523×T + 10.14333127×RH - 0.22475541×T×RH - 0.00683783×T² - 0.05481717×RH² + 0.00122874×T²×RH + 0.00085282×T×RH² - 0.00000199×T²×RH²,
where T is the air in °F and RH is the relative in percent; adjustments apply for low humidity (below 13%) or high humidity (above 85%) in specific temperature ranges to improve accuracy, with an overall error margin of ±1.3°F. This metric is valid primarily for temperatures above 80°F and assumes shaded exposure, as direct can elevate the effective heat index by up to 15°F.
In practice, the NWS uses heat index values to issue public warnings, categorizing risks based on potential health effects from prolonged exposure or physical activity, as is the leading cause of weather-related deaths . From 1979 to 2003, claimed an of 175 lives annually and over 8,000 total—more than those from hurricanes, , tornadoes, and floods combined. Recent studies indicate heat-related deaths have increased, exceeding 1,300 annually in the U.S. as of the . The classification system includes:
Heat Index (°F)CategoryPotential Effects
80–90CautionFatigue possible with prolonged exposure and/or physical activity.
90–103Extreme CautionHeat cramps or exhaustion possible; heat stroke possible with prolonged exposure.
103–124DangerHeat cramps or exhaustion likely; heat stroke possible.
125+Extreme DangerHeat stroke highly likely.
Regions like the Central Plains and mid-Mississippi Valley experience the highest heat index values due to warm temperatures and proximity to moisture sources such as the , with climatological studies showing varying frequencies of extreme events (e.g., heat index ≥105°F occurs 0.61% of summer days in ).

Fundamentals

Definition

The heat index is a measure of how hot it actually feels to the when relative humidity is factored in with the current air temperature, providing an "" that reflects perceived thermal conditions on exposed skin. This metric quantifies the combined effect of heat and moisture in the air, which can make environments feel significantly warmer than the thermometer reading alone. In contrast to the , which solely measures the of the air without considering , the heat index serves as a "feels-like" by incorporating relative 's role in altering human perception. High levels saturate the air, slowing the of sweat from the skin and thereby diminishing the body's primary cooling mechanism. Humans regulate body temperature mainly through perspiration, where sweat evaporates to dissipate heat, but this process becomes less effective in humid conditions, leading to a higher heat index value that better indicates the true thermal burden on the body. The heat index concept stems from foundational biometeorological research, including work by R.G. Steadman in 1979 that integrated physiological responses to and .

Importance

The heat index plays a crucial role in and public safety by providing a measure of how hot it actually feels to the , enabling authorities to issue timely advisories and warnings. The (NWS), part of the (NOAA), adopted the heat index in 1979 to assess sultriness and has since integrated it into operational forecasts for heat alerts. This application directly influences public behavior, such as scheduling outdoor activities during cooler periods, and impacts energy consumption patterns by informing decisions on use during peak heat periods. In occupational safety, the heat index serves as a key metric for protecting workers from heat-related illnesses, particularly in high-risk sectors like and . The (OSHA) uses the heat index in tools like the OSHA-NIOSH Heat Safety Tool to assess risks and recommend measures such as rest breaks, hydration, and for heat index values of 80°F or higher. A proposed heat standard, as of November 2025, would establish initial triggers at 80°F and high-heat triggers at 90°F heat index with escalating protections. Urban planners incorporate metrics like the heat index to assess effects and support mitigation strategies, such as increasing green spaces and using cool roofing materials to alleviate heat stress in cities. Globally, the heat index concept extends beyond the , with adaptations like Australia's , developed by the , which similarly combines air and to gauge and issue heat alerts. As drives more frequent and intense heat events—evidenced by rising numbers of high heat index days since 1979—the index's importance grows for vulnerable populations worldwide, underscoring its role in proactive risk management. As of 2025, with ongoing , organizations like the have emphasized heat index-like metrics in global heat action plans.

History and Development

Origins

The concept of the heat index traces its roots to earlier efforts in the mid-20th century to quantify thermal discomfort, particularly through the Temperature-Humidity Index (THI), which emerged from agricultural research in the 1950s. Originally developed by biometeorologist E. C. Thom in 1959 as a measure of comfort combining air and , the THI was soon adapted for livestock management to assess heat stress in and other animals, reflecting its initial focus on practical applications in humid farming regions. The modern heat index was formally introduced in 1979 by Robert G. Steadman, a researcher at , in his seminal paper published in the Journal of Applied Meteorology. Steadman's work built on physiological models of human heat regulation, incorporating factors such as clothing insulation and body mass to create a more nuanced index of "sultriness"—the perceived discomfort from combined high temperatures and humidity—aimed at improving public awareness of humid heat risks in regions like the U.S. Midwest and Southeast, where such conditions frequently affect daily life and outdoor activities. That same year, the adopted Steadman's framework for operational use by the , marking the heat index's early integration into public to better communicate the combined effects of heat and humidity beyond simple temperature readings. This adoption emphasized its role in enhancing safety advisories for vulnerable populations in humid climates.

Evolution and Standardization

Following the initial development and adoption of the heat index in 1979, the (NOAA) and the (NWS) refined it during the 1980s and 1990s to enhance its practical application in . By 1990, NWS Lans P. Rothfusz formalized the core equation in a technical attachment (SR 90-23), standardizing its calculation for operational use and enabling consistent issuance of heat advisories based on projected values. Refinements included explicit adjustments for environmental exposure, such as adding up to 15°F to shaded heat index values when in direct sunlight, to reflect real-world conditions more precisely. This period also saw the index's full integration into NWS routine forecasts, where it became a key component for alerting the public to heat stress risks during summer months. Further updates in the , including adjustments for extreme and conditions, improved the formula's accuracy. In the 2000s and , the heat index evolved further through its incorporation into broader climate assessment tools and digital platforms. Climate models began routinely projecting future heat index trends, revealing substantial increases in extreme values under various emissions scenarios; for instance, a 2019 study using Phase 5 (CMIP5) data forecasted four- to twenty-fold rises in population exposure to heat index days exceeding 37.8°C (100°F) by mid-century in the United States. Post-2010, the proliferation of smartphones led to widespread integration of heat index calculators in mobile weather applications, such as those from , allowing real-time user access to localized "feels-like" temperatures and safety alerts. These updates were particularly highlighted in responses to major events, including the 2021 heat , where heat index values surpassed 110°F amid record-breaking temperatures, prompting enhanced NWS forecasting tools like experimental HeatRisk maps to better communicate multi-day heat impacts. Internationally, the heat index has influenced thermal stress metrics, though adaptations vary by region. In , it informed the development of the Universal Thermal Climate Index (UTCI) in the early 2000s, a more comprehensive biometeorological index that builds on similar principles but incorporates and solar radiation for broader applicability in heat-health risk assessments across the continent. Asian meteorological services have adopted heat index-like measures for heatwave monitoring, with applications in South and to evaluate humid heat exposure in densely populated areas, as seen in analyses of events like the 2023 April heatwave over and . The (WHO) has referenced heat index principles in its heat-health guidance since updates in the late 2010s, emphasizing its role in defining thresholds for interventions in vulnerable regions. In 2025, the NWS implemented enhancements to heat communication products as part of its Hazard Simplification Project, renaming Excessive Heat Watches and Warnings to Extreme Heat Watches and Warnings to simplify messaging and improve public understanding of hazardous heat conditions.

Calculation Methods

Core Formula

The core formula for computing the heat index (HI) is a multiple regression developed by the (NWS) to approximate the felt by humans in shaded conditions with light winds. This stems from Robert G. Steadman's biometeorological model, which integrates human and science to solve heat balance for the body, accounting for processes like sweat , , , and conduction. Steadman's work produced tables of "apparent temperatures" under standard conditions (e.g., 1.6 kPa , 180 W/m² metabolic activity, and typical summer ), and the NWS formula regresses these values specifically for air temperatures (T) of 80°F or higher. The primary equation is: HI=42.379+2.04901523[T](/page/Temperature)+10.14333127RH0.22475541[T](/page/Temperature)RH0.00683783[T](/page/Temperature)20.05481717RH2+0.00122874[T](/page/Temperature)2RH+0.00085282[T](/page/Temperature)RH20.00000199[T](/page/Temperature)2RH2\begin{align*} \text{HI} &= -42.379 + 2.04901523\, [T](/page/Temperature) + 10.14333127\, \text{RH} \\ &\quad - 0.22475541\, [T](/page/Temperature) \cdot \text{RH} - 0.00683783\, [T](/page/Temperature)^2 - 0.05481717\, \text{RH}^2 \\ &\quad + 0.00122874\, [T](/page/Temperature)^2 \cdot \text{RH} + 0.00085282\, [T](/page/Temperature) \cdot \text{RH}^2 \\ &\quad - 0.00000199\, [T](/page/Temperature)^2 \cdot \text{RH}^2 \end{align*} where TT is the dry-bulb air temperature in degrees and RH is the relative humidity as an integer percentage (without the % sign). The multiple yielded a standard error of the estimate of approximately ±0.7°F within the fitted range of 80–112°F and 40% ≤ RH ≤ 85%, but the overall estimated error of the equation is ±1.3°F. For relative humidity outside the 40–85% range when the temperature is between 80°F and 112°F, adjustments are applied to the HI value from the primary equation:
  • If RH < 13%: HI = HI − [3.398 + 1.486 × T − 12.78] + (RH / 100) × [17.27 × T − 289.6]
  • If RH > 85%: HI = HI + [(RH / 100) × (6.387 × T − 117.4) − (0.0175 × T + 1.187) × ((RH / 100) × 6.387 × T − 117.4 − 42.379) + 8.665 × 10^{-4} × T × ((RH / 100) × 6.387 × T − 117.4 − 42.379)^2 − 2.073 × 10^{-6} × T^2 × ((RH / 100) × 6.387 × T − 117.4 − 42.379)^2], but simplified approximations are often used, such as adding up to 4–6°F for high RH.
To demonstrate its application, consider T = 90°F and RH = 65%. The calculation proceeds term by term as follows:
  • Constant: -42.379
  • 2.04901523×90=184.4112.04901523 \times 90 = 184.411
  • 10.14333127×65=659.31710.14333127 \times 65 = 659.317
  • 0.22475541×90×65=1,314.819-0.22475541 \times 90 \times 65 = -1{,}314.819
  • 0.00683783×902=55.386-0.00683783 \times 90^2 = -55.386
  • 0.05481717×652=231.603-0.05481717 \times 65^2 = -231.603
  • 0.00122874×902×65=646.9320.00122874 \times 90^2 \times 65 = 646.932
  • 0.00085282×90×652=324.2850.00085282 \times 90 \times 65^2 = 324.285
  • 0.00000199×902×652=68.103-0.00000199 \times 90^2 \times 65^2 = -68.103
Summing these yields HI ≈ 102°F (rounded to the nearest degree, consistent with NWS chart between 100°F at 60% RH and 103°F at 70% RH). This value indicates the temperature feels noticeably warmer than the actual air due to reduced sweat at higher .

Meteorological Factors

The heat index calculation assumes shaded conditions with light winds (typically less than 6 mph) and no direct solar , providing a baseline for perceived in calm environments. Exposure to direct increases the effective heat index by approximately 15°F (8°C) due to additional radiant heat load on the body. In contrast, shaded areas maintain the standard heat index value, reducing the risk of overestimation in forested or urban shaded settings. similarly mitigates solar exposure, effectively lowering the heat index by limiting incoming , though its impact varies with coverage density and is often approximated through shade adjustments. Wind speed plays a key role in modifying the heat index through enhanced convective cooling and from the skin; higher wind speeds can reduce the perceived heat, particularly in humid conditions by promoting sweat , though this effect diminishes in very dry air where wind may exacerbate , and the heat index does not directly incorporate wind effects. Beyond air and relative , the heat index integrates closely with other metrics for accuracy. temperature serves as an alternative input to relative humidity, offering a more stable measure of absolute content that directly influences rates and thus the heat index value. , which combines and effects on a wetted , relates indirectly as it informs humidity calculations but is primarily used in complementary indices like the for solar-inclusive assessments. Urban heat islands amplify the heat index in densely built environments by elevating local air temperatures 1.8–5.4°F (1–3°C) above rural surroundings, intensifying humidity-trapped heat through reduced vegetation and increased impervious surfaces. Standard measurements for heat index inputs rely on psychrometers at weather stations, which use dry-bulb thermometers for air and wet-bulb thermometers for via evaporative cooling to compute relative humidity. Automated sensors, including capacitive hygrometers and thermistors, have largely replaced manual psychrometers in modern networks like the NOAA Cooperative Observer Program for precise, continuous data collection. In the 2020s, advancements in satellite-derived data from instruments like the Advanced Baseline Imager on /17 satellites enable high-resolution retrievals of atmospheric profiles, improving heat index estimates over remote or data-sparse regions by integrating near-real-time moisture observations with ground validations.

Reference Values

Numerical Table

The numerical table below presents heat index values derived from official National Oceanic and Atmospheric Administration (NOAA) charts, interpolated linearly for air temperatures in 5°F increments from 80°F to 130°F and relative levels from 40% to 100% in 10% increments. These values represent the felt by the in shaded conditions, accounting for reduced due to . To use the table for forecasting or real-time assessment, identify the current or predicted air temperature along the rows and the relative humidity along the columns; the value at their intersection is the heat index. This facilitates rapid evaluation of potential heat stress without performing complex calculations. Note that the table is in , as standardized by U.S. meteorological services; for equivalents, convert by subtracting 32 and multiplying by 5/9. Direct may increase the effective heat index by up to 15°F, and the values assume calm winds.
Air Temperature (°F)40% RH50% RH60% RH70% RH80% RH90% RH100% RH
8081838588919497
85899296100104109113
9096101106112119126134
95101109116125134143153
100105115125135149161174
105109122135147163179191
110113128142156173189203
115117134150165183200217
120121139157173193210229
125125144165181203220242
130128149172188213230254
For instance, at 95°F and 70% RH, the heat index is 125°F.

Risk Categories

The (NWS) classifies heat index (HI) values into risk categories to communicate the potential for heat-related illnesses, based on the combined effects of temperature and . These categories provide a standardized framework for public warnings, emphasizing escalating health threats as HI rises. The lowest tier, designated as "Caution," applies to HI values between 80°F and 90°F (27°C to 32°C), where individuals are advised to take precautions such as and limiting strenuous activity, as may begin to set in under prolonged exposure. Progressing to "Extreme Caution" for HI from 91°F to 103°F (33°C to 39°C), the risk increases for heat cramps and , particularly during physical exertion, prompting recommendations to wear lightweight clothing and avoid direct sun. The "Danger" category covers HI from 104°F to 124°F (40°C to 51°C), where heat cramps or exhaustion are likely, and heatstroke becomes possible, necessitating reduced outdoor time and hydration focus. At the highest level, "Extreme Danger" for HI of 125°F or greater (52°C+), heatstroke is highly probable, with symptoms including and organ damage, requiring immediate medical attention and avoidance of outdoor activities. In addition to the heat index, the NWS introduced the experimental HeatRisk tool in 2024 in collaboration with the CDC. HeatRisk provides a color-coded, five-level forecast of heat-related health risk that accounts for local , , and impacts on vulnerable populations such as the elderly, children, and those with chronic conditions.

Human Impacts

Physiological Effects

The human body maintains thermal balance through , primarily relying on evaporative cooling via sweat when ambient temperatures exceed . High , as incorporated in the heat index, reduces the gradient between the skin and air, impairing sweat and limiting heat dissipation, which results in elevated core body temperature. This inefficiency forces the body to increase cutaneous blood flow for dry heat loss, straining the cardiovascular system by redirecting blood from vital organs and muscles, while exacerbates the issue by reducing plasma volume and further elevating . Short-term exposure to elevated heat index levels triggers heat stress symptoms due to this thermoregulatory failure, including from increased metabolic demand, muscle cramps from imbalances and , and from reduced cerebral blood flow. These effects arise as core temperature rises above 38°C (100.4°F), impairing neuromuscular function and oxygen delivery. Prolonged acute exposure without intervention can progress to , characterized by nausea, headache, and profuse sweating, signaling the onset of systemic strain. Repeated exposure to high heat index conditions poses long-term risks, such as chronic kidney damage from recurrent and , where muscle breakdown releases that impairs renal filtration. Studies indicate that over extended periods elevates the incidence of , potentially leading to through tubular damage and . Individual variations significantly influence susceptibility to these physiological effects. Heat-acclimatized individuals, through 10-14 days of exposure, exhibit improved with earlier sweating onset, higher sweat rates, and expanded plasma volume, reducing cardiovascular strain compared to non-acclimatized persons. Older adults and those with face heightened vulnerability; aging diminishes function and capacity, while excess acts as insulation, increasing core temperature rise and cardiovascular load during stress. Studies from the indicate that stress can lead to substantial declines (10-30%) in endurance performance due to accelerated and impaired , with non-acclimatized individuals experiencing greater decrements. As of 2025, intensified with heat indices exceeding 110°F have been reported more frequently, heightening these risks globally.

Health and Safety Guidelines

The National Weather Service (NWS) and Centers for Disease Control and Prevention (CDC) recommend specific protocols to mitigate heat-related risks based on heat index levels. For heat indices above 90°F, individuals should implement frequent rest breaks in shaded or air-conditioned areas, maintain hydration by drinking water every 15-20 minutes even without thirst, and avoid strenuous activity during peak heat hours. At heat indices exceeding 105°F, authorities advise limiting or avoiding outdoor exposure, seeking medical attention for symptoms of heat exhaustion, and suspending non-essential activities to prevent heat stroke. These guidelines extend to institutional settings, where schools must adjust recess and physical education schedules—such as shortening outdoor time or moving indoors—when heat indices surpass 90°F, while workplaces are required to provide shaded rest areas, cooling measures, and acclimatization periods for new employees over 7-14 days. Tailored advice emphasizes protection for vulnerable populations, including outdoor workers, athletes, and urban dwellers, who face heightened exposure due to physical demands or environmental factors. For outdoor workers, such as or agricultural laborers, guidelines mandate access to potable , replenishment, and mandatory breaks every hour when indices reach 80°F or higher, with work rotation to limit continuous exposure. Athletes, particularly in team sports, should follow pre-event hydration plans, monitor for early fatigue signs, and restrict practices to early morning or evening when heat indices exceed 90°F, incorporating gradual over two weeks. Urban dwellers in heat-vulnerable areas are advised to utilize community cooling centers, avoid asphalt-heavy zones during midday, and coordinate with local heat action plans that integrate heat index forecasts for targeted alerts. In the , the 2022 heat action plans, informed by the EuroHEAT project, require member states to develop coordinated strategies including public awareness campaigns, emergency response protocols, and integration of heat index data into to safeguard at-risk groups during extreme events. Recent advancements in 2024 and 2025 have introduced mobile applications and alert systems leveraging real-time heat index calculations for personalized warnings. The OSHA-NIOSH Heat Safety Tool app, updated in 2024, provides location-specific heat index forecasts, risk assessments, and tailored recommendations like break schedules for workers, reaching millions of users to enhance on-site decision-making. Similarly, the AIHA Heat Stress app, launched in 2024, offers five-day projections adjusted for heat index equivalents, alerting users to potential hazards and suggesting mitigation steps for outdoor activities. In 2025, the NWS implemented revised Heat Watch and Warning criteria incorporating real-time heat index data for more precise public notifications, while apps like HeatAlert utilize crowd-sourced networks to deliver hyper-local alerts, enabling proactive measures such as route adjustments for urban commuters.

Limitations and Comparisons

Key Limitations

The heat index model relies on several simplifying assumptions that limit its applicability in real-world scenarios. It does not account for the effects of , direct , radiant heat sources, or physical workload, which can significantly alter perceived heat stress. For instance, full can increase effective heat index values by up to 15°F, while strenuous activity or heavy further exacerbates the discrepancy. Additionally, the model assumes conditions in shaded areas with light , potentially underrepresenting risks in exposed or low-airflow environments. It is also calibrated for non-acclimatized individuals and primarily validated in temperate climates, limiting its precision in diverse global contexts. The heat index is calibrated for an average, healthy adult at rest in the shade, which introduces accuracy issues for diverse populations and conditions. Vulnerable groups, such as children and obese individuals, may experience heightened heat stress due to differences in body size, metabolic rate, and . For children, higher surface-area-to-volume ratios lead to greater heat loss but also faster overheating during exertion, while impairs through reduced sweat efficiency. In extreme levels above 85%, the model underestimates perceived by failing to capture nonlinear physiological responses, with extrapolations breaking down beyond original validation ranges. Recent critiques highlight the heat index's limitations amid climate change-driven extremes, as seen in analyses following severe Indian heatwaves in 2023 where temperatures exceeded 45°C with high . These events underscored compounded risks in rapidly warming regions. projections indicate that extreme humid heat could approach human survivability limits by mid-century, potentially requiring advanced models for . Post-heatwave reviews emphasized that the index overlooks amplified vulnerabilities in developing contexts, such as urban poverty and agricultural exposure. Measurement challenges further undermine the heat index's reliability, stemming from variability in humidity sensors and spatial discrepancies. Humidity sensors often exhibit inaccuracies due to calibration drift, environmental contaminants, or infrequent high-resolution data, leading to uncertainties in relative humidity estimates critical to the index. Urban-rural differences compound this, with cities typically showing lower humidity but higher temperatures from heat islands, resulting in moderated but uneven heat index values compared to rural areas where higher humidity can elevate risks despite cooler air. The Wet Bulb Globe Temperature (WBGT) serves as a key alternative to the heat index, particularly for assessing , by incorporating air temperature, , wind speed, and solar radiation to measure the body's response in direct sunlight. Developed by the U.S. military in the , WBGT provides a composite index that accounts for radiant heat, making it more suitable for environments with significant solar exposure compared to the heat index's focus on shaded conditions. The Universal Thermal Climate Index (UTCI) offers another alternative with broader global applicability, integrating , relative humidity, , and mean radiant temperature to simulate physiological strain across diverse climates and seasons. Unlike the heat index, which primarily emphasizes humidity's role in perceived , UTCI explicitly includes wind effects on convective cooling, enhancing its utility for and biometeorological assessments worldwide. In , the (AT) functions as a wind-adjusted variant similar to the heat index, combining air , , and to estimate "feels-like" conditions that extend the heat index's framework into moderate wind scenarios. This index, developed by the , refines the heat index by incorporating elements, providing a unified metric for both heat and cooling sensations across a wider range of weather. Comparisons reveal that the heat index is simpler and more accessible for general use, relying solely on and , but it is less precise than WBGT for occupational settings where and influence heat strain during physical work. In contrast, UTCI and AT offer enhanced accuracy by factoring in , though they require more input data. The heat index is best suited for weather forecasts to communicate everyday discomfort risks, while WBGT is preferred for , operations, and outdoor labor where direct sun exposure demands activity adjustments like rest breaks.

References

Add your contribution
Related Hubs
User Avatar
No comments yet.