Hubbry Logo
Miles per gallon gasoline equivalentMiles per gallon gasoline equivalentMain
Open search
Miles per gallon gasoline equivalent
Community hub
Miles per gallon gasoline equivalent
logo
8 pages, 0 posts
0 subscribers
Be the first to start a discussion here.
Miles per gallon gasoline equivalent
from Wikipedia
Monroney label showing the EPA's fuel economy equivalent ratings for the 2011 Chevrolet Volt. The rating for all-electric mode (left) is expressed in miles per gallon gasoline equivalent (mpg).

Miles per gallon gasoline equivalent (MPGe or MPGge) is a measure of the average distance traveled per unit of energy consumed. MPGe is used by the United States Environmental Protection Agency (EPA) to compare energy consumption of alternative fuel vehicles, plug-in electric vehicles and other advanced technology vehicles with the energy consumption[1] of conventional internal combustion vehicles rated in miles per U.S. gallon.[2][3]

The unit of energy consumed is deemed to be 33.7 kilowatt-hours without regard to the efficiency of conversion of heat energy into electrical energy, also measured in kilowatt-hours (kWh). The equivalence of this unit to energy in a gallon of gasoline is true if and only if the heat engine, generating equipment, and power delivery to the car battery are 100% efficient. Actual heat engines differ vastly from this assumption.

MPGe does not necessarily represent an equivalency in the operating costs between alternative fuel vehicles and the MPG rating of internal combustion engine vehicles due to the wide variation in costs for the fuel sources regionally[4][5] since the EPA assumes prices that represents the national averages.[6][7] Miles per gallon equivalent cost for alternate fuel can be calculated with a simple conversion to the conventional mpg (miles per gallon, miles/gal). See conversion to MPG by cost below.

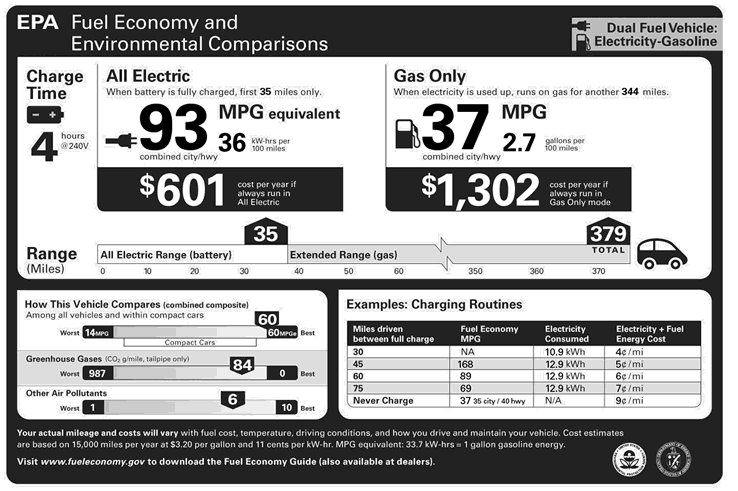
The MPGe metric was introduced in November 2010 by EPA in the Monroney sticker of the Nissan Leaf electric car and the Chevrolet Volt plug-in hybrid. The ratings are based on EPA's formula, in which 33.7 kWh (121 MJ) of electricity is equivalent to one (U.S.) gallon of gasoline,[8] and the energy consumption of each vehicle during EPA's five standard drive cycle tests simulating varying driving conditions.[9][10] All new cars and light-duty trucks sold in the U.S. are required to have this label showing the EPA's estimate of fuel economy of the vehicle.[3]

In a joint ruling issued in May 2011 the National Highway Traffic Safety Administration (NHTSA) and EPA established the new requirements for a fuel economy and environment label that is mandatory for all new passenger cars and trucks starting with model year 2013. This ruling uses miles per gallon gasoline equivalent for all fuel and advanced technology vehicles available in the U.S. market including plug-in hybrids, electric vehicles, flexible-fuel vehicles, hydrogen fuel cell vehicle, natural gas vehicles, diesel-powered vehicles, and gasoline-powered vehicles.[11][12] In addition to being displayed on new vehicles, fuel economy ratings are used by the U.S. Department of Energy (DOE) to publish the annual Fuel Economy Guide; the U.S. Department of Transportation (DOT) to administer the Corporate Average Fuel Economy (CAFE) program; and the Internal Revenue Service (IRS) to collect gas guzzler taxes.[3]

Fuel economy estimates for window stickers and CAFE standard compliance are different. The EPA MPGe rating shown in the Monroney label is based on the consumption of the on-board energy content stored in the fuel tank or in the vehicle's battery, or any other energy source, and only represents the tank-to-wheel energy consumption. CAFE estimates are based on a well-to-wheel basis and in the case of liquid fuels and electric drive vehicles also account for the energy consumed upstream to produce the fuel or electricity and deliver it to the vehicle. Fuel economy for CAFE purposes include an incentive adjustment for alternative fuel vehicles and plug-in electric vehicles which results in higher MPGe than those estimated for window stickers.[13][14]

Background

[edit]

1988: Alternative Motor Fuels Act

[edit]

The Alternative Motor Fuels Act (AMFA) enacted in 1988[15] provides Corporate Average Fuel Economy (CAFE) incentives for manufacturing alternative fuel vehicles (AFVs) that are powered by ethanol, methanol, or natural gas fuels, either exclusively or in conjunction with gasoline or diesel fuel. These dual-fuel vehicles also are known as flexible-fuel vehicles (FFVs). To provide incentives for the widespread use of these fuels and to promote the production of AFVs and FFVs, AMFA grants AFV/FFV manufacturers CAFE credits, which allows them to raise their overall fleet fuel economy levels to comply with the CAFE standards.[16][17]

Beginning in 1993, manufacturers of qualified AFVs can improve their CAFE estimation by computing the weighted average of the fuel economy when operating on conventional fuel (gasoline and diesel) and when operating on alternative fuel(s).[16]: 9–10  AMFA provides the following energy content-based equivalency factors:[15]: §513 

  • 1 gal (alcohol) = 0.15 gal (gasoline)
  • 100 ft3 (natural gas) = 0.823 gal-equivalent (natural gas)
    • 1 gal-equivalent (natural gas) = 0.15 gal (gasoline)

A dedicated AFV which operates solely on alcohol would divide the alcohol fuel economy by the energy-equivalency factor of 0.15. As an example, a dedicated AFV that achieves 15 mpg fuel economy while operating on alcohol would have a CAFE calculated as follows:[16]: 10 

For FFVs, an assumption is made that the vehicles would operate 50% of the time on the alternative fuel and 50% of the time on conventional fuel, resulting in a fuel economy that is based on a harmonic average of alternative fuel and conventional fuel. For example, for an alternative dual-fuel model that achieves 15 miles per gallon operating on an alcohol fuel and 25 mpg on the conventional fuel, the resulting CAFE would be:[16]: 10 

Calculation of fuel economy for natural gas vehicles is similar. For the purposes of this calculation, the fuel economy is equal to the weighted average of the fuel economy while operating on natural gas and while operating on either gasoline or diesel fuel. AMFA specifies the energy content of 100 cubic feet of natural gas to be equal to 0.823 gallons-equivalent of natural gas, and the gallon equivalency of natural gas is considered to have a fuel content, similar to that for alcohol fuels, equal to 0.15 gallons of fuel. For example, under this conversion and gallon equivalency, a dedicated natural gas vehicle that achieves 25 miles per 100 cubic feet of natural gas would have a CAFE value as follows:[16]: 10 

The Energy Policy Act of 1992 expanded the definition of alternative fuel to include liquefied petroleum gas, hydrogen, liquid fuels derived from coal and biological materials, electricity and any other fuel that the Secretary of Transportation determines to be substantially non-petroleum based and has environmental and energy security benefits. Beginning in 1993, manufacturers of these other alternative fuel automobiles that meet the qualifying requirements can also benefit for special treatment in the calculation of their CAFE.[17]

1994: Gasoline gallon equivalent

[edit]

In 1994 the U.S. National Institute of Standards and Technology (NIST) introduced gasoline gallon equivalent (GGE) as a metric for fuel economy for natural gas vehicles. NIST defined a gasoline gallon equivalent (GGE) as 5.660 pounds of natural gas, and gasoline liter equivalent (GLE) as 0.678 kilograms of natural gas.[18]

2000: Petroleum-equivalent fuel economy

[edit]
Energy efficiency for selected electric cars leased in California between 1996 and 2003
Vehicle Model year Type of battery Energy use (kWh/mile) Energy efficiency (miles/kWh) Energy efficiency (MPGe, miles/33.7 kWh)
GM EV1[19] 1997 Lead acid 0.164 6.10 205[note 1]
GM EV1[20] 1999 NiMH 0.179 5.59 188[note 1]
Toyota RAV4 EV[21] 1996 Lead acid 0.235 4.28 143
Toyota RAV4 EV[22] 2000 NiMH 0.400 2.50 84
Ford Ranger EV[23] 1998 Lead acid 0.337 2.98 100
Chevrolet S-10 EV[24] 1997 Lead acid 0.292 3.42 115

During the late 1990s and early 2000s several electric cars were produced in limited quantities as a result of the California Air Resources Board (CARB) mandate for more fuel-efficient zero-emissions vehicles. Popular models available in California included the General Motors EV1 and the Toyota RAV4 EV.[25][26] The U.S. DoE and EPA rating for on board energy efficiency for these electric vehicles was expressed as kilowatt hour/mile (KWh/mi), the most commonly known metric in science and engineering for measuring energy consumption, and used as the billing unit for energy delivered to consumers by electric utilities.[27]

In order to address the Corporate Average Fuel Economy (CAFE) regulations mandated by the U.S. Congress in 1975, the U.S. Department of Energy established in July 2000 a methodology for calculating the petroleum-equivalent fuel economy of electric vehicles on a well-to-wheel basis. The methodology considers the upstream efficiency of the processes involved in the two fuel cycles. The energy content of gasoline is reduced from 33,705 Wh/gal to 83% of that, or about 27,975 Wh/gal well-to-tank, to account for the energy used in refinement and distribution. Similarly, the energy value for electricity produced from fossil fuel is reduced to 30.3% due to energy lost in generation and transmission, according to the national average. This is normalized to the previous gasoline value, resulting in a well-to-vehicle gasoline-equivalent energy content of electricity of only 12,307 Wh/gal.[14]

The formula also includes a "fuel content factor" of 1/0.15 (about 6.667) to benefit electric vehicles, raising the value from 12,307 to 82,049 Wh/gal. This reward factor is intended provide an incentive for vehicle manufactures to produce and sell electric vehicles, as a higher equivalent fuel economy for EVs improves the carmaker overall fleet fuel economy levels in complying with the CAFE standards, and Congress anticipated that such an incentive would help accelerate the commercialization of electric vehicles. The incentive factor chosen by DoE for EVs is the same 1/0.15 factor already applied in the regulatory treatment of other types of alternative fuel vehicles.[14] When all factors are considered in DoE's formula, the energy efficiency or equivalent fuel economy of electric vehicles increases, being calculated in miles per the petroleum-equivalency factor of 82,049 Wh/gal rather than miles per the usual gasoline gallon equivalent of 33,705 Wh/gallon, for the purposes of CAFE credits to manufacturers.[27]

2007: X Prize

[edit]

The Automotive X Prize competition was intended to encourage development of automobiles that would be capable of operating 100 miles on a gallon of gasoline (mpg). Comparison of electric vehicles to vehicles that carried their own engine was debated, since the notion of a miles per gallon equivalent as a metric for electric vehicles made the competition trivial for electric vehicles and a corresponding miles per gallon as a metric for the others extremely difficult for the others. Miastrada Company made the case that this defeated the purpose of the competition, to no avail. In April 2007, as part of Draft Competition Guidelines released at the New York Auto Show, MPGe was announced as the main merit metric for the Progressive Insurance Automotive X Prize, a competition developed by the X Prize Foundation for super-efficient vehicles that can achieve at least 100 MPGe.[28] In February 2009, Consumer Reports announced that, as part of a partnership with the X Prize Foundation, they planned to report MPGe as one of several measures that will help consumers understand and compare vehicle efficiency for alternative fuel vehicles.[29]

2010–2011: Miles per gallon equivalent

[edit]
Old Monroney label for electric cars showing in prominent larger font the fuel economy rating in kWh/100 miles for the 2009 Mini E
New Monroney label for electric cars showing in prominent larger font the fuel economy rating in miles per USgallon gasoline equivalent for the 2011 Nissan Leaf. The rating in kWh/100 miles is shown below MPG-e in smaller font.

As required by the 2007 Energy Independence and Security Act (EISA), with the introduction of advanced-technology vehicles in the U.S. new information should be incorporated in the Monroney label of new cars and light-duty trucks sold in the country, such as ratings on fuel economy, greenhouse gas emissions, and other air pollutants. The U.S. Environmental Protection Agency (EPA) and the National Highway Traffic Safety Administration (NHTSA) have conducted a series of studies to determine the best way to redesign this label to provide consumers with simple energy and environmental comparisons across all vehicles types, including battery electric vehicles (BEV), plug-in hybrid electric vehicles (PHEV), and conventional internal combustion engine vehicles powered by gasoline and diesel, in order to help consumers choose more efficient and environmentally friendly vehicles. These changes were proposed to be introduced in new vehicles beginning with model year 2012.[3][30]

The EPA rating for on board energy efficiency for electric vehicles before 2010 was expressed as kilowatt hour per 100 miles (kWh/100 mi).[27][31] For example, the window sticker of the 2009 Mini E showed an energy consumption of 33 kWh/100 mi for city driving and 36 kWh/100 mi on the highway, technically equivalent to 100 mpg‑e city and 94 mpg‑e highway.[31] Similarly, the 2009 Tesla Roadster was rated 32 kWh/100 mi (110 mpg‑e) in city and 33 kWh/100 mi (100 mpg‑e) on the highway.[32][33]

As part of the research and redesign process, EPA conducted focus groups where participants were presented with several options to express the consumption of electricity for plug-in electric vehicles. The research showed that participants did not understand the concept of a kilowatt hour as a measure of electric energy use despite the use of this unit in their monthly electric bills. Instead, participants favored a miles per gallon equivalent, MPGe, as the metric to compare with the familiar miles per gallon used for gasoline vehicles. The research also concluded that the kWh per 100 miles metric was more confusing to focus group participants compared to a miles per kWh. Based on these results, EPA decided to use the following fuel economy and fuel consumption metrics on the redesigned labels: MPG (city and highway, and combined); MPGe (city and highway, and combined); Gallons per 100 miles; kWh per 100 miles.[30]

The proposed design and final content for two options of the new sticker label that would be introduced in 2013 model year cars and trucks were consulted for 60 days with the public in 2010, and both include miles per gallon equivalent and kWh per 100 miles as the fuel economy metrics for plug-in cars, but in one option MPGe and annual electricity cost are the two most prominent metrics.[34][35] In November 2010, EPA introduced MPGe as comparison metric on its new sticker for fuel economy for the Nissan Leaf and the Chevrolet Volt.[9][10]

Typical label for hydrogen fuel cell vehicles expressed in MPGe, mandatory starting with 2013 model year

In May 2011, the NHTSA and EPA issued a joint final rule establishing new requirements for a fuel economy and environment label that is mandatory for all new passenger cars and trucks starting with model year 2013. The ruling includes new labels for alternative fuel and alternative propulsion vehicles available in the US market, such as plug-in hybrids, electric vehicles, flexible-fuel vehicles, hydrogen fuel cell vehicle, and natural gas vehicles.[11][12] The common fuel economy metric adopted to allow the comparison of alternative fuel and advanced technology vehicles with conventional internal combustion engine vehicles is miles per gallon of gasoline equivalent (MPGe). A gallon of gasoline equivalent means the number of kilowatt hours of electricity, cubic feet of compressed natural gas (CNG), or kilograms of hydrogen that is equal to the energy in a gallon of gasoline.[11]

The new labels also show for the first time an estimate of how much fuel or electricity it takes to drive 100 miles (160 km), introducing to U.S. consumers with fuel consumption per distance traveled, a metric commonly used in other countries. EPA explained that the objective is to avoid the traditional miles per gallon metric that can be potentially misleading when consumers compare fuel economy improvements, and known as the "MPG illusion".[11]

As mentioned above, confusion and misinterpretation is common in the public between the two types of "fuel efficiency". Fuel economy measures how far a vehicle will go per amount of fuel (units of MPGe). Fuel consumption is the reciprocal of fuel economy, and measures the fuel used to drive a fixed distance (units of gal/100 miles or kWh/100 miles).[36] The unit of Gal/100 miles is accurately described as fuel consumption in some EPA brochures, but this unit appears in the fuel economy section of the Monroney label (which does not use the term fuel consumption).[37][38]

Description

[edit]

The miles per gallon gasoline equivalent is based on the energy content of gasoline. The energy obtainable from burning one US gallon of gasoline is 115,000 BTU, 33.70 kWh, or 121.3 MJ.[8]

To convert the mile per gallon rating into other units of distance per unit energy used, the mile per gallon value can be multiplied by one of the following factors to obtain other units:

1 MPGe ≈ 1 mi/(33.70 kW·h)
≈ 8.696  mi/(million BTU)
≈ 0.02967 mi/kW·h
≈ 0.04775 km/kW·h
≈ 0.013 km/MJ

Conversion to MPGe

[edit]

MPGe is determined by converting the vehicle consumption per unit distance, as determined through computer modeling or completion of an actual driving cycle, from its native units into a gasoline energy equivalent. Examples of native units include W·h for electric vehicles, kg-H
2
for hydrogen vehicles, gallons for biodiesel or liquefied natural gas vehicles, cubic feet for compressed natural gas vehicles, and pounds for propane or Liquefied petroleum gas vehicles. Special cases for specific alternative fuels are discussed below, but a general formula for MPGe is:

For EPA, this considers the tank-to-wheel for liquids and wall-to-wheel energy consumption for electricity, i.e. it measures the energy for which the owner usually pays. For EVs the energy cost includes the conversions from AC to charge the battery.[39] The EPA MPGe ratings displayed in window stickers do not account for the energy consumption upstream, which includes the energy or fuel required to generate the electricity or to extract and produce the liquid fuel; the energy losses due to power transmission; or the energy consumed for the transportation of the fuel from the well to the station.[14][40]

Basic values for the energy content of various fuels are given by the defaults used in the Department of Energy GREET (Greenhouse gases, Regulated Emissions, and Energy used in Transportation) model,[41] as follows:

Note: 1 kWh is equivalent to 3,412 BTU

Fuel Unit Energy/unit GGE
gasoline gallon 116,090 BTU (34.02 kWh) 1.0000
diesel gallon 129,488 BTU (37.95 kWh) 0.8965
biodiesel gallon 119,550 BTU (35.04 kWh) 0.9711
ethanol gallon 76,330 BTU (22.37 kWh) 1.5209
E85 gallon 82,000 BTU (24.03 kWh) 1.4157
CNG 100 SCF 98,300 BTU (28.81 kWh) 1.181
H
2
KG 114,000 BTU (33.41 kWh) 1.0183
LPG gallon 84,950 BTU (24.90 kWh) 1.3666
methanol gallon 57,250 BTU (16.78 kWh) 2.0278

The energy content of a particular fuel can vary somewhat given its specific chemistry and production method. For example, in the new efficiency ratings that have been developed by the United States Environmental Protection Agency (EPA) for battery electric vehicles (BEVs) and plug-in hybrid electric vehicles (PHEVs) – see below – the energy content of a gallon of gasoline is assumed to be 114,989.12 BTU or 33.7 kWh.[8]

Conversion to MPG by cost

[edit]

The miles per gallon equivalent cost of an alternative fuel vehicle can be calculated by a simple formula to directly compare the MPG operating costs (rather than the energy consumption of MPGe[7]) with traditional vehicles since the cost of resources varies substantially from region to region.[5][4] For reference, the complete equation is:

Also for those that prefer kWh/100 mi an equivalent is simply:

This equation reduces down to a simple formula that works with only the capacity of the fuel source and its possible range to compare vehicles. With your local rates for gasoline and your fuel source you can easily compare your alternative fuel vehicle operating cost directly with a gasoline engine model with the following:

The formula includes the inherent efficiency of the vehicle as the range capability of a specific fuel source capacity directly represents the EPA testing, it then becomes universal regardless of weight, vehicle size, co-efficient of drag, rolling resistance as these directly influence the range possible and are accounted for. Driving style and weather conditions can be accounted for by using the achieved range instead of the advertised range for the calculation.

The formula works by deriving how much alternative fuel can be purchased for the cost of a gallon of gasoline, creating a ratio of this quantity to the storage capacity of the vehicle, and then multiplies this ratio by the vehicle's possible range. The result is number of miles the vehicle travels on alternative fuel for the same cost of a single gallon of gasoline.

The end computation results in MPG unit and is directly comparable to a standard internal combustion engine vehicle's fuel costs for its rated MPG.

Examples

[edit]

The formula with the correct units for a BEV or PHEV in all electric mode is like this.

Using EPA 2018 Fuel Economy Guides assumptions for national average pricing of $2.56/gal regular gasoline and $0.13/kWh[42] we can calculate a vehicle that is rated at 84 MPGe or 40 kW/100 Mi efficiency and has a 16.5 kW EV battery of which 13.5 kWh is usable for electric driving with an advertised range of 33 miles per charge.

Note: Using the battery size instead of the usable charge will provide a conservative value. Using actual charge and actual range driven will provide actual economy.

Calculate how many kWh per gallon

Now the same vehicle where gasoline with worth $3.20/gal and electricity is $0.085/kWh.

Calculate how many kWh per gallon

Electric and plug-in hybrid electric vehicles

[edit]
Monroney label showing the EPA's fuel economy equivalent ratings for the 2011 Smart ED electric car

Between 2008 and 2010 several major automakers began commercializing battery electric vehicles (BEVs), which are powered exclusively on electricity, and plug-in hybrid electric vehicles (PHEVs), which use electricity together with a liquid fuel stored in an on-board fuel tank, usually gasoline, but it might be also powered by diesel, ethanol, or flex-fuel engines.

For battery electric vehicles, the U.S. Environmental Protection Agency's formula to calculate the well-to-wheel MPGe is based on energy standards established by the U.S. Department of Energy in 2000:[2][13][14] The well-to-wheel conversion is used in calculation of corporate-average fuel economy (CAFE) but not for window sticker (Monroney) fuel economy. For Monroney fuel economy the equation is

where

is expressed as miles per gallon gasoline equivalent (as shown in the Monroney label)
energy content per gallon of gasoline = 115,000 Btu/gallon, as set by U.S. DoE and reported by the Alternative Fuel Data Center.[14]
wall-to-wheel electrical energy consumed per mile (Wh/mi) as measured through EPA's five standard drive cycle tests for electric cars and SAE test procedures[13][39]
energy unit conversion factor (rounded) = 3.412 Btu/Wh[14]

The formula employed by the EPA for calculating their rated MPGe does not account for any fuel or energy consumed upstream such as the generation and transmission of electrical power, or well-to-wheel life cycle, as EPA's comparison with internal combustion vehicles is made on a tank-to-wheel versus battery-to wheel basis.

The California Air Resources Board uses a different dynamometer testing than EPA, and considers reformulated gasoline sold in that state. For CARB estimates the formula becomes:[13]

The new SAE J1711 standard for measuring the exhaust emissions and fuel economy of hybrid electric vehicles and plug-in hybrids was approved in July 2010. The recommended procedures for PHEVs were revised at Argonne National Laboratory, and EPA's new regulation to define PHEV fuel economy reporting protocol is expected to be based on SAE J1711.[43][44] In November 2010 EPA decided to rate electric mode and gasoline only mode separately, and these are the two figures prominently displayed in the window sticker of the 2011 Chevrolet Volt. In electric mode the Volt's rating is estimated with the same formula as an electric car.[10][13] The overall or composite fuel economy rating combining electricity and gasoline powered are displayed in the Monroney label in a much smaller type, and as part of the comparison of the Volt's fuel economy among all vehicles and within compact cars.[45] EPA has considered several methodologies for rating the overall fuel economy of PHEVs, but as of February 2011 EPA has not announced the final methodology that will be applied for the purposes of estimating the new manufacture's 2012–2016 Corporate Average Fuel Economy (CAFE) credits for plug-in hybrids.[13][46]

Examples

[edit]

In November 2010 the EPA began including "MPGe" in its new sticker for fuel economy and environmental comparisons. The EPA rated the Nissan Leaf electric car with a combined fuel economy of 99 MPGe,[9] and rated the Chevrolet Volt plug-in hybrid with a combined fuel economy of 93 MPGe in all-electric mode, 37 MPG when operating with gasoline only, and an overall fuel economy rating of 60 mpg-US (3.9 L/100 km) combining power from electricity and gasoline.[10][45][47] For both vehicles EPA calculated the MPGe rating under its five-cycle tests using the formula displayed earlier with a conversion factor of 33.7 kWh of electricity being the energy equivalent of a gallon of gasoline.[10]

All-electric cars
[edit]

The following table compares official EPA ratings for fuel economy (in miles per gallon gasoline equivalent, mpg-e or MPGe, for plug-in electric vehicles) for series production all-electric passenger vehicles rated by the EPA for model years 2015,[48] 2016,[49] 2017,[50] and 2023[51] versus the model year 2016 vehicles that were rated the most efficient by the EPA with plug-in hybrid drivetrains (Chevrolet Volt – second generation), gasoline-electric hybrid drivetrains (Toyota Prius Eco - fourth generation),[52][53][54] and the average new vehicle for that model year, which has a fuel economy of 25 mpg‑US (9.4 L/100 km; 30 mpg‑imp).[49][52]

EPA rating data are taken from manufacturer testing of their own vehicles using a series of tests specified by federal law. Manufacturers usually conduct the tests using pre-production prototypes. Manufacturers report the results to EPA. The EPA then reviews the results and selects about 15%–20% of them to confirm through their own tests at the National Vehicles and Fuel Emissions Laboratory.[55]

Comparison of top fuel efficient battery-electric vehicles versus most efficient fossil fuel vehicles (including hybrid-electric vehicles)
(Fuel economy as displayed in the Monroney label)[48][49][50]
Vehicle Model
year
EPA rated fuel economy Notes
Combined City Highway
Toyota Prius HEV[51] 2023 57 mpg 57 mpg 56 mpg (9)
Hyundai Ioniq 6 Long Range RWD w/ 18-inch wheels[51] 2023 140 mpg‑e
24.1 kWh/100 mi; 15.0 kWh/100 km
153 mpg‑e
22.0 kWh/100 mi; 13.7 kWh/100 km
127 mpg‑e
26.5 kWh/100 mi; 16.5 kWh/100 km
(1)
Lucid Air Pure AWD w/ 19-inch wheels[51] 2023 140 mpg‑e
24.1 kWh/100 mi; 15.0 kWh/100 km
141 mpg‑e
23.9 kWh/100 mi; 14.9 kWh/100 km
140 mpg‑e
24.1 kWh/100 mi; 15.0 kWh/100 km
(1)
Tesla Model Y AWD[51] 2023 123 mpg‑e
27.4 kWh/100 mi; 17.0 kWh/100 km
129 mpg‑e
26.1 kWh/100 mi; 16.2 kWh/100 km
116 mpg‑e
29.1 kWh/100 mi; 18.1 kWh/100 km
(1)
Tesla Model 3[56] Standard Range[57] 2020 141 mpg‑e
23.9 kWh/100 mi; 14.9 kWh/100 km
148 mpg‑e
22.8 kWh/100 mi; 14.2 kWh/100 km
132 mpg‑e
25.5 kWh/100 mi; 15.9 kWh/100 km
(1)
Hyundai Ioniq Electric[50][58] 2017 136 mpg‑e
24.8 kWh/100 mi; 15.4 kWh/100 km
150 mpg‑e
22.5 kWh/100 mi; 14.0 kWh/100 km
122 mpg‑e
27.6 kWh/100 mi; 17.2 kWh/100 km
(1) (4)
BMW i3 (60 A·h)[59][60] 2014/15/16 124 mpg‑e
27.2 kWh/100 mi; 16.9 kWh/100 km
137 mpg‑e
24.6 kWh/100 mi; 15.3 kWh/100 km
111 mpg‑e
30.4 kWh/100 mi; 18.9 kWh/100 km
(1) (3) (4) (5)
Scion iQ EV[61] 2013 121 mpg‑e
27.9 kWh/100 mi; 17.3 kWh/100 km
138 mpg‑e
24.4 kWh/100 mi; 15.2 kWh/100 km
105 mpg‑e
32.1 kWh/100 mi; 19.9 kWh/100 km
(1)
Tesla Model 3 Long Range AWD[62] 2020 121 mpg‑e
27.9 kWh/100 mi; 17.3 kWh/100 km
124 mpg‑e
27.2 kWh/100 mi; 16.9 kWh/100 km
116 mpg‑e
29.1 kWh/100 mi; 18.1 kWh/100 km
(1)
Chevrolet Bolt EV[63] 2017 119 mpg‑e
28.3 kWh/100 mi; 17.6 kWh/100 km
121 mpg‑e
27.9 kWh/100 mi; 17.3 kWh/100 km
110 mpg‑e
30.6 kWh/100 mi; 19.0 kWh/100 km
Chevrolet Spark EV[64] 2014/15/16 119 mpg‑e
28.3 kWh/100 mi; 17.6 kWh/100 km
128 mpg‑e
26.3 kWh/100 mi; 16.4 kWh/100 km
109 mpg‑e
30.9 kWh/100 mi; 19.2 kWh/100 km
(1)
BMW i3 (94 A·h)[59] 2017 118 mpg‑e
28.6 kWh/100 mi; 17.7 kWh/100 km
129 mpg‑e
26.1 kWh/100 mi; 16.2 kWh/100 km
106 mpg‑e
31.8 kWh/100 mi; 19.8 kWh/100 km
(1)
Honda Fit EV[65] 2013/14 118 mpg‑e
28.6 kWh/100 mi; 17.7 kWh/100 km
132 mpg‑e
25.5 kWh/100 mi; 15.9 kWh/100 km
105 mpg‑e
32.1 kWh/100 mi; 19.9 kWh/100 km
(1)
Fiat 500e[66] 2013/14/15 116 mpg‑e
29.1 kWh/100 mi; 18.1 kWh/100 km
122 mpg‑e
27.6 kWh/100 mi; 17.2 kWh/100 km
108 mpg‑e
31.2 kWh/100 mi; 19.4 kWh/100 km
(1)
Volkswagen e-Golf[67] 2015/16 116 mpg‑e
29.1 kWh/100 mi; 18.1 kWh/100 km
126 mpg‑e
26.8 kWh/100 mi; 16.6 kWh/100 km
105 mpg‑e
32.1 kWh/100 mi; 19.9 kWh/100 km
(1)
Nissan Leaf (24 kW-h)[68] 2013/14/15/16 114 mpg‑e
29.6 kWh/100 mi; 18.4 kWh/100 km
126 mpg‑e
26.8 kWh/100 mi; 16.6 kWh/100 km
101 mpg‑e
33.4 kWh/100 mi; 20.7 kWh/100 km
(1) (6)
Mitsubishi i[69] 2012/13/14/16 112 mpg‑e
30.1 kWh/100 mi; 18.7 kWh/100 km
126 mpg‑e
26.8 kWh/100 mi; 16.6 kWh/100 km
99 mpg‑e
34.0 kWh/100 mi; 21.2 kWh/100 km
(1)
Nissan Leaf (30 kW-h)[68] 2016 112 mpg‑e
30.1 kWh/100 mi; 18.7 kWh/100 km
124 mpg‑e
27.2 kWh/100 mi; 16.9 kWh/100 km
101 mpg‑e
33.4 kWh/100 mi; 20.7 kWh/100 km
(1)
Fiat 500e[70] 2016 112 mpg‑e
30.1 kWh/100 mi; 18.7 kWh/100 km
121 mpg‑e
27.9 kWh/100 mi; 17.3 kWh/100 km
103 mpg‑e
32.7 kWh/100 mi; 20.3 kWh/100 km
(1)
Smart electric drive[71] 2013/14/15/16 107 mpg‑e
31.5 kWh/100 mi; 19.6 kWh/100 km
122 mpg‑e
27.6 kWh/100 mi; 17.2 kWh/100 km
93 mpg‑e
36.2 kWh/100 mi; 22.5 kWh/100 km
(1) (7)
Kia Soul EV[72] 2015/16 105 mpg‑e
32.1 kWh/100 mi; 19.9 kWh/100 km
120 mpg‑e
28.1 kWh/100 mi; 17.5 kWh/100 km
92 mpg‑e
36.6 kWh/100 mi; 22.8 kWh/100 km
(1)
Ford Focus Electric[73] 2012/13/14/15/16 105 mpg‑e
32.1 kWh/100 mi; 19.9 kWh/100 km
110 mpg‑e
30.6 kWh/100 mi; 19.0 kWh/100 km
99 mpg‑e
34.0 kWh/100 mi; 21.2 kWh/100 km
(1)
Tesla Model S AWD - 70D[49][74] 2015/16 101 mpg‑e
33.4 kWh/100 mi; 20.7 kWh/100 km
101 mpg‑e
33.4 kWh/100 mi; 20.7 kWh/100 km
102 mpg‑e
33.0 kWh/100 mi; 20.5 kWh/100 km
(1)
Tesla Model S AWD - 85D[49][75] & 90D[49][74] 2015/16 100 mpg‑e
33.7 kWh/100 mi; 20.9 kWh/100 km
95 mpg‑e
35.5 kWh/100 mi; 22.0 kWh/100 km
106 mpg‑e
31.8 kWh/100 mi; 19.8 kWh/100 km
(1) (8)
Tesla Model S (60 kW·h)[49][74] 2014/15/16 95 mpg‑e
35.5 kWh/100 mi; 22.0 kWh/100 km
94 mpg‑e
35.9 kWh/100 mi; 22.3 kWh/100 km
97 mpg‑e
34.7 kWh/100 mi; 21.6 kWh/100 km
(1)
Tesla Model S AWD - P85D[49][75] & P90D[49][74] 2015/16 93 mpg‑e
36.2 kWh/100 mi; 22.5 kWh/100 km
89 mpg‑e
37.9 kWh/100 mi; 23.5 kWh/100 km
98 mpg‑e
34.4 kWh/100 mi; 21.4 kWh/100 km
(1) (8)
Tesla Model X AWD – 90D[76] 2016 92 mpg‑e
36.6 kWh/100 mi; 22.8 kWh/100 km
90 mpg‑e
37.5 kWh/100 mi; 23.3 kWh/100 km
94 mpg‑e
35.9 kWh/100 mi; 22.3 kWh/100 km
(1)
Tesla Model X AWD – P90D[76] 2016 89 mpg‑e
37.9 kWh/100 mi; 23.5 kWh/100 km
89 mpg‑e
37.9 kWh/100 mi; 23.5 kWh/100 km
90 mpg‑e
37.5 kWh/100 mi; 23.3 kWh/100 km
(1)
Tesla Model S (85 kW·h)[77] 2012/13/14/15 89 mpg‑e
37.9 kWh/100 mi; 23.5 kWh/100 km
88 mpg‑e
38.3 kWh/100 mi; 23.8 kWh/100 km
90 mpg‑e
37.5 kWh/100 mi; 23.3 kWh/100 km
(1)
Mercedes-Benz B-Class Electric Drive[78] 2014/15/16 84 mpg‑e
40.1 kWh/100 mi; 24.9 kWh/100 km
85 mpg‑e
39.7 kWh/100 mi; 24.6 kWh/100 km
83 mpg‑e
40.6 kWh/100 mi; 25.2 kWh/100 km
(1)
Toyota RAV4 EV[79] 2012/13/14 76 mpg‑e
44.3 kWh/100 mi; 27.6 kWh/100 km
78 mpg‑e
43.2 kWh/100 mi; 26.9 kWh/100 km
74 mpg‑e
45.5 kWh/100 mi; 28.3 kWh/100 km
(1)
BYD e6[49][80] 2012/13/14/15/16 63 mpg‑e
53.5 kWh/100 mi; 33.2 kWh/100 km
61 mpg‑e
55.3 kWh/100 mi; 34.3 kWh/100 km
65 mpg‑e
51.9 kWh/100 mi; 32.2 kWh/100 km
(1)
Second gen Chevrolet Volt[49][81][82]
Plug-in hybrid (PHEV)
Electricity only
2016 106 mpg‑e
31.8 kWh/100 mi; 19.8 kWh/100 km
113 mpg‑e
29.8 kWh/100 mi; 18.5 kWh/100 km
99 mpg‑e
34.0 kWh/100 mi; 21.2 kWh/100 km
(1) (2) (9)
Volt, Gasoline only 42 mpg 43 mpg 42 mpg
Toyota Prius Eco (4th gen)[53]
Hybrid electric vehicle (HEV)
Gasoline-electric hybrid
2016 56 mpg 58 mpg 53 mpg (2) (10)
Ford Fusion AWD A-S6 2.0L[49][83]
Gasoline-powered
(Average new vehicle)
2016 25 mpg 22 mpg 31 mpg (2) (11)
Notes: All estimated fuel economy based on 15,000 miles (24,000 km) annual driving, 45% highway and 55% city

(1) Conversion 1 gallon of gasoline=33.7 kW·h.
(2) The 2014 i3 REx is classified by EPA as a series plug-in hybrid, while for CARB is a range-extended battery-electric vehicle (BEVx). The i3 REx is the most fuel economic EPA-certified current year vehicle with a gasoline engine with a combined gasoline/electricity rating of 88 mpg-e, but its total range is limited to 150 mi (240 km).[52][84]
(3) The 2014/16 BMW i3 (60 A·h) ranked as the most fuel economic EPA-certified vehicle of all fuel types considered in all years until MY 2016. It was surpassed by the 2017 Hyundai Ioniq Electric in November 2016.[84]
(4) The i3 REx has a combined fuel economy in all-electric mode of 117 mpg-e (29 kW·h/100 mi; 18 kW⋅h/100 km).[85]
(5) The 2016 model year Leaf correspond to the variant with the 24 kW·h battery pack.
(6) Ratings correspond to both convertible and coupe models.
(7) Model with 85 kW·h battery pack
(8) Most fuel economic plug-in hybrid capable of long distance travel. The 2016 Volt has a rating of 77 mpg-e for combined gasoline/electricity operation.[52]
(9) Most fuel economic hybrid electric car.[49][52]
(10) Other 2016 MY cars achieving 25 mpg‑US (9.4 L/100 km; 30 mpg‑imp) combined city/hwy include the Honda Accord A-S6 3.5L, Toyota Camry A-S6 3.5L and Toyota RAV4 A-S6 2.5L.[49][83]


Plug-in hybrids
[edit]

Plug-in hybrid car energy efficiency

Fuel cell vehicles

[edit]

The following table compares EPA's fuel economy expressed in miles per gallon gasoline equivalent (MPGe) for the two models of hydrogen fuel cell vehicles rated by the EPA as of September 2021, and available in California.[86]

Comparison of fuel economy expressed in MPGe for hydrogen fuel cell vehicles

available for sale or lease in California and rated by the U.S. Environmental Protection Agency as of September 2021[86]

Vehicle Model year Combined

fuel economy

City

fuel economy

Highway

fuel economy

Range Annual

fuel cost

Hyundai Nexo 2019–2021 61 mpg-e 65 mpg-e 58 mpg-e 380 mi (610 km)
Toyota Mirai 2016–20 66 mpg-e 66 mpg-e 66 mpg-e 312 mi (502 km)
Toyota Mirai 2021 74 mpg-e 76 mpg-e 71 mpg-e 402 mi (647 km)
Notes: One kg of hydrogen is roughly equivalent to one U.S. gallon of gasoline.

Conversion using GGE

[edit]

The same method can be applied to any other alternative fuel vehicle when that vehicle's energy consumption is known. Generally the energy consumption of the vehicle is expressed in units other than W·h/mile, or Btu/mile so additional arithmetic is required to convert to a gasoline gallon equivalent (GGE), using 33.7 kWh / gallon = 114989.17 btu / gallon.[8]

Hydrogen example with GGE

[edit]

The 2008 Honda FCX Clarity is advertised to have a vehicle consumption of 72 mi/kg-H
2
.[87] Hydrogen at atmospheric pressure has an energy density of 120 MJ/kg (113,738 BTU/kg),[88] by converting this energy density to a GGE, it is found that 1.011 kg of hydrogen is needed to meet the equivalent energy of one gallon of gasoline. This conversion factor can now be used to calculate the MPGe for this vehicle.

,

Life cycle assessment

[edit]

Pump/Well-to-wheel

[edit]

EPA's miles per gallon equivalent metric shown in the window sticker does not measure a vehicle's full cycle energy efficiency or well-to-wheel life cycle. Rather, the EPA presents MPGe in the same manner as MPG for conventional internal combustion engine vehicles as displayed in the Monroney sticker, and in both cases the rating only considers the pump-to-wheel or wall-to-wheel energy consumption, i.e. it measures the energy for which the owner usually pays. For EVs the energy cost includes the conversions from AC from the wall used to charge the battery[39] The EPA ratings displayed in window stickers do not account for the energy consumption upstream, which includes the energy or fuel required to generate the electricity or to extract and produce the liquid fuel; the energy losses due to power transmission; or the energy consumed for the transportation of the fuel from the well to the station.[14][40]

Petroleum-equivalency factor (PEF) – a CAFE metric

[edit]

In 2000 the United States Department of Energy (DOE) established the methodology for calculating the petroleum-equivalent fuel economy of electric vehicles based on the well-to-wheel (WTW) gasoline-equivalent energy content of electricity (). The methodology considers the upstream efficiency of the processes involved in the two fuel cycles, and considers the national average electricity generation and transmission efficiencies because a battery electric vehicle burns its fuel (mainly fossil fuels) off-board at the power generation plant.[14] This methodology is used by carmakers to estimate credits into their overall Corporate Average Fuel Economy (CAFE) for manufacturing electric drive vehicles.[13]

The petroleum equivalent fuel economy of electric vehicles is determined by the following equations:[14]

where:
= Petroleum-equivalent fuel economy
= Gasoline-equivalent energy content of electricity factor
= "Fuel content" factor or incentive factor. DoE selected a value of 10.15 to retain consistency with existing regulatory and statutory procedures, and to provide a similar treatment to manufacturers of all types of alternative fuel vehicles[89]
= Petroleum-fueled accessory factor; this is equal to 1 if the electric drive vehicle does not have petroleum-powered accessories installed, and 0.90 if it does.
= Driving pattern factor; this is equal to 1, as DoE considered that electric vehicles eligible for inclusion in CAFE will offer capabilities, perhaps excepting driving range, similar to those of conventional vehicles.

The gasoline-equivalent energy content of electricity factor, abbreviated as , is defined as:

where:
= U.S. average fossil-fuel electricity generation efficiency = 0.328[90]
= U.S. average electricity transmission efficiency = 0.924[90]
= Petroleum refining and distribution efficiency = 0.830[90]
= Watt hours of energy per gallon of gasoline conversion factor = 33,705 Wh/US gal (115,006 BTU/US gal)[90]

is computed as:

This computation accounts for the well-to-wall losses resulting from the extraction of crude oil and refinement into gasoline (Tp), conversion to electricity (Tg), and the transmission grid (Tt); in summary, the total amount of useful electrical energy that can be extracted from gasoline is just 36.5% of its total theoretical stored energy.[90] Substituting the numerical values into the first equation,

As noted above, when and are 1, as they would be for a pure-electric vehicle, .

Examples

In the example provided by the US DoE in its final rule, an electric car with an energy consumption of 265 Watt hour per mile in urban driving, and 220 Watt hour per mile in highway driving, results in a petroleum-equivalent fuel economy of 335.24 miles per gallon, based on a driving schedule factor of 55 percent urban, and 45 percent highway, and using a petroleum equivalency factor of 82,049 Watt hours per gallon.[14]

In 2009, the Monroney sticker for the Mini E rated the wall-to-wheel energy consumption at 33 / 36 kWh/100 mi (102.1 / 93.6 mpg‑e) for the city and highway driving cycles, respectively.[90] The petroleum-equivalent fuel economy is 239 MPGPE, assuming a 55%/45% urban/highway split.

For comparison, the 2017 Chevrolet Bolt EV has a rated (wall-to-wheel) consumption of 128 / 110 mpg‑e (263 / 306 Wh/mi) listed on the Monroney sticker for the urban/highway driving cycles, respectively.[63] The petroleum-equivalent fuel economy for the Bolt, using the DoE rule to consider well-to-wall energy losses, is 284 MPGPE, computed using the same 55%/45% urban/highway split.

See also

[edit]

Notes

[edit]

References

[edit]
[edit]
Revisions and contributorsEdit on WikipediaRead on Wikipedia
from Grokipedia
Miles per gallon gasoline equivalent (MPGe) is a metric developed by the U.S. Environmental Protection Agency (EPA) to quantify the energy efficiency of electric vehicles (EVs), plug-in hybrid electric vehicles (PHEVs), and other alternative fuel vehicles by expressing their performance in terms equivalent to the distance traveled on one gallon of gasoline. The measure equates 33.7 kilowatt-hours (kWh) of electricity—derived from the lower heating value of gasoline at approximately 33,705 British thermal units (BTU) per gallon converted to electrical units—to one gallon of gasoline, allowing direct comparison with conventional internal combustion engine vehicles' miles per gallon (MPG). MPGe ratings appear on EPA-mandated Monroney labels for qualifying vehicles, reflecting combined city and highway driving cycles tested under standardized laboratory conditions that emphasize onboard energy consumption from the battery or fuel cell. For model year 2024 EVs, efficiencies range from 53 to 140 MPGe, highlighting variability based on vehicle design, aerodynamics, and drivetrain efficiency. While MPGe facilitates consumer comparisons by normalizing disparate energy sources to a familiar gasoline benchmark, it has drawn criticism for representing only "tank-to-wheel" or "battery-to-wheel" efficiency, excluding upstream losses in , transmission, and distribution, which can reduce effective well-to-wheel efficiency by factors of 2-3 depending on the grid's reliance. This omission, rooted in the metric's focus on vehicle-level performance rather than full lifecycle energy use, has led some analysts to argue it inflates the apparent superiority of EVs over vehicles, potentially misleading policymakers and buyers on total energy costs and emissions impacts. Despite these limitations, MPGe remains the standard for federal fuel reporting and incentives, underscoring its role in promoting alternative technologies amid debates over comprehensive .

Definition and Purpose

Core Concept of MPGe

Miles per gallon gasoline equivalent (MPGe) is a unit of measurement developed by the United States Environmental Protection Agency (EPA) to express the fuel efficiency of vehicles powered by electricity, hydrogen, or other alternative fuels in terms equivalent to the miles traveled per gallon of gasoline. It standardizes comparisons by converting the energy consumed from non-liquid fuels into the equivalent volume of gasoline based on energy content, where one gallon of gasoline contains approximately 33.7 kilowatt-hours (kWh) of energy. This metric focuses solely on the vehicle's onboard energy use and efficiency, excluding upstream production losses such as those in electricity generation or fuel refining. The core calculation for battery electric vehicles derives MPGe by dividing the distance traveled by the energy equivalent of one gallon of gasoline divided by the actual energy consumed. Specifically, for an electric vehicle, MPGe equals 33,700 watt-hours (Wh) per gallon divided by the vehicle's energy consumption in Wh per mile, yielding a value that reflects how many miles the vehicle can travel on the energy in one gallon of gasoline. For example, a vehicle consuming 34 Wh per mile achieves approximately 99 MPGe (33,700 / 34 ≈ 99). In laboratory testing, separate city, highway, and combined MPGe values are determined using standardized drive cycles, analogous to traditional MPG testing for gasoline vehicles. For electric vehicles, applies to the electric-only mode, while mode uses standard ; combined ratings may blend both depending on assumed electric driving share. This equivalence enables direct efficiency comparisons across powertrains but assumes equal energy value regardless of source, potentially overstating real-world advantages if grid electricity includes inefficiencies not captured in the metric. The EPA adopted in for labeling to inform consumers, with values displayed on Monroney stickers for vehicles.

Intended Role in Vehicle Efficiency Comparisons

Miles per gallon gasoline equivalent (MPGe) is designed by the U.S. Environmental Protection Agency (EPA) to enable direct comparisons of energy efficiency between vehicles using , alternative fuels, or hybrid powertrains and those powered by conventional engines. By expressing efficiency in terms equivalent to miles traveled per gallon of , MPGe translates the of non-liquid fuels into a familiar metric, facilitating consumer understanding and cross-technology evaluation. This standardization addresses the limitation of traditional miles per gallon (MPG), which applies only to liquid fuels, by basing calculations on the energy content of —approximately 33.7 kilowatt-hours (kWh) per U.S. . For electric s (EVs), MPGe reflects the distance traveled per equivalent of energy drawn from the , incorporating charging inefficiencies typically around 85-90%. Thus, a rated at 100 MPGe achieves the same distance on 33.7 kWh of (after charging losses) as a does on one of fuel at 100 MPG. In practice, MPGe appears on EPA fuel economy labels for plug-in electric vehicles and hybrids, alongside estimated ranges and costs, to aid purchasing decisions by quantifying efficiency gains from electric —often 2-3 times higher than gasoline counterparts due to superior efficiency. For model year 2024 EVs, combined MPGe ratings range from 53 to 140, compared to 9-57 for vehicles including hybrids, underscoring the metric's role in highlighting relative . MPGe also informs regulatory compliance, such as (CAFE) standards, where vehicles' contributions are calculated using equivalent values to promote fleet-wide efficiency improvements without penalizing diverse technologies. However, as a vehicle-centric measure, it focuses on tank-to-wheel or wall-to-wheel efficiency, excluding upstream production losses like grid generation or fuel refining, which EPA documentation specifies as outside its comparative scope to emphasize end-use performance.

Historical Development

Origins in Alternative Fuels Legislation (1988–1994)

The Alternative Motor Fuels Act of 1988 (AMFA), enacted as Public Law 100-494 on October 14, 1988, established initial federal incentives for automobile manufacturers to produce vehicles capable of operating on alternative fuels such as , , and , aiming to reduce dependence on imported petroleum. To facilitate compliance with (CAFE) standards under the of 1975, AMFA directed the Environmental Protection Agency (EPA) and (NHTSA) to develop special fuel economy calculation methods for alternative fuel vehicles (AFVs). These methods involved deriving a petroleum-equivalent fuel economy value, which adjusted the measured miles per gallon of the alternative fuel based on its lower energy content relative to gasoline, thereby allowing manufacturers to earn CAFE credits as if the vehicles achieved comparable or enhanced efficiency in gasoline terms. Under AMFA's provisions, effective for 1993, dedicated AFVs—those designed solely for s—received CAFE credits by multiplying their actual alternative fuel efficiency (in miles per gallon equivalent) by factors escalating from 0.90 in 1993 to 1.2 by 2004, effectively deeming them to meet or exceed standards on an energy-equivalent basis. This equivalence was computed using the (Btu) content of the fuels, with standardized at approximately 114,000–125,000 Btu per , to normalize comparisons and incentivize production despite the volumetric inefficiencies of fuels like (about 64,000 Btu per ). Dual-fueled vehicles, capable of running on either alternative fuels or , were credited with the higher of their two fuel economy values for CAFE averaging, further boosting manufacturer incentives. The legislation required biennial reports to on AFV performance and market impacts, highlighting early challenges such as limited refueling and higher costs, but emphasizing the equivalence metric's role in policy-driven diversification. By 1994, these calculations gained further standardization with the National Institute of Standards and Technology (NIST) defining the gasoline gallon equivalent (GGE) for compressed natural gas as 5.660 pounds, equivalent to one gallon of gasoline's energy content, to support consistent measurement across fuels in commerce and efficiency ratings. This built directly on AMFA's framework, enabling more precise CAFE crediting for natural gas vehicles and laying conceptual groundwork for broader application to non-liquid fuels, though implementation remained limited to a few thousand AFVs annually due to technological and economic barriers. The period's developments prioritized empirical energy content data over unsubstantiated environmental claims, focusing on verifiable Btu equivalences to avoid distorting actual vehicle performance metrics.

Refinement for Non-Petroleum Fuels (2000–2007)

In June 2000, the U.S. Department of Energy (DOE) revised its regulations under the Electric and , Development, and Demonstration Program to establish a petroleum-equivalency factor (PEF) and standardized procedures for calculating the petroleum-equivalent fuel economy of electric vehicles (EVs), addressing the need for consistent measurement of non-petroleum in federal programs like (CAFE). This refinement built on earlier legislative mandates by incorporating empirical adjustments for real-world energy conversion inefficiencies, ensuring the metric reflected the petroleum displacement potential of electricity-powered vehicles without assuming grid generation sources. The updated PEF formula was defined as PEF=Eg×10.15×AF×DPFPEF = E_g \times \frac{1}{0.15} \times AF \times DPF, where EgE_g represented the adjusted gasoline-equivalent energy content (calculated as 12,307 watt-hours per gallon using factors for transmission efficiency Tg=0.328T_g = 0.328, torque converter efficiency Tt=0.924T_t = 0.924, and pumping efficiency Tp=0.830T_p = 0.830, derived from the base gasoline energy of 33,705 watt-hours per gallon); 10.15\frac{1}{0.15} was the fuel content factor accounting for an assumed average internal combustion engine thermal efficiency of 15 percent; AFAF was the accessory factor (1.00 for vehicles without petroleum-powered accessories, or 0.90 otherwise); and DPFDPF was the driving pattern factor (set at 1.00). This yielded PEF values of 82,049 watt-hours per gallon for EVs without petroleum accessories and 73,844 watt-hours per gallon with them, enabling fuel economy calculations as PEFcombined energy consumption (watt-hours per mile)\frac{PEF}{\text{combined energy consumption (watt-hours per mile)}}. The adjustments prioritized causal energy pathways, emphasizing delivered propulsion energy over raw input, to incentivize EV adoption while aligning with statutory goals under 49 U.S.C. § 32905 for alternative fuel equivalence. These changes simplified prior ad hoc methods, promoting uniformity in CAFE compliance for dedicated EVs using electricity as a non-petroleum fuel, though the metric did not extend formally to hybrid systems or other alternatives like hydrogen until later frameworks. No substantive revisions to the PEF occurred through , as the formula's empirical basis—rooted in laboratory-derived efficiencies and national energy data—remained stable amid limited commercial EV deployment. Critics noted the fixed 15 percent efficiency assumption underrepresented variability in engine performance, potentially overstating EV equivalence in petroleum savings, but DOE justified it via aggregate fleet data to avoid overcomplication.

Standardization and EPA Adoption (2010–Present)

The U.S. Environmental Protection Agency (EPA) first implemented the miles per gallon gasoline equivalent (MPGe) metric on consumer fuel economy labels in November 2010 for model year 2011 vehicles, marking its debut on the and . This introduction coincided with the proposal for revisions to motor vehicle fuel economy labels, published in the on September 23, 2010, which aimed to provide comparable efficiency metrics for alternative fuel vehicles alongside traditional models. The MPGe calculation standardized the energy content of one gallon of at 33,705 watt-hours, enabling direct equivalence for , , and other fuels in terms of miles traveled per unit energy. A final rule issued on May 25, 2011, formalized the label requirements, mandating MPGe display for electric vehicles (EVs), plug-in hybrid electric vehicles (PHEVs), and fuel cell vehicles starting with 2012, while extending redesigned labels to all new vehicles to include annual fuel cost estimates and ratings. This adoption standardized MPGe as the primary consumer-facing efficiency measure for non-petroleum vehicles, derived from EPA's laboratory 2-cycle (city/highway) testing protocols adjusted for charging losses in EVs and PHEVs, typically assuming 85-90% grid-to-battery efficiency. By integrating MPGe into the , the EPA facilitated cross-fuel comparisons, though the metric's fixed energy equivalence has drawn scrutiny for not accounting for variable upstream production efficiencies in versus . From 2011 onward, MPGe ratings proliferated as EV and PHEV adoption grew, with the EPA applying the metric consistently across types, including hydrogen fuel cell models using gasoline gallon equivalents (GGE) where one kg of equates to approximately 1.011 gallons of . Updates to related methodologies persisted; notably, the U.S. Department of Energy revised the petroleum equivalency factor (PEF) in March 2024, which influences CAFE compliance calculations for alternative fuels but remains distinct from the fixed 33.7 kWh/gallon basis for MPGe labels. This distinction underscores MPGe's role as a static benchmark rather than a dynamic regulatory tool, with EPA maintaining the original to prioritize simplicity in comparisons despite evolving dynamics.

Calculation and Methodology

Energy Content Equivalence

The energy content equivalence in miles per gallon gasoline equivalent (MPGe) standardizes the comparison of vehicle efficiency across fuel types by converting the energy delivered from alternative sources into the equivalent volume of based on lower heating values. For used in battery electric and vehicles, the U.S. Environmental Protection Agency (EPA) defines 33.7 kilowatt-hours (kWh), or 33,705 watt-hours (Wh), as the electrical equivalent to one U.S. of . This factor originates from the approximate lower heating value of at 115,000 British thermal units (BTU) per , where 1 kWh equals 3,412 BTU, yielding the standardized conversion without adjustments for production or transmission losses in this baseline metric. In the MPGe formula for electric vehicles, efficiency is computed as MPGe=33,705Wh/gallonEM\text{MPGe} = \frac{33{,}705 \, \text{Wh/gallon}}{E_M}, where EME_M represents the vehicle's in Wh per mile under standardized conditions, often incorporating factors for motor efficiency (EME_M) and other elements (EEE_E). This approach equates the propulsion energy, enabling direct numerical comparison to conventional gasoline vehicles' miles per (MPG), though it assumes parity in end-use energy without embedding upstream petroleum equivalency adjustments used in regulatory compliance like (CAFE) standards. For instance, an consuming 300 Wh per mile achieves approximately 112 MPGe (33,705/30011233{,}705 / 300 \approx 112), highlighting superior efficiency typical of electric motors over internal combustion engines. For hydrogen fuel cell vehicles, equivalence relies on the gasoline gallon equivalent (GGE), where the U.S. Department of Energy sets 1 GGE as approximately 1.011 kilograms of hydrogen based on energy content matching one gallon of gasoline's 33.7 kWh. Thus, MPGe is derived as MPGe=(miles per kg of H2)×1.011\text{MPGe} = (\text{miles per kg of H}_2) \times 1.011, converting hydrogen's mass-based efficiency to a gasoline volume proxy; a vehicle achieving 72 miles per kg yields about 72.8 MPGe. This method similarly prioritizes delivered energy equivalence, though hydrogen's lower volumetric density requires larger storage compared to gasoline.

Laboratory Testing Protocols

The U.S. Environmental Protection Agency (EPA) determines MPGe ratings through standardized testing, where vehicles are restrained on rollers mimicking road resistance, including aerodynamic drag, tire , and losses, while a human driver follows precise speed-time traces projected on a screen to replicate driving patterns. These tests occur in controlled laboratory environments at facilities like the National Vehicle and Fuel Emissions Laboratory, ensuring and isolation from external variables such as or traffic. For electric vehicles (EVs) and plug-in hybrid electric vehicles (PHEVs), protocols emphasize measuring onboard —typically in kilowatt-hours (kWh) drawn from the battery—rather than liquid fuel volume, with electricity delivery simulated via onboard chargers or metering. EVs undergo testing per SAE J1634 procedures, adapted by the EPA, starting with a full charge followed by a multi-cycle test (MCT) comprising repeated Urban Driving Schedule (UDDS) cycles for city simulation until the battery reaches a 2% threshold or cannot sustain further operation, quantifying total AC or DC energy use in watt-hours per mile. Highway testing employs the Highway Fuel Economy Driving Schedule (HFEDS), with constant-speed segments at 48.3 mph (77.8 km/h) and soaks between cycles to mimic idling. Where MCT proves infeasible due to battery capacity limits, a single-cycle test (SCT) may be approved, focusing on one UDDS with adjustments for range projection. Additional cycles, such as the US06 high-speed test or SC03 air-conditioning test, contribute to the optional 5-cycle for refined estimates, particularly for labeling, by incorporating aggressive , high speeds, and accessory loads. Cold-start procedures at 20°F (-6.7°C) for 2025 and later include two UDDS cycles with a 10-minute soak, requiring manufacturer . PHEVs follow SAE J1711 protocols, dividing tests into charge-depleting (CD) mode—prioritizing electric propulsion until battery depletion—and charge-sustaining (CS) mode, where the maintains battery levels akin to conventional testing. CD phases use the 4-bag Federal Test Procedure (FTP, encompassing UDDS cold-start and transient segments) and HFET for city and highway, respectively, tracking both (in kWh) and (in gallons) consumed until a net energy change threshold of 1% or fuel ratio stabilization. CS mode employs standard FTP and HFET without battery recharge, treating the vehicle as a conventional hybrid. factors—empirical weights reflecting typical electric range usage (e.g., from Table 1 in SAE J1711 for compliance)—blend CD and CS results, with EPA adjustments for labeling to account for real-world charging frequency. All tests incorporate key-off soaks (e.g., 15 seconds between UDDS and HFEDS) and preconditioning runs to stabilize vehicle systems. Combined MPGe derives from 55% city and 45% weighting of raw test , with a 0.7 adjustment factor applied to projected ranges for EVs to reflect in-use degradation from factors like battery aging and non-ideal conditions, though this multiplier has drawn for understating lab-derived efficiencies relative to empirical . Protocols prioritize , with logged via and post-processing per 40 CFR Part 600, ensuring MPGe reflects energy efficiency under controlled, repeatable conditions rather than variable consumer behaviors.

Adjustments for Electricity and Charging Inefficiencies

The calculation of miles per gallon gasoline equivalent (MPGe) for battery electric vehicles (BEVs) and the electric-only mode of electric vehicles (PHEVs) incorporates adjustments for charging inefficiencies by basing energy consumption on the (AC) drawn from the utility outlet, rather than the (DC) energy delivered to the battery. This method accounts for conversion losses in the electric vehicle supply equipment (EVSE), charging cable, and the vehicle's onboard charger, which typically range from 85% to 95% under standard conditions. EPA laboratory testing protocols specify Level 2 AC charging—delivering 240 volts at up to 19.2 kW—for these measurements, reflecting common residential and public slow-charging practices that minimize heat buildup and optimize efficiency. The AC input energy is recorded over standardized drive cycles (city, highway, and combined), capturing real-time losses during recharge for the subsequent driving distance. MPGe is then derived by equating 1 U.S. gallon of gasoline to 33.7 kWh of electricity and applying the formula: MPGe = (33.7 kWh/gal × 100 miles) / (AC kWh/100 miles). For instance, a vehicle consuming 30 AC kWh per 100 miles yields approximately 112 MPGe. These adjustments ensure MPGe provides a wall-to-wheels metric comparable to the tank-to-wheels basis for vehicles, excluding upstream grid transmission or generation losses, which are handled via separate factors like the Petroleum Equivalency Factor in regulatory standards. In practice, onboard charger losses average 10-15% due to rectification and , while EVSE and cable losses add another 2-5%, varying with ambient , voltage stability, and battery preconditioning. DC fast charging, which often skips the onboard charger for higher direct DC input, exhibits lower losses (around 5-10%) but is not used in EPA labeling to prioritize everyday AC scenarios; real-world data from fleet studies show lab-derived adjustments hold within 5-10% variance under varied conditions.

Applications Across Vehicle Types

Pure Electric Vehicles

Pure electric vehicles, or battery electric vehicles (BEVs), operate exclusively on electricity drawn from rechargeable batteries, powering electric motors without any onboard combustion or liquid fuel storage. The miles per gallon gasoline equivalent (MPGe) metric standardizes their efficiency by equating the electrical energy consumed to the energy content of gasoline, enabling direct comparisons with gasoline-powered vehicles. This measure reflects the distance traveled per unit of energy input from the wall outlet, incorporating drivetrain efficiency advantages—typically 85-95% for electric motors versus 20-35% for internal combustion engines—but excluding upstream generation and transmission losses. The U.S. Environmental Protection Agency (EPA) determines MPGe for BEVs through testing on city and highway cycles, mirroring those for conventional vehicles, with a combined rating weighted 55% city and 45% highway to approximate mixed driving. is measured in kilowatt-hours per 100 miles (kWh/100 mi) from the AC wall input, accounting for charging losses of approximately 10-15% due to onboard converter inefficiencies. MPGe is then calculated as 3,370.5 divided by the kWh/100 mi figure, where 3,370.5 derives from the 33.705 kWh energy content of one U.S. of scaled to 100 miles. For example, a BEV consuming 25 kWh/100 mi yields 135 MPGe (3,370.5 / 25 = 134.82, rounded). This wall-to-wheels approach highlights BEV efficiency at the vehicle level but does not adjust for varying grid carbon intensities or dependencies in electricity production. As of 2025, EPA-rated combined MPGe for production BEVs typically ranges from 90 to 140, with aerodynamically efficient sedans achieving the upper end due to lower consumption rates. The 2024 Pure, for instance, rates at 137 MPGe combined, corresponding to about 24.6 kWh/100 mi, benefiting from its low-drag design and optimized battery management. In contrast, heavier SUVs like the 2024 Long Range register around 117 MPGe, or 29 kWh/100 mi, reflecting trade-offs in utility and efficiency. These figures stem from conditions and may overestimate real-world performance by 10-30% due to factors like , speed, and auxiliary loads not fully captured in tests. labels display city, highway, and combined MPGe alongside estimated range, derived similarly from total usable battery capacity adjusted for the test cycle's effective utilization (often 60-70% of nominal capacity).
Model YearVehicle ModelCombined MPGekWh/100 mi (approx.)
2024Lucid Air Pure13724.6
202514024.1
2024Tesla Model 3 Long Range13225.5
Such ratings underscore BEVs' potential for high equivalence efficiencies, though actual consumer outcomes vary with charging habits and infrastructure.

Plug-in Hybrid Electric Vehicles

Plug-in hybrid electric vehicles (PHEVs) utilize MPGe to quantify efficiency during charge-depleting (CD) operation, where the battery powers propulsion primarily, with gasoline used supplementally until depletion, followed by charge-sustaining (CS) hybrid mode. The U.S. Environmental Protection Agency (EPA) calculates CD MPGe by measuring consumption in kilowatt-hours (kWh) over standardized and test cycles, converting it to gasoline-equivalent gallons using 33.705 kWh per gallon, then deriving miles per equivalent gallon. This yields separate and MPGe values, with a combined figure weighted 55% and 45% . For overall labeling, EPA reports a combined MPGe that integrates both CD and CS modes via a utility factor (UF), estimating the electric driving fraction based on all-electric range (AER) and average U.S. trip distances from national surveys. The UF, derived from EPA-adapted SAE J1711 methodology, weights electric energy use (converted to equivalent gallons) against gasoline consumed in CS mode; for instance, a PHEV with 20-mile AER typically has a UF around 0.48, blending modes accordingly. Gasoline-only MPG in CS mode is tested separately post-depletion, akin to conventional hybrids, and displayed alongside MPGe on labels to distinguish modes. Testing involves dynamometer cycles depleting the battery over multiple UDDS/FTP-75 city and HWFET highway simulations, recording kWh from the wall (including charger losses, assumed at 85-90% ) and gasoline use. The , an early PHEV, achieved EPA ratings of 106 MPGe city and 98 combined in its 2011 model year, reflecting 35-mile AER and CS MPG of 42. Recent models, like the 2025 Prime, rate up to 127 MPGe in CD mode with 44-mile AER, underscoring MPGe's role in comparing PHEV to vehicles despite upstream grid dependencies not captured in the metric.

Fuel Cell and Hydrogen Vehicles

Fuel cell electric vehicles (FCEVs) employ fuel cells to convert gas into electricity, which powers electric motors, bypassing mechanical combustion. The U.S. Environmental Protection Agency (EPA) applies MPGe ratings to FCEVs by equating consumption to gasoline gallon equivalents (GGE), where 1 kilogram of corresponds to 1 GGE due to their comparable energy contents of approximately 33 kWh per unit. This tank-to-wheel metric measures efficiency from hydrogen storage tank to road output, incorporating conversion losses (typically 40-60% efficient) and drivetrain efficiencies, analogous to MPG but normalized to energy. EPA testing for FCEVs follows protocols under the city and highway cycles, quantifying hydrogen mass used in per 100 miles, then inverting to miles per and scaling by the GGE factor (approximately 1 kg per GGE, or precisely 1.011 kg per for parity). The resulting MPGe thus reflects real-world drivability factors like and , with combined ratings derived as a weighted 55% city and 45% highway. For example, a consumption of 1.35 kg per 100 miles yields about 74 MPGe (100 miles / 1.35 kg ≈ 74 miles per GGE). The 2025 Toyota Limited achieves EPA-rated 76 city, 71 highway, and 74 combined, enabling a 402-mile range from its 5.6 kg at station pressures of 700 bar. These figures underscore FCEVs' advantages in refueling speed (3-5 minutes) and cold-weather performance over battery electrics, though excludes upstream factors like electrolysis efficiency (often 60-70% for ) or reforming losses (from , predominant in current supply). Empirical data indicate FCEV tank-to-wheel efficiencies of 25-35%, yielding values 2-3 times higher than average vehicles (around 25 ), but full-system analyses reveal higher penalties from production and compression.

Regulatory and Policy Integration

Role in CAFE Standards

The (CAFE) standards, administered by the (NHTSA), mandate fleet-average fuel economy targets for passenger cars and light trucks to reduce petroleum consumption. For battery electric vehicles (BEVs) and electric vehicles (PHEVs), which operate without direct use, compliance relies on petroleum-equivalent fuel economy calculations derived from the same EPA laboratory test cycles used to determine MPGe. These tests measure electricity consumption in kilowatt-hours per 100 miles (kWh/100 mi), providing the baseline efficiency data that MPGe standardizes against gasoline's energy content of 33.7 kWh per gallon. In CAFE, this consumption data is converted to equivalent miles per gallon (mpg) by applying the Petroleum Equivalency Factor (PEF), which estimates the petroleum displaced per unit of electricity based on national averages for electricity generation, transmission, and distribution efficiency. The formula yields CAFE values substantially exceeding EPA MPGe; for instance, a BEV with 100 MPGe (implying ~33.7 kWh/100 mi consumption) achieves roughly 244 mpg under the 2023 PEF of 82,034 watt-hours per gallon equivalent, as the PEF incorporates broader system factors beyond tank-to-wheel efficiency. This multiplier—historically 6.67 for electricity under earlier fuel content adjustments, now embedded in PEF—grants outsized compliance credits, allowing one EV to offset multiple less-efficient internal combustion engine vehicles in a manufacturer's fleet average. Such credits, authorized by the Energy Policy Act of 1992 (42 U.S.C. § 13257) and refined in subsequent rules, incentivize alternative-fuel vehicle production to meet CAFE targets, which reached projected fleet averages of 50.4 mpg by model year 2031 under NHTSA's June final rule for 2027–2031. For PHEVs, CAFE blends electric-mode MPGe-derived values with gasoline mpg, weighted by utility factor (electric driving share), further amplifying credits during charge-depleting operation. Critics, including analyses from the Department of Energy, argue this overcredits EVs relative to actual displacement, as U.S. is only ~0.6% -derived in 2023, potentially distorting investment away from efficiency gains in conventional fleets. NHTSA's 2023 proposal to recalibrate PEF for grid decarbonization aimed to halve EV credits but was not adopted in the final rule amid ongoing litigation.

Petroleum-Equivalency Factor

The Petroleum-Equivalency Factor (PEF) is a conversion value promulgated by the U.S. Department of Energy (DOE) and applied by the Environmental Protection Agency (EPA) to determine the petroleum-equivalent fuel economy of electric vehicles (EVs) under the National Highway Traffic Safety Administration's (NHTSA) (CAFE) standards. It enables the averaging of EV performance with that of (ICE) vehicles by expressing EV use in watt-hours per mile (Wh/mi) as an equivalent miles per gallon (mpg) of gasoline, using the formula: petroleum-equivalent mpg = PEF / (vehicle Wh/mi). This factor originated from congressional mandates in the of 1975, as amended, to promote petroleum displacement through alternative fuels, incorporating a statutory that deems alternative fuels to constitute only 15% of a vehicle's energy use for CAFE purposes. The PEF is calculated annually by DOE as the product of the average content of (E_g, approximately 33,705 Wh per U.S. ), a content factor (FCF) that embeds the 0.15 statutory petroleum-use assumption (effectively multiplying base equivalency by about 6.67), an accessory factor (AF, typically near 1.0 to account for non-drive accessories), and a driving pattern factor (DPF, also near 1.0 to reflect urban-rural driving mixes). For EVs without petroleum-powered accessories, recent PEF values have hovered around 80,000–82,000 Wh/; for (MY) 2024–2026 vehicles, it stands at 81,518 Wh/, decreasing to 79,989 Wh/ for MY 2027 and 78,478 Wh/ for MY 2028 onward under DOE's March 2024 final rule, which adjusted for updated content and eliminated certain prior incentives to align more closely with actual petroleum savings. These values result in EVs receiving CAFE credits equivalent to 200–300+ for vehicles with real-world akin to 30–50 -equivalent , amplifying manufacturer compliance credits beyond tank-to-wheel efficiency. In practice, the PEF's structure, particularly the FCF's embedded multiplier, has drawn scrutiny for overstating EV contributions to fleet-average fuel economy relative to their direct energy displacement of , as it assumes a fixed 85% "non-" credit regardless of upstream sources or grid decarbonization levels. DOE updates the PEF through rulemaking under 10 CFR Part 474, with values applied prospectively to new model years; for instance, the revision reduced the factor from prior levels (e.g., 82,049 Wh/ in earlier years) to reflect rising trends, thereby tightening CAFE stringency for EV-heavy fleets. This factor does not directly influence EPA's consumer-facing MPGe labels, which use a fixed 33,705 Wh/ without incentives, but it shapes and potential civil penalties or credits under CAFE.

Influence on Fleet Averaging and Incentives

The U.S. Environmental Protection Agency (EPA) incorporates miles per gallon gasoline equivalent (MPGe) ratings into () compliance through the Department of 's (DOE) Petroleum Equivalency Factor (PEF), which converts (EV) electricity consumption into petroleum-equivalent gallons for fleet-wide averaging. This enables manufacturers to count EVs and plug-in hybrids toward their required fleet average fuel economy, where an EV's effective CAFE value is derived by dividing the PEF (in watt-hours per gallon) by the vehicle's consumption (in watt-hours per mile), often yielding credits exceeding 200 equivalent prior to adjustments. For instance, under the pre-2024 PEF of 82,049 Wh/gallon, a () consuming 30 kWh/100 miles equated to approximately 273 in CAFE calculations, allowing a single EV sale to offset multiple lower-efficiency () vehicles in a manufacturer's compliance ledger. In March 2024, DOE finalized a PEF reduction to 33,705 Wh/ (aligning more closely with gasoline's raw content) by eliminating the prior Fuel Content Factor (FCF) multiplier, which had inflated credits to reflect assumed displacement from grid electricity; this change lowers EV CAFE equivalents to levels nearer their tank-to-wheel MPGe, reducing the credit per vehicle by roughly a factor of 2.4 and compelling manufacturers to produce more EVs or improve efficiencies to meet standards projected at 50.4 fleet-wide by 2031. Such adjustments aim to curb over-crediting, but critics contend the historical system subsidized EV production as a compliance shortcut, enabling sales of heavier, less efficient trucks and SUVs—U.S. light-duty fleet composition shifted to 80% SUVs/pickups by 2023—while distorting investment away from broad efficiency gains. MPGe also shapes manufacturer incentives beyond direct CAFE credits, as higher ratings enhance eligibility for state rebates and influence corporate strategies for averaging. For example, 's Vehicle Exchange Colorado program awards a $1,000 bonus rebate for EVs or plug-in hybrids with combined MPGe of 117 or greater, tiering incentives to favor more models. Federally, while the Section 30D clean vehicle tax credit (up to $7,500 through September 2025) bases eligibility on battery capacity, final assembly, and critical minerals rather than MPGe, the metric indirectly bolsters EV marketability by signaling superior in EPA labels, aiding sales volumes that generate CAFE credits. This interplay has driven EV market share from under 2% in 2019 to over 7% in 2023, though empirical analyses indicate CAFE's EV credits contributed more to fleet compliance than equivalent ICE improvements. In July 2025, eliminated civil penalties for CAFE shortfalls (previously $5 to $17 per 0.1 mpg deficit per vehicle), potentially diminishing MPGe's regulatory leverage but preserving its role in voluntary averaging and state incentives.

Criticisms and Empirical Limitations

Discrepancies Between Lab MPGe and Real-World Performance

The U.S. Environmental Protection Agency (EPA) derives MPGe ratings from laboratory tests simulating standardized city (UDDS) and highway (HWFET) cycles at controlled speeds averaging 21 mph and 48 mph, respectively, with ambient temperatures between 20°F and 80°F and minimal auxiliary loads. These conditions yield optimistic efficiency figures by excluding real-world stressors like prolonged high speeds above 65 mph, where aerodynamic drag increases quadratically, or rapid acceleration that demands peak power draws from the battery. Consequently, electric vehicles (EVs) exhibit greater sensitivity to such variables than gasoline vehicles, whose internal combustion engines maintain relatively stable efficiency across broader operating envelopes. Extreme temperatures amplify discrepancies, particularly cold weather, which impairs performance through reduced electrochemical reaction rates and higher , often cutting range by 20-40% below 32°F without preconditioning. Heat also degrades efficiency via accelerated accessory use for cooling, though less severely than cold. Driving behaviors, including aggressive throttling and stop-and-go , further elevate beyond lab assumptions, as do terrain variations and payload that the EPA tests standardize or omit. Empirical testing reveals consistent underperformance: ' highway evaluations of 30 EVs showed over half falling short of EPA range estimates, with real-world consumption averaging 15-25% higher than lab metrics. Car and Driver's and on-road tests across dozens of models found EVs achieving roughly 67% of EPA-rated range at sustained speeds, versus gasoline cars exceeding estimates by 4% on average, underscoring EVs' heightened vulnerability to non-ideal conditions. Edmunds' comparative data for models like the 2022 and similarly documented 10-30% efficiency shortfalls in mixed real-world driving, translating to proportionally lower effective MPGe since the metric scales directly with miles per unit of input. These lab-to-road gaps persist despite EPA adjustments post-2017 incorporating faster acceleration and effects, as real-world data from fleet and user logs indicate average EV efficiency ratios of 0.7-0.8 relative to lab baselines, influenced by regional climate and variances. For plug-in hybrids, discrepancies compound with variable electric-gasoline blending under non-optimal charging access, often yielding real-world MPGe 15-20% below combined EPA figures in studies aggregating millions of miles.

Failure to Account for Upstream Energy Losses

The MPGe metric for electric vehicles equates vehicle propulsion efficiency to the energy content of 33.7 kilowatt-hours of delivered via the wall charger, incorporating charging inefficiencies but excluding losses prior to grid delivery. This wall-to-wheel approach yields ratings often exceeding 100 MPGe for many models, implying a direct equivalence to vehicles without adjusting for the required to generate that . Electricity generation incurs substantial thermal losses, with average power plant efficiencies ranging from 33% for to 60% for modern combined-cycle units, resulting in an overall grid of approximately 38-42% when weighted by mix. Additional transmission and distribution losses average 5-7% nationally, further reducing delivered relative to primary inputs like , , or other burned at plants. In contrast, gasoline's upstream process recovers about 85-90% of crude oil's content into pump-delivered , but MPGe treats the as a fixed reference without parallel adjustment for electricity's upstream conversion penalties. Well-to-wheel analyses using models like Argonne National Laboratory's GREET reveal that incorporating these upstream losses significantly lowers effective efficiency equivalents; for instance, EVs averaging 100-150 MPGe on labels translate to roughly 45 MPGe when accounting for U.S. average electricity production and delivery losses. This discrepancy arises because MPGe emphasizes downstream performance, overlooking that consumption for an EV may approach or exceed that of a comparable under fossil-heavy grid conditions, where overall well-to-wheel efficiency for EVs hovers around 25-35% versus 17-28% for internal combustion engines. Such omissions can inflate perceived resource savings, as evidenced by federal discussions favoring lifecycle metrics that include upstream energy for more accurate equivalency calculations. The metric's structure thus privileges electric drivetrains' high tank-to-wheel efficiencies (typically 80-90%) while sidelining causal factors like grid decarbonization status, which determine true primary energy advantages—nuclear or renewable-heavy grids mitigate losses, but coal- or gas-dominant ones amplify them. Empirical data from GREET simulations confirm that without upstream adjustments, MPGe risks overstating efficiency gains by a factor of 2-3 relative to total system energy use, potentially distorting comparisons in regulatory contexts like fuel economy standards.

Potential for Misleading Consumers and Policy Distortions

The MPGe metric has been criticized for overstating the effective efficiency of electric vehicles by equating wall-socket consumption to the raw energy content of (approximately 33.7 kWh per gallon), without accounting for upstream losses in power generation, transmission, and distribution. For instance, the U.S. Department of Energy (DOE) estimates that about 64% of energy is lost at power plants alone when generating from fuels, with additional losses in transmission (around 5-7%) and charging (typically 10-15%), reducing the effective equivalence substantially. This omission leads consumers to perceive EVs as far more efficient than comparable vehicles; the 2011 Leaf's EPA-rated 99 e, for example, implies nearly three times the efficiency of a 35 MPG gas , but DOE-adjusted figures drop it to around 36 MPGe, akin to a hybrid or . Such inflated ratings distort consumer decision-making by fostering misconceptions about total use and operating costs, as MPGe does not incorporate variability in grid carbon intensity or , which can render EV cost-per-mile advantages negligible in regions reliant on or . Critics argue this encourages purchases based on lab-derived labels rather than real-world factors like home charging infrastructure or seasonal efficiency drops, potentially leading to when actual range and refueling economics underperform expectations. For plug-in hybrids, the distortion is acute, as blended MPGe figures suggest implausibly high miles per actual gallon of used, conflating electric-only operation with overall fuel savings in a way that misrepresents blended-mode realities. In policy contexts, MPGe contributes to distortions by enabling automakers to inflate fleet-wide fuel economy averages under (CAFE) standards through EV production credits, where electric portions are attributed disproportionately high equivalent MPG values (often exceeding 200 MPGe for pure EVs). This incentivizes a shift toward EVs over potentially more cost-effective alternatives like advanced hybrids, which DOE analyses indicate can achieve comparable reductions in dependence without relying on grid-dependent . For example, the Ford F-150 Lightning's 237.7 MPGe rating contrasts sharply with a DOE-adjusted 67.1 MPGe, exaggerating compliance benefits and supporting aggressive mandates—such as the EPA's projection for EVs to comprise 67% of new sales by 2032—despite evidence that upstream inefficiencies limit net energy and emissions gains in coal-heavy grids. These mechanics have prompted DOE proposals in 2023 to revise MPGe calculations for stricter alignment with real-world energy inputs, aiming to curb regulatory favoritism that prioritizes volume sales of electrified vehicles over holistic efficiency improvements across the fleet.

Life Cycle and Full-System Assessments

Well-to-Wheel Versus Tank-to-Wheel Analysis

Tank-to-wheel (TTW) analysis evaluates the efficiency of converting stored energy in a vehicle's fuel tank or battery into propulsion at the wheels, focusing solely on onboard processes such as engine or motor performance, drivetrain losses, and accessories. This approach isolates vehicle operation but omits upstream energy inputs. Well-to-wheel (WTW) analysis extends TTW by incorporating well-to-tank (WTT) stages, including raw resource extraction, fuel processing, , and distribution, providing a fuller accounting of use and associated losses. In the context of miles per gallon gasoline equivalent (MPGe), the U.S. Environmental Protection Agency employs a TTW-equivalent methodology: for battery electric vehicles (BEVs), it bases ratings on wall-to-wheel consumption (electricity drawn at the charger to wheels), equating delivered kWh to gasoline's lower heating value of 33.7 kWh per gallon without factoring WTT losses for grid electricity. Gasoline vehicles' MPG ratings similarly reflect TTW efficiency. This delivered-energy equivalence yields MPGe values 3-4 times higher for EVs than comparable gasoline MPG, mirroring the TTW efficiency disparity—EVs achieve 75-90% drivetrain efficiency versus 20-30% for internal combustion engines (ICEs). WTW reveals moderated differences due to divergent WTT profiles. WTT efficiency stands at 80-85%, reflecting high recovery in crude extraction (95-98%) and (85-90%), yielding overall WTW efficiencies of 16-25% for light-duty ICEs. For BEVs, U.S. grid WTT averages 35-40%, constrained by power plant efficiencies of approximately 43% (up from 33% historically, driven by combined-cycle plants at 50-60%) and 5-6% transmission/distribution losses, resulting in WTW efficiencies of 25-35%. Thus, use per mile for EVs exceeds TTW implications but remains 20-50% lower than ICEs under average U.S. conditions. Argonne National Laboratory's , a peer-reviewed lifecycle tool, quantifies these via pathway-specific simulations: for a conventional ICE, WTW use is about 1.2-1.5 MJ/km, versus 0.8-1.2 MJ/km equivalent for BEVs on the 2020s U.S. grid mix (improving with renewables). Regional variations amplify disparities—coal-heavy grids reduce EV WTW to 20-25%, while hydro/nuclear dominance boosts it to 40-50%. TTW's omission of such upstream variability can thus inflate EV claims relative to holistic assessments, though empirical WTW data affirm EVs' net superiority over ICEs in most deployed scenarios.

Comparative Efficiency with Gasoline Vehicles

Well-to-wheel (WTW) efficiency comparisons between electric vehicles (EVs) and internal combustion engine vehicles (ICEVs) incorporate upstream energy losses from primary fuel extraction and conversion through to at the wheels, revealing a narrower advantage for EVs than tank-to-wheel metrics like MPGe suggest. For ICEVs, WTW typically ranges from 11% to 27%, reflecting approximately 15-20% losses in crude oil extraction, , and distribution, combined with tank-to-wheel conversion efficiencies of 20-30% in modern engines. Diesel ICEVs achieve higher ranges of 25-37% under optimal conditions due to better thermodynamic , while vehicles fall between 12-22%. EVs demonstrate WTW efficiencies of 20-40% or higher, depending on the electricity generation mix, as their tank-to-wheel efficiency reaches 77-82% (accounting for 90% charging efficiency and 85-90% motor and drivetrain losses), but this is moderated by upstream grid losses. In the U.S., where the average grid thermal efficiency for fossil and nuclear sources hovered around 38% in recent years (improving to over 50% for combined-cycle natural gas plants), overall EV WTW efficiency approximates 25-30%, surpassing average gasoline ICEVs by 30-50%. The Argonne National Laboratory's GREET model confirms that EV powertrains are nearly three times more efficient than ICE counterparts in energy conversion at the vehicle level, though full WTW gains diminish with coal-heavy grids (e.g., below 20% efficiency in some regions) and amplify with renewables, where solar or wind-sourced electricity can yield near 70% WTW efficiency after transmission losses.
Fuel/Vehicle TypeWell-to-Tank EfficiencyTank-to-Wheel EfficiencyApproximate WTW Efficiency (U.S. Average Grid)
Gasoline ICEV80-85%20-25%16-21%
Diesel ICEV85-90%30-40%25-37%
Battery EV (Fossil Grid)35-45% (generation + transmission)77-82%25-30%
Battery EV (Renewable Grid)80-95%77-82%60-75%
This table derives from GREET modeling and EPA analyses, highlighting how EV advantages stem from centralized, higher-efficiency generation offsetting distributed ICE losses, though real-world variability—such as 10-20% additional losses from EV charging infrastructure or grid congestion—can reduce the gap. In scenarios with high renewable penetration, as in parts of or by 2023, EVs achieve 2-3 times the WTW energy use efficiency of gasoline ICEVs, but fossil-dependent grids yield parity or slight EV edges only for high-efficiency models exceeding 30 gasoline equivalent. Empirical data from the National Renewable Energy Laboratory (NREL) underscore that U.S. EVs emit 64% fewer greenhouse gases on a WTW basis than comparable gasoline vehicles, correlating directly with superior energy efficiency under current grid conditions. Critically, MPGe's reliance on delivered electrical energy (33.7 kWh per ) overstates EV efficiency by excluding upstream grid conversion losses, which can equal or exceed ICEV refining inefficiencies in dirty grids; thus, WTW metrics reveal that gasoline hybrids often match or outperform pure EVs in use where derives primarily from or gas. However, as U.S. grid decarbonization progresses— with renewable share rising from 20% in 2020 to over 25% by 2024—EVs' WTW superiority strengthens, potentially reaching 50% or more efficiency gains by 2030 per GREET projections.

Environmental and Economic Trade-offs

The use of MPGe in evaluating electric vehicles (EVs) highlights potential through apparent gains, as it equates the energy content of to without accounting for upstream generation losses, which can constitute 60-70% of total input in fossil fuel-based grids. Lifecycle assessments indicate that battery EVs typically emit 50-70% fewer gases over their full lifecycle compared to comparable vehicles (ICEVs) when charged on the average U.S. grid as of 2023, due to higher despite upstream emissions from power plants. However, this advantage diminishes in coal-dominant regions like parts of the Midwest, where EVs may achieve only marginal or negative reductions relative to efficient hybrids until grid decarbonization advances further, underscoring MPGe's limitation in promoting uniform policy incentives without regional adjustments. Battery manufacturing introduces significant upfront environmental trade-offs, with production emissions equivalent to 10,000-30,000 miles of ICEV driving, driven by energy-intensive mining of , , and , which also entails disruption and water usage in supply chains concentrated in geopolitically sensitive areas. While these impacts are amortized over longer EV lifespans and offset by operational savings, MPGe obscures them by focusing solely on propulsion energy, potentially understating risks if EV adoption scales rapidly without advancements or alternative chemistries. Full-system analyses reveal additional trade-offs, such as increased demand straining grids and necessitating fossil backups during peak times, which could elevate system-wide emissions absent sufficient renewable integration. Economically, MPGe facilitates comparisons that often portray EVs as superior in "fuel" efficiency, correlating with lower per-mile operating costs—typically $0.03-0.05 for versus $0.10-0.15 for in 2023 U.S. averages—but fails to reflect variability in , which lacks the market signals of tied to global supply. This metric influences incentives like CAFE credits, subsidizing EV production and sales to the tune of billions in federal credits as of 2024, yet overlooks elevated upfront costs (20-50% higher than ICEVs) and battery replacement expenses exceeding $10,000 after 8-10 years, potentially leading to higher total ownership costs for short-trip urban users. Infrastructure demands, including $50-100 billion in projected U.S. charging network expansions by 2030, represent another , as MPGe-driven policies may accelerate investments without fully internalizing grid upgrade expenses or the opportunity costs of charging time, distorting consumer decisions toward vehicles with mismatched utility profiles.

Alternatives and Potential Reforms

Direct Metrics Like kWh/100 Miles

Kilowatt-hours per 100 miles (kWh/100 mi) quantifies the (AC) electricity consumed from the wall outlet to propel an (EV) over 100 miles, encompassing charging inefficiencies, losses, and accessory loads. The U.S. Environmental Protection Agency (EPA) derives this metric through laboratory tests replicating city and highway cycles, where energy draw from a simulated grid is measured until the battery depletes, then extrapolated. Lower kWh/100 mi values signify superior , as they reflect less needed per distance; for example, a rating of 25 kWh/100 mi implies the vehicle converts energy more effectively than one at 35 kWh/100 mi. This direct measure contrasts with MPGe by eschewing conversion to gasoline equivalents, enabling precise inter-EV comparisons and user-specific cost projections using regional tariffs—typically $0.10–$0.20 per kWh—without invoking 's 33.7 kWh thermal content. EV owners often favor miles per kWh (the inverse) for intuitiveness, as it mirrors MPG's distance-per-unit-fuel tailored to . In EPA Monroney labels, kWh/100 mi appears alongside MPGe, but advocates for regulatory reform contend prioritizing the former mitigates consumer confusion over EVs' ostensibly tripled efficiency versus vehicles, which overlooks upstream grid and production disparities. EPA ratings for 2024–2025 models illustrate variability: the Pure leads at 23 kWh/100 mi combined, followed by the at 24 kWh/100 mi, while larger SUVs like the trail at around 47 kWh/100 mi. These figures stem from standardized 2-cycle (city/highway) testing, though real-world conditions—such as cold weather or high speeds—can increase consumption by 20–50%, underscoring the metric's tank-to-wheel (or wall-to-wheel) focus excluding upstream emissions or losses.
ModelCombined kWh/100 miSource
Lucid Air Pure (2024)23
Hyundai Ioniq 6 (2024)24
Tesla Model 3 (2024)25–27
Rivian R1S (2024)47
Reform proposals, including those from energy analysts, suggest elevating kWh/100 mi in federal standards and labeling to foster transparent policy incentives, as it aligns with causal energy use rather than abstracted equivalents prone to distortion in fleet averaging. Such shifts could compel manufacturers to optimize hardware directly, unburdened by MPGe's implicit subsidies for battery-heavy designs.

Cost-Per-Mile Equivalents


Cost-per-mile equivalents translate vehicle energy efficiency into direct monetary terms, enabling comparisons based on actual consumer expenditures rather than standardized energy content as in MPGe. For gasoline vehicles, the cost per mile is calculated as the price per gallon divided by miles per gallon (). For electric vehicles (EVs), it is the electricity price per (kWh) multiplied by kWh consumed per mile, often derived from efficiency ratings like MPGe where kWh per 100 miles equals 33,705 divided by MPGe. This metric fluctuates with local fuel and electricity prices but provides a practical gauge of operating expenses.
To derive a cost-equivalent MPG for EVs, divide the gasoline price per gallon by the EV's cost per mile, yielding the gasoline MPG that would match the EV's fuel cost. For instance, with an average U.S. gasoline price of $3.25 per gallon in 2025 and an EV cost of $0.05 per mile, the equivalent MPG is 65, meaning the EV costs the same per mile as a gasoline vehicle achieving 65 MPG. In contrast, a typical gasoline sedan at 25 MPG incurs about $0.13 per mile at that price, roughly 2.6 times the EV rate. These figures vary by region; for example, national averages in 2025 show EVs at approximately 5 cents per mile versus 11-13 cents for gasoline sedans. U.S. Environmental Protection Agency (EPA) fuel economy labels incorporate estimated annual fuel costs assuming 15,000 miles driven yearly, with projected national average prices such as $2.70 per gallon for gasoline and $0.13 per kWh for electricity as of recent models. This allows derivation of cost per mile by dividing annual cost by mileage, though actual rates differ by utility and state taxes. Proponents of cost-per-mile metrics argue they better inform purchasing decisions by reflecting economic reality over abstract energy equivalents, potentially reducing policy distortions from MPGe's fixed assumptions. However, these calculations typically use retail prices and exclude upstream generation losses or incentives, which may understate full-system costs.
Vehicle TypeAverage Cost per Mile (2025 U.S.)Equivalent MPG at $3.25/gal GasSource
Sedan (25 MPG)$0.1325[web:19]
EV (avg. efficiency)$0.0565[web:19][web:25]
Such equivalents highlight EVs' cost advantages under current pricing but underscore the need for localized data, as rates range from $0.10 to over $0.20 per kWh across states. Reforms could mandate cost-per-mile disclosures on labels alongside MPGe to enhance transparency.

Calls for Revised Standards Post-2020

Critics of the miles per gallon gasoline equivalent (MPGe) metric have intensified calls since 2021 for revisions to federal standards, arguing that the Agency's (EPA) methodology fails to incorporate upstream energy losses in and transmission, thereby overstating (EV) efficiency relative to gasoline counterparts. The EPA's MPGe calculation equates one gallon of gasoline to 33.7 kilowatt-hours (kWh) of at the point of use, assuming near-perfect conversion without deducting typical grid inefficiencies, where approximately 64% of energy is lost at power plants according to EPA data from October 2024. This omission, proponents of reform contend, creates a misleading equivalence, as real-world EV energy consumption must account for average U.S. of around 36% for , which dominate the grid mix. Specific examples illustrate the disparity: the 2011 Leaf's EPA-rated 99 MPGe drops to an estimated 36 MPGe when adjusted using Department of Energy (DOE) methods that factor in generation losses and fuel sourcing, while the Ford F-150 Lightning's 237.7 MPGe falls to 67.1 MPGe under similar adjustments, potentially overstating efficiency by up to sevenfold compared to internal combustion engines. Automotive analyst Lauren Fix, citing these gaps, has advocated adopting the DOE's more comprehensive approach for MPGe labels to reflect actual displacement and grid realities, rather than idealized tank-to-wheel metrics. Such reforms, she argues, would prevent deception and policy distortions, with alternatives like the EPA's Beyond Tailpipe Emissions Calculator proposed as transparent supplements. These criticisms gained traction amid post-2020 EV market data showing real-world performance often trailing lab estimates due to factors like battery degradation and charging losses. Legal challenges have further spotlighted the need for revised standards. In March 2024, the DOE finalized a rule to gradually phase down the equivalency factor (PEF) used in (CAFE) calculations—a multiplier historically boosting EV credits by approximately 6.67 times based on assumed efficiencies—which aimed to align credits more closely with actual petroleum savings as the grid evolves. However, on September 5, 2025, the U.S. of Appeals for the 8th Circuit vacated the rule, ruling that the DOE lacked statutory authority under the to implement such adjustments, effectively reverting to the prior formula. The decision, stemming from a by states including , underscored systemic flaws in equivalency metrics and prompted renewed advocacy from industry groups like the American Chamber for statutory reforms to ensure calculations prioritize empirical grid over regulatory assumptions, avoiding inflated credits that subsidize EVs at the expense of accurate efficiency comparisons.

References

Add your contribution
Related Hubs
User Avatar
No comments yet.