
Community hub
Recent from talks
Contribute something
Nothing was collected or created yet.
Solar minimum
View on Wikipedia
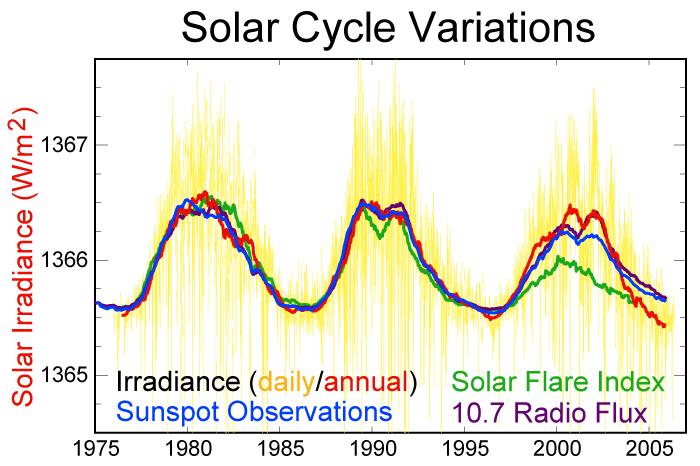
Solar minimum is the regular period of least solar activity in the Sun's 11-year solar cycle. During solar minimum, sunspot and solar flare activity diminishes, and often does not occur for days at a time. On average, the solar cycle takes about 11 years to go from one solar minimum to the next, with duration observed varying from 9 to 14 years. The date of the minimum is described by a smoothed average over 12 months of sunspot activity, so identifying the date of the solar minimum usually can only happen 6 months after the minimum takes place.
Solar minimum is contrasted with the solar maximum, when hundreds of sunspots may occur.
Solar minimum and solar maximum
[edit]Solar minima and maxima are the two extremes of the Sun's 11-year and 400-year activity cycle.[1] At a maximum, the Sun is peppered with sunspots, solar flares erupt, and the Sun hurls billion-ton clouds of electrified gas into space. Sky watchers may see more auroras, and space agencies must monitor radiation storms for astronaut protection. Power outages, satellite malfunctions, communication disruptions, and GPS receiver malfunctions are just a few of the things that can happen during a solar maximum.[2]
At a solar minimum, there are fewer sunspots and solar flares subside. Sometimes, days or weeks go by without a spot.
Predicting solar minimum cycles
[edit]Their non-linear character makes predictions of solar activity very difficult.[3] The solar minimum is characterized by a period of decreased solar activity with few, if any, sunspots. Scientists from the National Center for Atmospheric Research (NCAR) also developed a computer model of solar dynamics (Solar dynamo) for more accurate predictions and have confidence in the forecast based upon a series of test runs with the newly developed model simulating the strength of the past eight solar cycles with more than 98% accuracy.[4] In hindsight the prediction proved to be wildly inaccurate and not representative of the observed sunspot numbers.[5]
During 2008–09 NASA scientists noted that the Sun is undergoing a "deep solar minimum," stating: "There were no sunspots observed on 266 of [2008's] 366 days (73%). Prompted by these numbers, some observers suggested that the solar cycle had hit bottom in 2008. Sunspot counts for 2009 dropped even lower. As of September 14, 2009 there were no sunspots on 206 of the year's 257 days (80%). Solar physicist Dean Pesnell of the Goddard Space Flight Center came to the following conclusion: "We're experiencing a very deep solar minimum." His statement was confirmed by other specialists in the field. "This is the quietest sun we've seen in almost a century," agreed sunspot expert David Hathaway of the National Space Science and Technology Center NASA/Marshall Space Flight Center.[6] However, the activity is still at a higher level than at a grand solar minimum.
Grand solar minima and maxima
[edit]Grand solar minima occur when several solar cycles exhibit lesser than average activity for decades or centuries. Solar cycles still occur during these grand solar minimum periods but are at a lower intensity than usual. The grand minima form a special mode of the solar dynamo operation.[7]

| Event | Start | End |
|---|---|---|
| Homeric Minimum[8] | 950 BC | 800 BC |
| Roman Warm Period | 250 BC | AD 400 |
| Medieval maximum 1 (see Medieval Warm Period) | 950 | 1040 |
| Oort minimum (see Medieval Warm Period) | 1040 | 1080 |
| Medieval maximum 2 (see Medieval Warm Period) | 1100 | 1250 |
| Wolf minimum | 1280 | 1350 |
| Spörer Minimum | 1450 | 1550 |
| Maunder Minimum | 1645 | 1715 |
| Dalton Minimum | 1790 | 1820 |
| Modern Maximum | 1914 | 2008 |
A list of historical Grand minima of solar activity[9] includes also Grand minima ca. 690 AD, 360 BC, 770 BC, 1390 BC, 2860 BC, 3340 BC, 3500 BC, 3630 BC, 3940 BC, 4230 BC, 4330 BC, 5260 BC, 5460 BC, 5620 BC, 5710 BC, 5990 BC, 6220 BC, 6400 BC, 7040 BC, 7310 BC, 7520 BC, 8220 BC, 9170 BC.
See also
[edit]References
[edit]- ^ Moussas, X.; Polygiannakis, J. M.; Preka-Papadema, P.; Exarhos, G. (2005). "Solar cycles: A tutorial". Advances in Space Research. 35 (5): 725–738. Bibcode:2005AdSpR..35..725M. doi:10.1016/j.asr.2005.03.148.
- ^ "NOAA Space Weather Scales Page Has Changed". noaa.gov.
- ^ Petrovay, Kristof (2010). "Solar Cycle Prediction". Living Reviews in Solar Physics. 7 (1): 6. arXiv:1012.5513. Bibcode:2010LRSP....7....6P. doi:10.12942/lrsp-2010-6. PMC 4841181. PMID 27194963.
- ^ "Scientists Issue Unprecedented Forecast of Next Sunspot Cycle – News Release". ucar.edu. Archived from the original on 2006-04-10.
- ^ "Sunspot Number graphics". oma.be.
- ^ "Deep Solar Minimum – NASA Science". nasa.gov. Archived from the original on 2009-04-01.
- ^ C.-J. Wu; I. G. Usoskin; N. Krivova; G.A. Kovaltsov; M. Baroni; E. Bard; S.K. Solanki (2018). "Solar activity over nine millennia: A consistent multi-proxy reconstruction". Astronomy and Astrophysics. 615: A93. arXiv:1804.01302. Bibcode:2018A&A...615A..93W. doi:10.1051/0004-6361/201731892. S2CID 119376474.
- ^ Celia Martin-Puertas; Katja Matthes; Achim Brauer; Raimund Muscheler; Felicitas Hansen; et al. (April 2, 2012). "Regional atmospheric circulation shifts induced by a grand solar minimum". Nature Geoscience. 5 (6): 397–401. Bibcode:2012NatGe...5..397M. doi:10.1038/ngeo1460.
- ^ Usoskin, Ilya G.; Solanki, Sami K.; Kovaltsov, Gennady A. (2007). "Grand minima and maxima of solar activity: new observational constraints" (PDF). Astron. Astrophys. 471 (1): 301–9. arXiv:0706.0385. Bibcode:2007A&A...471..301U. doi:10.1051/0004-6361:20077704. S2CID 7742132.
External links
[edit]- Solar Cycle 25 peaking around 2022 could be one of the weakest in centuries
- New Insights on How Solar Minimums Affect Earth (NASA June 14, 2011)
Solar minimum
View on GrokipediaDefinition and Characteristics
Definition
A solar minimum refers to the phase in the Sun's approximately 11-year solar cycle when solar activity is at its lowest, characterized by the fewest sunspots and diminished magnetic activity across the photosphere. During this time, the emergence of new sunspots, which are temporary phenomena driven by intense magnetic fields piercing the solar surface, is minimal, leading to a relatively calm state for solar phenomena such as flares and coronal mass ejections. This phase typically lasts several years on average, representing the trough in the cyclical variation of solar output. The Sun's global magnetic dipole reaches a state of relative stability with strong polar fields, though overall magnetic complexity and sunspot-related activity are reduced; the full polarity reversal of the magnetic field occurs earlier in the cycle near solar maximum, establishing the configuration observed at minimum. Total solar irradiance, the total energy output from the Sun reaching Earth, decreases by about 0.1% compared to solar maximum, a subtle but measurable variation influencing Earth's upper atmosphere.[10][6] The terminology "solar minimum" originated from 19th-century astronomical observations of recurring patterns in sunspot counts, first systematically documented by German astronomer Samuel Heinrich Schwabe, who identified the roughly 10-year periodicity in sunspot activity through observations spanning 1826 to 1843.[11] This discovery laid the foundation for recognizing the solar cycle's opposing phases: the minimum as the period of quiescence contrasting with the solar maximum, when sunspot numbers peak and activity intensifies.[12]Key Indicators
The International Sunspot Number (ISN), also known as the relative sunspot number , serves as the primary quantitative indicator of solar activity, dropping to very low levels during solar minimum, typically with smoothed values below 10–20. This index is calculated using the formula , where is the number of sunspot groups, is the number of individual sunspots, and is a correction factor for observer standardization. The smoothed sunspot number , used to identify cycle minima and maxima, is derived by averaging the monthly mean sunspot numbers over a 13-month period centered on the target month (i.e., six months before, the month itself, and six months after).[13][14] Other key metrics reflect the diminished solar activity at minimum. Rates of solar flares and coronal mass ejections (CMEs) are markedly low, with flares of C-class or higher and CMEs occurring at much lower rates—typically a few per week on average—compared to rates that can exceed 10 per day at solar maximum.[15][16][17][18][19] The 10.7 cm radio flux index (F10.7), which measures solar emissions at 2800 MHz and correlates with overall activity, typically falls below 70 solar flux units (sfu) during minimum periods. Solar wind parameters also shift, featuring a mix of slow streams (300–400 km/s) from equatorial regions and fast streams (up to 800 km/s) from polar coronal holes, though recent minima like cycle 24 showed overall lower average speeds (~25 km/s below historical norms) and reduced dynamic pressure. A defining magnetic indicator is the polarity of the Sun's global dipole field, which reverses during each solar cycle, transitioning from the configuration at the previous minimum. By the time of solar minimum, the polar magnetic fields have strengthened in the new polarity, reaching near-maximum intensity for that cycle (often 1–2 gauss at the poles), providing a measure of the dipole moment and a predictor of the subsequent cycle's strength. This reversal process, completed around the prior maximum, results in unipolar polar regions at minimum, contrasting with the mixed polarities seen during active phases.[20][21]Solar Cycle Context
Overview of the Solar Cycle
The solar cycle is a periodic variation in the Sun's magnetic activity, primarily driven by the solar dynamo process occurring in the Sun's convective zone. This dynamo arises from the interaction of differential rotation—where the equator rotates faster than the poles—and convective motions that twist and amplify the magnetic field lines through the omega and alpha effects, respectively. As a result, the Sun's magnetic field undergoes cyclic strengthening and weakening, manifesting in observable phenomena such as sunspot formation.[22] The cycle typically spans approximately 11 years, beginning at solar minimum when magnetic activity is at its lowest and progressing through a rising phase of about 4 to 5 years to solar maximum, followed by a longer declining phase of 6 to 7 years back to the next minimum. However, the full magnetic cycle, accounting for the reversal of the Sun's global magnetic polarity that occurs near maximum, extends to about 22 years. This polarity flip ensures that the magnetic configuration repeats only after two sunspot cycles, establishing the foundational rhythm of solar variability. Solar minimum serves as the conventional starting point for each cycle.[23][22] The ~11-year periodicity, known as the Schwabe cycle, was first identified by amateur astronomer Samuel Heinrich Schwabe through systematic sunspot observations conducted from 1826 to 1843, which he published in 1844. Later reconstructions by Johann Rudolf Wolf extended reliable sunspot records back to 1755, confirming the cycle's consistency over centuries. Complementing this, Hale's law, formulated by George Ellery Hale in 1919 based on Zeeman effect measurements of sunspot magnetic fields, describes the systematic polarity patterns in sunspot groups: leading spots in a given hemisphere have the same polarity across a cycle, opposite polarities exist between hemispheres, and these configurations reverse in the subsequent cycle.[24]Comparison to Solar Maximum
The solar minimum represents a period of diminished solar activity compared to the solar maximum, which marks the peak of the 11-year solar cycle. During solar minimum, the Sun exhibits few sunspots, often appearing nearly spotless for extended periods, and the corona appears quiet with minimal bright active regions.[3] In contrast, solar maximum features a high number of sunspots, reaching smoothed monthly counts of up to 285 in historical cycles like Cycle 19, along with frequent solar flares and complex magnetic fields that drive dynamic coronal structures.[25][26][27] The transition between these phases occurs gradually over the solar cycle. The rising phase, from solar minimum to maximum, involves increasing sunspot activity starting at higher latitudes, while the declining phase, from maximum to minimum, sees a reduction in activity as sunspots diminish. Sunspots migrate equatorward throughout the cycle in accordance with Spörer's law, forming bands that spread from mid-latitudes toward the equator, with new cycle activity emerging poleward during the minimum transition.[28] Total solar irradiance (TSI), the amount of solar energy reaching the top of Earth's atmosphere, also varies between these phases, though the change is subtle. At solar minimum, TSI reaches its lowest point, dropping by approximately 0.1% relative to the cycle average, corresponding to about 1 W/m² less energy reaching Earth compared to solar maximum. This small overall cycle variation of ~0.1% underscores the Sun's relative stability despite activity fluctuations.[29][30]Observation and Measurement
Historical Methods
Early observations of solar activity relied on indirect indicators, as direct telescopic viewing was not yet possible. Ancient Chinese astronomers documented what are now interpreted as aurora-like phenomena as early as 977 BCE, providing proxy evidence for periods of varying solar output, including minima characterized by reduced auroral frequency.[31][32] These records, preserved in official histories, highlighted the scarcity of such events during low solar activity phases, offering the earliest glimpses into solar minima through non-optical means.[33] The advent of the telescope in the early 17th century marked a pivotal shift toward direct solar scrutiny. In 1610, Galileo Galilei began systematic observations of the Sun using his newly invented instrument, producing detailed drawings of sunspots that revealed their transient nature and positions across the solar disk.[34] These sketches, made over subsequent years, demonstrated the spots' rotation with the Sun and their disappearance during quieter periods, indirectly signaling the onset of solar minima by the absence of visible activity.[35] Advancements in the 19th century formalized the tracking of solar cycles and minima through persistent sunspot monitoring. In 1843, amateur astronomer Heinrich Schwabe published findings from nearly two decades of observations, identifying a roughly 10-year periodicity in sunspot appearances, which encompassed phases of minima where spot counts approached zero.[36] Building on this, Rudolf Wolf at the Zurich Observatory extended sunspot records backward to 1700 by reconstructing relative sunspot numbers from historical proxy data, including auroral sightings and naked-eye sunspot reports in European and Asian chronicles, enabling the retrospective identification of earlier minima.[37] By the early 20th century, standardized ground-based observations established reliable baselines for detecting solar minima. The Zurich Observatory initiated daily sunspot counts in 1818, compiling systematic data that allowed precise delineation of cycle boundaries through metrics like the Wolf sunspot number.[38] This methodology confirmed the solar minimum of Cycle 15 in August 1913, when the smoothed sunspot number reached a low of 1.5, marking one of the quieter transitions observed up to that era.[39] These historical methods laid the groundwork for later extensions into instrumental monitoring, though they remained limited to visual and proxy techniques until mid-century.[40]Modern Techniques
Modern techniques for observing and monitoring solar minima leverage advanced ground-based and space-based observatories, providing continuous, high-resolution data on solar activity indicators from the late 20th century onward. These methods enable precise tracking of subtle changes in the Sun's interior, atmosphere, and magnetic fields during periods of low activity. Ground-based observatories play a crucial role in helioseismology and radio flux measurements. The Global Oscillation Network Group (GONG), operated by the National Solar Observatory, consists of six identical telescopes distributed worldwide to achieve near-continuous observations of solar oscillations.[41] Launched in 1995, GONG uses Doppler imaging of the photospheric Ni I 6768 Å line to detect p-mode oscillations, allowing helioseismic analysis of the solar interior's structure and dynamics, including meridional flows that weaken during minima.[41] For instance, GONG data have revealed enhanced near-surface shear layers and altered rotation rates at the Cycle 24/25 minimum, providing insights into the depth and timing of activity lulls.[42] Complementing this, radio telescopes have measured the 10.7 cm solar radio flux (F10.7) since February 1947, initially from the Dominion Radio Astrophysical Observatory in Penticton, Canada.[43] This flux, calibrated in solar flux units (sfu), serves as a proxy for solar activity, dropping to baseline levels around 67–70 sfu during minima due to reduced non-thermal emissions from active regions.[18][43] More recent ground-based advancements include the Daniel K. Inouye Solar Telescope (DKIST), operated by the National Science Foundation on Maui, Hawaii, which achieved first light in 2021. As the world's largest solar telescope with a 4-meter aperture, DKIST provides unprecedented resolution (down to 20 km on the solar surface) for imaging sunspots, magnetic fields, and coronal structures during low-activity periods.[44] Its data, including spectropolarimetric observations, have captured detailed views of quiet-Sun magnetism and small-scale dynamics persisting at minima, such as in coordinated studies with space missions as of 2025.[45] Space-based instruments offer uninterrupted, high-fidelity views unaffected by Earth's atmosphere. The Solar and Heliospheric Observatory (SOHO), a joint NASA/ESA mission launched in December 1995, employs the Large Angle and Spectrometric Coronagraph (LASCO) for white-light imaging of the solar corona out to 30 solar radii.[46] During minima, SOHO observations show a simplified coronal structure with prominent polar holes and fewer streamers, contrasting the complex configurations at maximum.[47] Similarly, the Solar Dynamics Observatory (SDO), launched in February 2010, features the Helioseismic and Magnetic Imager (HMI) for line-of-sight and vector magnetograms of the photosphere at 0.5 arcsecond resolution every 45 seconds.[48] HMI data track the evolution of polar magnetic fields and sunspot emergence, revealing weakened global fields and reversed polarities at minima, such as the dipole strength halving from 2014 to 2019.[49] The Parker Solar Probe, launched in August 2018, provides in-situ measurements of solar wind plasma and fields as close as 8.5 solar radii during its orbits.[50] Its first four years, spanning the Cycle 24/25 minimum, captured switchbacks and Alfvénic fluctuations in slow solar wind streams, offering direct evidence of coronal heating mechanisms persisting even in low-activity phases.[51] The ESA/NASA Solar Orbiter, launched in February 2020, complements these by achieving high-latitude orbits up to 30° above the ecliptic by 2029, enabling the first detailed remote-sensing observations of the Sun's polar regions.[52] Instruments like the Polarimetric and Helioseismic Imager (PHI) and the Extreme Ultraviolet Imager (EUI) monitor polar magnetic fields and coronal holes, which are prominent during minima; as of June 2025, it delivered world-first high-resolution images of the south solar pole, revealing orderly magnetic structures key to cycle transitions.[53] Integrating these datasets refines the identification of solar minima through standardized metrics. Official declarations rely on 13-month smoothed international sunspot numbers from the Sunspot Index and Long-term Solar Observations (SILSO) combined with polar field strengths derived from magnetograms, such as those from the Wilcox Solar Observatory or HMI.[54][55] For Cycle 24, the minimum was declared in December 2019, when smoothed sunspot numbers reached 1.8 and polar fields stabilized at approximately ±30 μT after reversal.[56] This multi-indicator approach, corroborated by low F10.7 values around 68 sfu, ensures robust confirmation of cycle transitions.[18]Prediction and Forecasting
Methods for Prediction
Predicting the timing and depth of solar minima relies on a combination of precursor techniques, statistical models, and physics-based simulations that leverage historical solar activity data and physical principles of the solar dynamo. Precursor methods primarily use observables from the preceding solar maximum or cycle to forecast the subsequent minimum. For instance, geomagnetic activity near solar maximum serves as a key indicator for odd-numbered cycles, providing a lead time of up to 16 months for estimating the timing of the next minimum, as higher activity levels correlate with earlier onsets.[57] The polar magnetic field strength, measured since the 1970s near solar minimum, has been refined as a precursor to predict the amplitude of the upcoming cycle.[58] Complementing this, dynamo models such as the Babcock-Leighton framework simulate the generation of poloidal fields from tilted bipolar sunspot regions, enabling predictions of cycle amplitude that indirectly inform minimum depth by modeling the decay phase. Statistical approaches treat solar activity as a time series, using past sunspot records to forecast minima without assuming underlying physics. Auto-regressive integrated moving average (ARIMA) models, for example, analyze monthly sunspot numbers from datasets spanning 1991 to 2017, capturing periodic trends to estimate minimum dates and smoothed values.[59] These models excel in short- to medium-term predictions by fitting parameters to historical cycles, often achieving reliable extrapolations for the timing of minima based on autocorrelation in sunspot data. Machine learning techniques extend this by training on multiple historical cycles, incorporating features like sunspot counts and magnetic indices to reconstruct missing data and forecast solar minima, as demonstrated in Bayesian models applied to cycles from 1700 onward.[60] Physics-based models provide a mechanistic understanding by solving equations governing the solar interior's magnetic evolution. Flux transport dynamo models simulate the advection of magnetic flux by meridional circulation, which transports poloidal fields poleward and toroidal fields equatorward, influencing the duration and intensity of minima. These models incorporate variations in circulation speed to replicate observed cycle irregularities. A foundational equation in these simulations is the magnetic induction equation, simplified for the solar context: where is the magnetic field, includes meridional flow, and is magnetic diffusivity; this describes how flows and diffusion evolve the field leading to cycle minima.[61] Such models have been used to hindcast cycles 15–21 and forecast future minima by assimilating surface observations.[62] Recent advancements as of 2025 include ensemble methods combining multiple models, improving reliability for Cycle 25 predictions.[63]Historical Accuracy and Challenges
The historical accuracy of solar cycle predictions, particularly for minima, has varied significantly, with early efforts often overestimating cycle amplitudes and thus misjudging the depth of subsequent minima. For instance, the NOAA/NASA/ISES panel's prediction for Solar Cycle 22 anticipated a maximum sunspot number of 201, but the observed value was 159, representing an overestimation of approximately 26% that influenced expectations for the preceding minimum's smoothness.[63] Similarly, predictions for Solar Cycle 24 underestimated its weak amplitude (observed maximum of 82 versus a predicted 90), though the timing of its minimum in December 2008 aligned closely with forecasts made in 2007, within about six months. More recently, the minimum marking the start of Solar Cycle 25 was predicted by the 2019 panel to occur around mid-2020, with the actual date in December 2019 falling within roughly one year of that estimate, demonstrating improved timing reliability for recent cycles.[64][63] Forecasting solar minima faces several inherent challenges due to the irregular nature of solar activity. Solar cycle lengths fluctuate between approximately 9 and 14 years, complicating the identification of exact minimum timings and depths, as this variability arises from dynamo processes in the Sun's convection zone.[65] Variations in the meridional flow—the latitudinal circulation of plasma—further disrupt predictions by altering the transport of magnetic flux to the poles, which directly influences the strength and timing of minima; measurements since 1996 have revealed substantial changes, such as a slowdown during Cycle 23 that delayed polar field reversal.[66] Additionally, stochastic elements in sunspot emergence introduce randomness, as active regions emerge unpredictably and contribute flux that can either reinforce or counteract cycle progression, preventing deterministic forecasts even with advanced models.[67] Over time, prediction accuracy has improved through methodological advancements and collaborative efforts. In the 1950s, empirical models based on limited historical data yielded errors up to 50% in amplitude forecasts, but by the Space Age, precursor techniques—such as monitoring polar magnetic fields—reduced typical errors to 10–20% when applied after cycle onset.[63] Ensemble modeling, which combines multiple approaches like surface flux transport and dynamo simulations, has further enhanced reliability; for example, polar field precursors accurately captured the weak Cycle 24 minimum, outperforming climatological averages in ensemble analyses of over 100 predictions.[64] International panels, such as NOAA's Solar Cycle Prediction Panel established in 1989, play a key role by integrating diverse data and issuing consensus forecasts near minima, as seen in their successful timing prediction for Cycle 23's maximum (March 2000 predicted versus April 2000 observed).[63]Historical Solar Minima
Regular Cycle Minima
Regular solar minima mark the low-activity phases within the standard 11-year solar cycle, characterized by minimal sunspot numbers and reduced solar output, observed systematically since the advent of telescopic observations in the mid-18th century. These minima typically feature smoothed international sunspot numbers ranging from 0 to around 13, with an average of approximately 5-10, reflecting periods of subdued magnetic activity on the Sun's surface. The first such minimum, for Solar Cycle 1, occurred in February 1755 with a smoothed sunspot number of 11.2, establishing the baseline for modern solar cycle records.[68] Notable examples illustrate the variability in depth among regular cycle minima. The minimum preceding Solar Cycle 25, reached in December 2019, registered a smoothed sunspot number of 1.8 and included approximately 290 spotless days, marking one of the deeper minima in recent decades, though not as deep as the Cycle 15 low in July 1913, which had a sunspot number of 1.8 and 534 spotless days.[54][69] In contrast, earlier minima showed diverse depths; for instance, the Cycle 16 minimum in August 1923 had a sunspot number of 5.6, representing a relatively shallow low compared to the deeper Cycle 20 minimum in October 1964 with 9.6, though both fell within the typical range for regular cycles.[68] A weakening trend in solar activity has been evident since the 1980s, particularly in Cycles 23 and 24, where maxima sunspot numbers declined from 121 in Cycle 23 to 116 in Cycle 24, accompanied by prolonged and deeper minima indicative of diminishing overall cycle amplitude relative to mid-20th-century peaks.[70] However, Cycle 25 reached a maximum of 160.8 in October 2024, showing a rebound in activity.[25] This pattern contrasts with stronger mid-20th-century cycles but remains within the bounds of regular variability, without transitioning to anomalous grand minima. Note that sunspot number values here follow the revised International Sunspot Number (ISN) series from SIDC, which updated historical records for consistency.[71] Historical sunspot data for regular minima prior to 1755 rely on reconstructions of the Wolf sunspot number series, extended backward using proxy records such as carbon-14 isotopes measured in tree rings, which inversely correlate with solar activity levels. These proxies enable estimation of pre-telescopic minima, confirming the persistence of approximately 11-year cycles over centuries, though with greater uncertainty in early periods.[72]Grand Solar Minima
Grand solar minima represent extended epochs of profoundly suppressed solar magnetic activity, typically spanning multiple decades to over a century, during which sunspot numbers remain exceptionally low—often approaching zero for consecutive years—and the amplitude of the 11-year solar cycle is drastically diminished.[73] These periods arise from disruptions in the solar dynamo process, such as quenching of the alpha effect or pronounced hemispheric asymmetries in magnetic field generation, leading to a weakened global poloidal field and inefficient toroidal field production.[74] Unlike regular cycle minima, which last about one year and feature sunspot numbers near zero only briefly, grand minima exhibit sustained suppression across several cycles, with the solar dipole field's polarity reversals becoming irregular or prolonged.[75] Prominent historical examples include the Spörer Minimum, which persisted from approximately 1460 to 1550 CE—a duration of about 90 years—marked by near-total absence of sunspots and detectable solar cycles in proxy records.[76] The Maunder Minimum followed from 1645 to 1715 CE, lasting roughly 70 years, during which only around 50 sunspots were recorded in total, compared to an expected 40,000–50,000 under normal activity levels; this equates to an average sunspot number of less than 1 per year, confirming its status as a grand minimum through both direct observations and cosmogenic isotope reconstructions.[77] The Dalton Minimum, a milder variant from 1790 to 1830 CE (about 40 years), saw reduced but not absent sunspots, with its cooling associations partly amplified by concurrent volcanic eruptions like Tambora in 1815, which injected aerosols into the atmosphere and enhanced the period's climatic signal beyond solar forcing alone.[78] Key characteristics of grand solar minima include a weakened heliosphere due to diminished solar wind and magnetic output, resulting in elevated galactic cosmic ray fluxes reaching Earth—up to 30–40% higher than during active periods, as evidenced by increased production of isotopes like beryllium-10 in ice cores.[79] Hemispheric asymmetries often play a role, with one solar hemisphere potentially entering a quiescent state while the other maintains residual activity, deviating the large-scale magnetic field from its usual dipolar parity and contributing to dynamo quenching. Spectral analysis of long-term radiocarbon (¹⁴C) records from tree rings reveals that these events recur irregularly, with intervals ranging from 200 to 2000 years, occurring statistically about 3% of the time over the Holocene and clustering in epochs of overall low activity.[80]Effects on Earth
Space Weather Impacts
During solar minima, the reduced solar activity leads to a significant decrease in coronal mass ejections (CMEs), resulting in fewer geomagnetic storms that can disrupt Earth's space environment.[81] This quieter geomagnetic field contributes to a more stable ionosphere, minimizing scintillation effects that interfere with satellite-based navigation and communication systems.[82] Additionally, the lower incidence of storms reduces atmospheric heating in the thermosphere, leading to decreased satellite drag and thereby extending the operational lifetimes of low-Earth orbit satellites.[82] Power grids also benefit from fewer geomagnetically induced currents, which can otherwise cause widespread blackouts during intense solar events.[83] Conversely, solar minima pose radiation risks due to the weakened heliospheric magnetic field, which allows a higher flux of galactic cosmic rays (GCRs) to penetrate deeper into the inner solar system and Earth's magnetosphere.[84] During the deep minimum between Solar Cycles 24 and 25 (2019–2020), GCR intensities reached historically high levels, with fluxes about 10–15% higher than the previous minimum, significantly increasing astronaut radiation exposure and heightening health risks for space missions.[85][86] This elevated GCR flux also raises concerns for high-altitude aviation, particularly on polar routes where passengers and crew face up to 19% higher annual radiation doses during such periods.[85] Auroral activity diminishes markedly during solar minima owing to the weaker solar wind and reduced flux of charged particles interacting with Earth's magnetosphere.[81] The heliospheric current sheet, which separates regions of opposite magnetic polarity in the solar wind, tends to flatten during these phases, altering particle distribution and further suppressing the energetic particle injections needed for vivid auroral displays.[87] As a result, polar light phenomena become less frequent and intense, contrasting with the more dynamic auroral conditions observed near solar maximum.[88]Climatic Influences
During solar minima, the total solar irradiance (TSI) decreases by approximately 0.1% compared to solar maxima, leading to a corresponding global temperature cooling of about 0.1°C.[6] This variation arises primarily from reduced solar activity, such as fewer sunspots and faculae, which modulate the Sun's output over the 11-year cycle. In grand solar minima, these irradiance reductions are amplified, with historical events like the Maunder Minimum (1645–1715) associated with TSI drops of approximately 0.2% and contributing to the onset of the Little Ice Age's cooling phase, though volcanic activity also played a significant role in the debate over primary drivers.[90][91] Such prolonged low-activity periods can sustain cooler conditions for decades, with modeled Northern Hemisphere surface temperatures decreasing by up to 0.6°C during the Maunder event.[91] Beyond direct irradiance, proxy influences during solar minima include increased galactic cosmic ray flux due to weakened solar magnetic fields, which may enhance atmospheric ionization and cloud seeding as proposed in the Svensmark hypothesis, potentially increasing low-level cloud cover and albedo.[92][93] Additionally, reduced ultraviolet (UV) radiation at solar minimum leads to lower stratospheric ozone concentrations by about 2–4% in the mid-to-upper stratosphere, altering radiative heating and influencing the strength and position of jet streams, which can propagate tropospheric circulation changes.[94] Quantitative assessments indicate that a modern grand solar minimum could offset 10–20% of projected anthropogenic warming, reducing global mean surface temperatures by 0.12–0.3°C through 2100 under high-emission scenarios, but this effect remains insufficient to reverse overall warming trends.[95][96] The IPCC AR6 evaluates solar and volcanic forcing's combined net contribution as negligible (–0.02°C since 1750), emphasizing its minor role relative to greenhouse gas increases.[97]Current and Future Perspectives
Solar Cycle 25 Minimum
The Solar Cycle 25 minimum, marking the transition from Solar Cycle 24, was identified as occurring in December 2019 based on smoothed sunspot number data.[98] This period of lowest solar activity was officially recognized by the Solar Influences Data Center (SIDC) in September 2020, confirming the start of the new cycle.[99] The minimum was characterized by exceptionally low sunspot numbers, with a smoothed value of 1.8, and 2019 recording 281 spotless days—77% of the year—reflecting a depth comparable to the weak minimum of Solar Cycle 24.[100] Observations from the Solar Dynamics Observatory (SDO) during this minimum highlighted subdued solar activity, including minimal sunspot formation, reduced coronal mass ejections, and faint extreme ultraviolet emissions indicative of a quiet Sun.[101] The solar wind exhibited low average speeds, typically around 350 km/s, dominated by slow streams from equatorial regions, which contributed to fewer geomagnetic disturbances compared to more active minima. At this time, the Sun's polar magnetic fields were the weakest recorded in the space era, a key indicator of the impending moderate strength of Cycle 25.[102] These characteristics implied a gradual ramp-up for Solar Cycle 25, with initial predictions forecasting a maximum smoothed sunspot number of 115 around July 2025, slightly stronger than Cycle 24 but still within the modern weak cycle trend.[103] However, the cycle exceeded these expectations, reaching a smoothed maximum of 160.9 in October 2024. The polar field reversal, essential for cycle progression, completed in the northern hemisphere by late 2024 and the southern by early 2025. By November 2025, Solar Cycle 25 has passed its maximum, with activity declining but remaining elevated; multiple X-class flares, including several in November 2025, underscore the cycle's stronger-than-predicted evolution.[99][3][104]Prospects for Upcoming Cycles
Forecasts for Solar Cycle 26 indicate that its minimum will occur around 2030–2031, marking the transition from the ongoing Cycle 25.[105] Current observations of polar magnetic fields, which serve as a key precursor for cycle amplitude, suggest that Cycle 26 will exhibit strength similar to the weak-to-moderate Cycle 25, with a predicted maximum sunspot number in the range of 100–140. Secular decline models, accounting for the gradual weakening observed in recent cycles, point to a continued trend of subdued activity, with only a low probability (less than 1%) that Cycle 26 will be weaker than the already diminished Cycle 24.[57] Over longer timescales, the approximately 200-year Suess cycle—often linked to broader modulations like the Gleissberg cycle (60–120 years)—indicates potential for deeper minima as part of natural variability in solar dynamo processes.[106] Cosmogenic isotope reconstructions using 14C from tree rings and 10Be from ice cores reveal that grand minima occur irregularly, with an estimated frequency of about one per millennium; accordingly, the probability of such an event in the 21st century remains low, on the order of 5–10%.[107] These trends underscore the Sun's stochastic behavior, where extended low-activity phases are possible but not imminent based on current proxy data. Emerging research frontiers highlight the role of solar inertial oscillations—global waves driven by the Coriolis force in the convection zone—in modulating cycle amplitudes and differential rotation. These low-frequency modes, with periods comparable to the solar rotation, may influence magnetic field evolution and contribute to variations in total solar irradiance, offering new avenues for refining long-term predictions. Such understanding is critical for space weather planning through 2050, as projections of intensifying cycles in the mid-century could heighten risks to satellites, power infrastructure, and aviation from coronal mass ejections and geomagnetic storms.[108]References
- https://science.[nasa](/page/NASA).gov/science-research/planetary-science/solar-minimum-is-coming/
- https://spaceplace.[nasa](/page/NASA).gov/solar-cycles/
- https://science.[nasa](/page/NASA).gov/sun/sunspots/
- https://science.[nasa](/page/NASA).gov/science-research/planetary-science/08jan_sunclimate/