Hubbry Logo
TreemappingTreemappingMain
Open search
Treemapping
Community hub
Treemapping
logo
8 pages, 0 posts
0 subscribers
Be the first to start a discussion here.
Contribute something
Treemapping
Treemapping
from Wikipedia
Treemap of Singapore's exports by product category, 2012. The Product Exports Treemaps are one of the most recent applications of these kind of visualizations, developed by the Harvard-MIT Observatory of Economic Complexity.

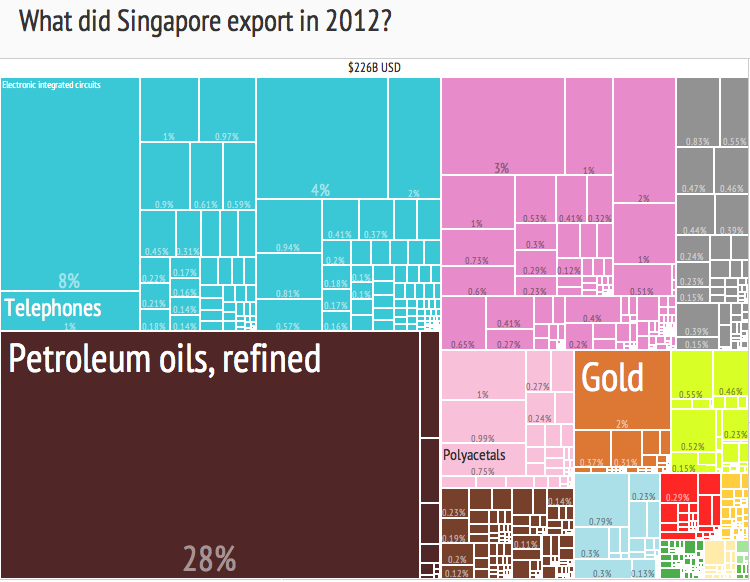
In information visualization and computing, treemapping is a method for displaying hierarchical data using nested figures, usually rectangles.

Treemaps display hierarchical (tree-structured) data as a set of nested rectangles. Each branch of the tree is given a rectangle, which is then tiled with smaller rectangles representing sub-branches. A leaf node's rectangle has an area proportional to a specified dimension of the data.[1] Often the leaf nodes are colored to show a separate dimension of the data.

When the color and size dimensions are correlated in some way with the tree structure, one can often easily see patterns that would be difficult to spot in other ways, such as whether a certain color is particularly prevalent. A second advantage of treemaps is that, by construction, they make efficient use of space. As a result, they can legibly display thousands of items on the screen simultaneously.

Tiling algorithms

[edit]

To create a treemap, one must define a tiling algorithm, that is, a way to divide a region into sub-regions of specified areas. Ideally, a treemap algorithm would create regions that satisfy the following criteria:

  1. A small aspect ratio—ideally close to one. Regions with a small aspect ratio (i.e., fat objects) are easier to perceive.[2]
  2. Preserve some sense of the ordering in the input data (ordered).
  3. Change to reflect changes in the underlying data (high stability).

These properties have an inverse relationship. As the aspect ratio is optimized, the order of placement becomes less predictable. As the order becomes more stable, the aspect ratio is degraded.[example needed]

Rectangular treemaps

[edit]

To date, fifteen primary rectangular treemap algorithms have been developed:

Treemap algorithms[3]
Algorithm Order Aspect ratios Stability
BinaryTree partially ordered high stable
Slice And Dice[4] ordered very high stable
Strip[5] ordered medium medium stability
Pivot by middle[6] ordered medium medium stability
Pivot by split[6] ordered medium low stability
Pivot by size[6] ordered medium medium stability
Split[7] ordered medium medium stability
Spiral[8] ordered medium medium stability
Hilbert[9] ordered medium medium stability
Moore[9] ordered medium medium stability
Squarified[10] ordered low low stability
Mixed Treemaps[11] unordered low medium stability
Approximation[12] unordered low medium stability
Git[13] unordered medium stable
Local moves[14] unordered medium stable

Convex treemaps

[edit]

Rectangular treemaps have the disadvantage that their aspect ratio might be arbitrarily high in the worst case. As a simple example, if the tree root has only two children, one with weight and one with weight , then the aspect ratio of the smaller child will be , which can be arbitrarily high. To cope with this problem, several algorithms have been proposed that use regions that are general convex polygons, not necessarily rectangular.

Convex treemaps were developed in several steps, each step improved the upper bound on the aspect ratio. The bounds are given as a function of - the total number of nodes in the tree, and - the total depth of the tree.

  1. Onak and Sidiropoulos[15] proved an upper bound of .
  2. De-Berg and Onak and Sidiropoulos[16] improve the upper bound to , and prove a lower bound of .
  3. De-Berg and Speckmann and van-der-Weele[17] improve the upper bound to , matching the theoretical lower bound. (For the special case where the depth is 1, they present an algorithm that uses only four classes of 45-degree-polygons (rectangles, right-angled triangles, right-angled trapezoids and 45-degree pentagons), and guarantees an aspect ratio of at most 34/7.)

The latter two algorithms operate in two steps (greatly simplified for clarity):

  1. The original tree is converted to a binary tree: each node with more than two children is replaced by a sub-tree in which each node has exactly two children.
  2. Each region representing a node (starting from the root) is divided to two, using a line that keeps the angles between edges as large as possible. It is possible to prove that, if all edges of a convex polygon are separated by an angle of at least , then its aspect ratio is . It is possible to ensure that, in a tree of depth , the angle is divided by a factor of at most , hence the aspect ratio guarantee.

Orthoconvex treemaps

[edit]

In convex treemaps, the aspect ratio cannot be constant - it grows with the depth of the tree. To attain a constant aspect-ratio, Orthoconvex treemaps[17] can be used. There, all regions are orthoconvex rectilinear polygons with aspect ratio at most 64; and the leaves are either rectangles with aspect ratio at most 8, or L-shapes or S-shapes with aspect ratio at most 32.

For the special case where the depth is 1, they present an algorithm that uses only rectangles and L-shapes, and the aspect ratio is at most ; the internal nodes use only rectangles with aspect ratio at most .

Other treemaps

[edit]
Voronoi Treemaps
[18] based on Voronoi diagram calculations. The algorithm is iterative and does not give any upper bound on the aspect ratio.
Jigsaw Treemaps[19]
based on the geometry of space-filling curves. They assume that the weights are integers and that their sum is a square number. The regions of the map are rectilinear polygons and highly non-ortho-convex. Their aspect ratio is guaranteed to be at most 4.
GosperMaps
[20] based on the geometry of Gosper curves. It is ordered and stable, but has a very high aspect ratio.

History

[edit]
Hard disk space usage visualized in TreeSize, software first released in 1996

Area-based visualizations have existed for decades. For example, mosaic plots (also known as Marimekko diagrams) use rectangular tilings to show joint distributions (i.e., most commonly they are essentially stacked column plots where the columns are of different widths). The main distinguishing feature of a treemap, however, is the recursive construction that allows it to be extended to hierarchical data with any number of levels. This idea was invented by professor Ben Shneiderman at the University of Maryland Human – Computer Interaction Lab in the early 1990s. [21][22] Shneiderman and his collaborators then deepened the idea by introducing a variety of interactive techniques for filtering and adjusting treemaps.

These early treemaps all used the simple "slice-and-dice" tiling algorithm. Despite many desirable properties (it is stable, preserves ordering, and is easy to implement), the slice-and-dice method often produces tilings with many long, skinny rectangles. In 1994 Mountaz Hascoet and Michel Beaudouin-Lafon invented a "squarifying" algorithm, later popularized by Jarke van Wijk, that created tilings whose rectangles were closer to square. In 1999 Martin Wattenberg used a variation of the "squarifying" algorithm that he called "pivot and slice" to create the first Web-based treemap, the SmartMoney Map of the Market, which displayed data on hundreds of companies in the U.S. stock market. Following its launch, treemaps enjoyed a surge of interest, particularly in financial contexts.[citation needed]

A third wave of treemap innovation came around 2004, after Marcos Weskamp created the Newsmap, a treemap that displayed news headlines. This example of a non-analytical treemap inspired many imitators, and introduced treemaps to a new, broad audience.[citation needed] In recent years, treemaps have made their way into the mainstream media, including usage by the New York Times.[23][24] The Treemap Art Project[25] produced 12 framed images for the National Academies (United States), shown at the Every AlgoRiThm has ART in It exhibit[26] in Washington, DC and another set for the collection of Museum of Modern Art in New York.

See also

[edit]

References

[edit]
[edit]
Revisions and contributorsEdit on WikipediaRead on Wikipedia
from Grokipedia
Treemapping is a space-filling visualization technique for representing hierarchical data structures by recursively partitioning a rectangular display area into nested rectangles, where each rectangle's size is proportional to an associated quantitative attribute of the node it represents, such as in a directory . This method, introduced by and in 1991, enables the efficient depiction of large hierarchies—potentially thousands of nodes—within a fixed screen space, contrasting with traditional node-link diagrams that often become cluttered or incomplete for complex . The core algorithm alternates between horizontal and vertical slicing directions at successive levels of the hierarchy, ensuring a balanced layout while preserving structural relationships and allowing interactive controls for attributes like color coding to encode additional metadata, such as node type or depth. Developed initially to address challenges in visualizing storage utilization on hard disks, treemapping facilitates rapid identification of dominant elements in hierarchies, such as oversized files consuming disproportionate space, thereby supporting practical tasks like and decision-making. formalized and expanded the approach in 1992, emphasizing its linear (O(n) for n nodes) and applicability to diverse domains beyond , including organizational charts, portfolios—such as those visualized in interactive stock market heatmaps (also known as sector heatmaps) that use treemap layouts with rectangle size proportional to market capitalization and color indicating performance (typically green for gains and red for losses)—and library collections. The technique's strength lies in its ability to convey both quantitative proportions through area and qualitative groupings through nesting and adjacency, though it requires careful design to mitigate distortions in aspect ratios that can hinder precise comparisons. Over time, treemapping has evolved with variants like cushioned treemaps, which add shading gradients to enhance perceived depth and readability in dense visualizations, as proposed by Jarke J. van Wijk and Huub van de Wetering in 1999. Today, it remains a staple in tools for dashboards and exploratory , particularly effective for unbalanced hierarchies with a single key metric, but less ideal for evenly distributed data or when exact numerical comparisons are paramount.

Fundamentals

Definition and Principles

Treemapping is a visualization technique that displays hierarchical, tree-structured using nested rectangles or other shapes, where the area of each shape is proportional to a quantitative value associated with the corresponding node, such as or sales volume. This method maps the entire onto a two-dimensional display area, ensuring full utilization of the available space through based on the tree's structure. The primary purpose of treemapping is to represent large hierarchies compactly within limited screen space, enabling users to compare relative sizes, detect patterns, and navigate nested structures more effectively than with traditional node-link diagrams or textual listings. Developed in the early to overcome challenges in visualizing complex file systems and disk usage, it allows for the simultaneous display of thousands of nodes while preserving both structural relationships and quantitative attributes. At its core, treemapping employs a space-filling approach that recursively subdivides the display region according to the branching of the , with each level's partitions reflecting the proportional weights of child nodes. It supports visualization of multiple dimensions by encoding size through area and additional attributes—such as categories or secondary values—through color, shading, or texture, facilitating rapid identification of outliers or trends. For instance, in a treemap of a computer's , directories appear as larger enclosing rectangles containing smaller sub-rectangles for files, with areas scaled to storage consumption and colors indicating file types.

Visual Encoding and Design Goals

In treemaps, visual encoding maps hierarchical data attributes to spatial and aesthetic properties to facilitate comprehension of structure and quantitative values. The primary encoding uses area to represent a quantitative measure, such as node size or value, ensuring proportionality for accurate size comparisons across elements. Nesting of encodes the , with child nodes fully contained within parent to depict levels of containment, typically progressing from outer to inner for deeper levels. Additional qualitative attributes, like categories or types (e.g., file extensions), are encoded via color, , or texture to differentiate groups without altering spatial proportions. Optional elements such as borders, labels, or icons provide identification and context, though their use is balanced to avoid visual clutter in dense layouts. Design goals for treemaps prioritize readability, comparability, and perceptual efficiency. A key objective is minimizing aspect ratios to avoid elongated rectangles, which hinder size estimation and visual scanning; the aspect ratio of a rectangle is defined as max(wh,hw)\max\left(\frac{w}{h}, \frac{h}{w}\right), where ww is width and hh is height, with ideal values approaching 1 for near-square shapes that support better labeling and selection. Preservation of reading order maintains a consistent left-to-right and top-to-bottom traversal, aligning with natural scanning patterns to aid item location and pattern recognition. Stability ensures minimal layout disruption during data updates, reducing cognitive load by keeping familiar elements in predictable positions and minimizing animation flicker. The enclosure principle reinforces hierarchical clarity by guaranteeing that all child rectangles are wholly contained within their parent, preventing ambiguous relationships. Usability in treemaps is enhanced through interactive features that address for large datasets. Support for zooming allows users to magnify regions for detailed inspection while preserving an overview context, filtering enables selective display of subsets based on criteria like value thresholds, and details-on-demand provides supplementary (e.g., tooltips) upon interaction, aligning with established visualization tasks. These mechanisms collectively promote exploratory analysis without overwhelming the display.

Tiling Algorithms

Rectangular Treemaps

Rectangular treemaps represent the most common form of treemapping, employing recursive subdivision of an enclosing into smaller, axis-aligned rectangles whose areas are proportional to the sizes of the corresponding nodes in a hierarchical . This approach ensures a space-filling layout that preserves the through nesting, with each rectangle's dimensions encoding both node size and depth. The foundational algorithm for rectangular treemaps is the slice-and-dice method, introduced by Shneiderman in 1992. It operates by alternately partitioning the current horizontally and vertically based on tree levels: even levels use vertical splits, odd levels horizontal ones. Specifically, for a given and node, the algorithm draws split lines proportional to child node sizes (e.g., the first vertical split at position x_3 = x_1 + \frac{\text{Size}(\text{child}{{grok:render&&&type=render_inline_citation&&&citation_id=1&&&citation_type=wikipedia}})}{\text{Size}(\text{root})} \times (x_2 - x_1)), then recurses on subrectangles. This yields linear of O(n)O(n), where nn is the number of nodes, making it efficient for large hierarchies. However, it often produces rectangles with high aspect ratios—such as narrow strips—due to unbalanced splits, which can hinder visual comparison of sizes. To address the aspect ratio issues, Bruls et al. proposed the squarified in 2000, which prioritizes near-square shapes by sorting leaf nodes in decreasing order of size and greedily adding them to rows or columns. The core procedure, squarify(children, row, w), evaluates whether adding the next child cc improves the worst in the current row: if worst(row,w)worst(row{c},w)\text{worst}(row, w) \leq \text{worst}(row \cup \{c\}, w), it adds cc and recurses; otherwise, it lays out the current row, starts a new one in the remaining space, and recurses on the rest. Here, worst(R,w)=max(maxrRw2rs2,s2w2r)\text{worst}(R, w) = \max\left( \max_{r \in R} \frac{w^2 r}{s^2}, \frac{s^2}{w^2 r} \right), with rr as individual areas and ss as their sum. This results in significantly better s (e.g., average 3.21 on stock datasets) compared to slice-and-dice (369.83), though it requires O(nlogn)O(n \log n) time due to sorting and can disrupt node ordering. Shneiderman and Wattenberg extended this in 2001 with the ordered treemap algorithm, specifically the pivot-by-split-size variant, to balance shape quality with order preservation. It selects the largest child as a pivot and splits the remaining siblings into three ordered groups (before and after the pivot) to minimize the pivot rectangle's aspect ratio, choosing the split dimension (horizontal if width ≥ height, else vertical) where the maximum child-to-total size ratio is minimized. The split point is computed by distributing items to achieve near-square pivot proportions, recursing on the subregions. This improves stability over squarified layouts (e.g., layout distance change of 2.93–7.29 vs. 10.10 on test data) while maintaining moderate aspect ratios (e.g., 17.65–33.01 on stocks), at an average O(nlogn)O(n \log n) time complexity akin to quicksort. Comparisons across these algorithms highlight key trade-offs: slice-and-dice excels in speed (e.g., 20,000 nodes in 0.03 seconds) and stability but yields poor aspect ratios; squarified optimizes shapes for at the cost of instability and reordered nodes; ordered variants like pivot-by-split-size offer a compromise, with better preservation of input order and moderate performance, though slower than slice-and-dice in worst cases (O(n2)O(n^2)). Quantitative evaluations on datasets like 535-stock hierarchies show ordered methods achieving scores (0.61) competitive with squarified while outperforming slice-and-dice in shape quality.

Convex Treemaps

Convex treemaps represent an advancement over rectangular treemaps by utilizing convex polygons as the basic tiling units, enabling more uniform shapes and reducing the tendency for extreme elongation in regions corresponding to nodes with highly uneven subtree sizes. This design is especially advantageous for hierarchical datasets where branching factors vary significantly, as it allows for flexible partitioning that better preserves aspect ratios across the visualization. Unlike strictly rectangular layouts, convex treemaps maintain the space-filling property while permitting non-axis-aligned boundaries to improve overall aesthetic and perceptual qualities. The foundational algorithm for convex treemaps, developed by de Berg, Speckmann, and van der Weele, employs a strategy to divide the display area into convex polygons proportional to node weights. The process begins by converting the input into an equivalent to simplify subdivision, followed by recursive splits that introduce a new edge direction at each tree level, ensuring all resulting regions remain convex. This method guarantees an bounded by O(depth(T))O(\mathrm{depth}(T)), where depth(T)\mathrm{depth}(T) denotes the maximum depth of the tree, providing a theoretical improvement over unbounded ratios in simpler rectangular approaches. A specialized subclass, orthoconvex treemaps, further refines this by restricting polygons to orthoconvex forms—defined such that the intersection with any horizontal or vertical line is either empty or a single interval—resulting in shapes like rectangles, L-shapes, or . Detailed in the extended analysis by de Berg et al., the construction operates recursively, using guillotine-style cuts augmented with staircase indentations to handle subtree allocations while enforcing orthoconvexity. These treemaps achieve a constant of O(1)O(1) for any input irrespective of depth, compared to ratios exceeding 10 in traditional slice-and-dice rectangular layouts for similar datasets. Despite these benefits, implementing convex and orthoconvex treemaps introduces challenges, particularly in rendering, as software must handle arbitrary convex polygons rather than simple rectangles, increasing computational overhead for drawing, shading, and interaction in visualization libraries.

Alternative Treemap Variants

Voronoi treemaps represent a departure from rectangular tilings by employing centroidal Voronoi tessellations to partition space into based on a set of weighted seed points (generators), where each point corresponds to a node in the and its weight reflects the node's size. The algorithm initializes seed points randomly within a bounding and iteratively applies Lloyd's relaxation method: in each iteration, the is computed to define regions, seeds are moved to the centroids of their respective regions using weighted distance metrics (such as additive or power-weighted distances), and weights are adjusted to match target areas until convergence (typically within 200 iterations for small hierarchies, achieving area errors below 0.1%). This process yields more uniform, compact shapes with aspect ratios close to 1, improving over traditional treemaps by avoiding elongated rectangles and enabling layouts within arbitrary bounding shapes like circles or triangles. However, the computational cost is notable, with each Voronoi construction at O(n log n) time and overall depending on the number of iterations, making it less efficient for very large datasets compared to linear-time rectangular algorithms. Jigsaw treemaps introduce organic, interlocking shapes reminiscent of puzzle pieces or cushions, generated by mapping hierarchical nodes along space-filling curves such as the overlaid on a grid. The algorithm traces the to assign regions sequentially, ensuring that nodes form contiguous, fat segments that curve gently for enhanced visual cohesion, while preserving and proportionality to node weights. This approach emphasizes perceptual grouping by creating smooth boundaries that facilitate quick identification of related elements, offering aesthetic appeal suitable for exploratory visualizations where strict geometry is secondary to intuitive flow. Unlike rigid rectangular variants, Jigsaw layouts adapt to varying node sizes through curve-guided subdivision, but they assume relatively uniform leaf sizes for optimal results and can introduce minor distortions in deep hierarchies. GosperMaps utilize Gosper's flowsnake —a hexagonal with locality properties—to create nested, irregular regions that approximate circular containment for hierarchical data. The algorithm begins with a depth-first ordering of leaves along the , recursively subdivides line segments into hexagonal tiles using the curve's self-similar structure (with angles of 2π/3 or 4π/3 for smooth boundaries), and merges child regions to form parent enclosures, enabling radial-like layouts that preserve ordering and proximity. This method excels in visualizing large taxonomies by leveraging the curve's space-filling efficiency (locality constant ≈ √6.35), producing map-like visuals that support navigation in radial hierarchies without the distortion of polar projections. Other notable variants include radial treemaps, which adapt the to polar coordinates for layered, circular layouts where node positions are computed to minimize crossings and maximize symmetry in angular sectors. Quantum treemaps extend tiling principles to fixed-size tiles, quantizing rectangle dimensions to multiples of a base unit (e.g., for thumbnails), ensuring grid alignment across the while accepting some wasted space (around 10-20% depending on node counts) to maintain consistency over proportional scaling. Recent developments as of 2025 include neighborhood-preserving Voronoi treemaps that incorporate data similarity for better clustering. These alternative variants prioritize aesthetic and perceptual enhancements, such as organic shapes and improved grouping, over the simplicity of rectangular or convex forms, but they often incur higher computational demands—exemplified by iterative optimizations in Voronoi methods—and can complicate user interactions like precise selection due to irregular boundaries.

Historical Development

Origins and Early Innovations

Treemapping was invented by at the University of Maryland during 1991–1992 as part of research at the Human-Computer Interaction Laboratory (HCIL) focused on visualizing hierarchies. The technique emerged from efforts to address the limitations of traditional node-link diagrams, which inefficiently utilized screen space for large trees and struggled to display thousands of nodes across multiple levels. The primary motivation stemmed from the need to compactly display disk usage in personal computing environments, where hard drives were filling up with hierarchical file structures like those in Unix, Macintosh, or systems. In the early , as data volumes grew with expanding storage—often spanning 5–6 orders of magnitude in file sizes—existing tools like directory listings or tree views failed to provide an overview of the entire without excessive or clipping. Shneiderman sought a space-filling method to represent the full file set on a single screen, enabling users to quickly identify large files for management, such as deletion to free space. A precursor publication by Brian Johnson and Ben Shneiderman in 1991 introduced the foundational concept of space-filling visualizations for hierarchies, mapping tree structures onto rectangular displays using 100% of the available space. This work laid the groundwork by demonstrating early implementations on Macintosh systems, with color coding for file types (e.g., red for applications), but it primarily explored layout principles without full refinement. The first prototype followed in 1992, implemented by Johnson on an Apple Macintosh II with a high-resolution color display, visualizing examples like 850 files across four directory levels. Shneiderman's 1992 paper formalized the initial , known as slice-and-dice, which recursively partitions a rectangular area into sub-rectangles proportional to node attributes, alternating horizontal and vertical slices by tree level to maintain a linear of O(n). Unlike prior hierarchical visualization techniques, which relied on node-link representations and left over 50% of display space unused, slice-and-dice ensured efficient packing while preserving hierarchy through nesting and adjacency. This innovation responded directly to the era's challenges in personal computing, where no comparable space-efficient methods existed for interactive exploration of deep, quantitative hierarchies.

Evolution and Key Advancements

Following the foundational rectangular treemaps that evolved from slice-and-dice layouts, significant algorithmic advancements in the early 2000s addressed limitations in aspect ratios and interactivity. The squarified algorithm, introduced by Bruls, Huizing, and van Wijk in 2000, represented a major improvement by recursively partitioning areas to minimize elongation, achieving more square-like rectangles that enhanced readability for hierarchical data visualization. Presented at the IEEE Symposium on Information Visualization, this method prioritized balanced subdivisions within each level of the , setting a standard for subsequent layouts. A notable earlier enhancement was the cushioned treemaps proposed by Jarke J. van Wijk and Huub van de Wetering in 1999, which incorporated shading gradients to simulate depth and improve the perception of nesting in dense layouts, thereby enhancing overall readability without altering the underlying partitioning. Concurrently, Wattenberg's 1999 work enabled the first interactive web-based treemaps through the , applied in the Map of the Market visualization for SmartMoney, which allowed dynamic online exploration of hierarchies. This advancement shifted treemapping toward practical, user-driven applications by supporting real-time pivoting between horizontal and vertical slices, facilitating broader adoption in web environments. In the mid-2000s, expansions emphasized and beyond rectangles. The Voronoi treemap algorithm by Balzer and Deussen in used weighted Voronoi diagrams to generate polygonal partitions, improving uniformity and enabling non-rectangular boundaries that better preserved hierarchical structure in complex datasets. Similarly, Wattenberg's Jigsaw treemaps () incorporated space-filling curves like the to create interlocking, puzzle-like regions, enhancing visual coherence and ordering preservation for large-scale hierarchies. By the early 2010s, convex treemaps emerged, as detailed by de Berg et al. in 2011, employing convex polygons to bound aspect ratios and support scalable layouts for deeper trees, marking a pivot toward geometrically constrained designs. The 2010s saw further theoretical refinements, focusing on guaranteed performance metrics. Orthoconvex treemaps, formalized by de Berg et al. in 2014, utilized orthoconvex polygons (rectangles, L-shapes, and S-shapes) for internal nodes to achieve constant aspect ratios independent of , with a construction time of O(d n) where d is the depth and n the number of nodes. GosperMaps, proposed by Auber et al. in 2013, leveraged the Gosper curve—a space-filling —to generate nested, island-like regions, improving perceptual grouping and navigation in irregular hierarchies while maintaining proportional sizing. From 2020 to 2025, treemapping evolved through integrations with ecosystems rather than radical algorithmic shifts, with refinements emphasizing layout stability for dynamic datasets. Surveys highlight ongoing work on stable variants, such as extensions to Voronoi methods that minimize node displacement during updates, supporting tools like for scalable visualizations in analytics platforms. No major breakthroughs disrupted established paradigms, but these enhancements bolstered reliability in high-volume applications.

Applications

In Data Analysis and Business Intelligence

Treemaps are widely employed in to visualize hierarchical structures such as file systems, where they display disk space usage by nesting directories and files proportionally to their sizes, enabling analysts to quickly identify space-intensive components. In budget analysis, treemaps represent allocations across categories like departments or projects, with rectangle areas scaled to expenditure amounts, facilitating the detection of largest expense categories in corporate financial data. Similarly, for organizational charts, treemaps encode employee hierarchies by team or role, using size for metrics such as headcount or salary totals, which aids in resource planning and bottleneck identification. In , treemaps support portfolio management by visualizing asset compositions, such as stock portfolios in stock market heatmaps (also known as sector heatmaps). These treemap-style charts display stocks or sectors as rectangles, with areas proportional to and colors indicating price performance—typically green for positive changes and red for negative changes—enabling investors to assess diversification and market trends at a glance. For sales hierarchies, they depict multi-level structures like regions subdivided into products and individual items, with areas proportional to revenue, helping managers spot top-performing segments. Popular BI tools integrate treemaps natively; for instance, Tableau uses them in dashboards to encode hierarchies via nested rectangles sized by measures like sales volume, while Power BI enables conditional coloring for additional dimensions such as growth rates. As of January 2025, introduced enhancements to the treemap visual, including new tiling methods for improved layouts in hierarchical data exploration. Scientific applications leverage treemaps for complex datasets, including where they visualize trees or ontologies, with rectangles representing gene categories sized by expression levels to highlight regulatory patterns. Treemaps enhance by enabling quick spotting of proportions through area-based visual encoding, where larger rectangles intuitively convey dominant categories without angular comparisons. Their interactive capabilities, such as drilling down into sub-hierarchies, support exploratory analysis in dashboards, as implemented in tools like Power BI for navigating sales or . A survey of user studies found that treemaps often outperform pie charts in accuracy for size comparison tasks in hierarchical data, though they may require familiarity for optimal speed.

In Media, Art, and Other Domains

Treemaps have found prominent applications in media and , where they enable the visualization of dynamic, hierarchical data to highlight story prominence and source diversity. A seminal example is Newsmap, developed by Marcos Weskamp in 2004, which aggregates headlines from into an interactive treemap layout; larger rectangles represent more prominent stories, while colors distinguish news sources, allowing users to quickly grasp global news landscapes and filter by categories or regions. This tool pioneered real-time treemap updates for live news feeds, pulling fresh data every few minutes to reflect evolving coverage priorities. In artistic contexts, treemaps transcend analytical purposes to create aesthetically compelling prints that evoke emotional responses through color and form. The Treemap Art Project, initiated by in 2013, generates limited-edition artworks from hierarchical datasets such as personal music libraries or software codebases, employing squarified layouts to produce balanced, nested rectangles; vibrant color schemes are selected to convey themes like in music or complexity in code, transforming data into wall-hangable pieces exhibited at venues including the University of Maryland and the . These adaptations emphasize emotional impact, with hues chosen not just for differentiation but to inspire interpretations of joy, tension, or in the viewer's experience. Beyond media and art, treemaps support hierarchical visualization in education, gaming, and web design. In education, they facilitate the representation of curriculum structures, such as nested topics within subjects, aiding students and instructors in navigating complex syllabi; classroom studies have demonstrated their role in building treemap literacy, where interactive examples help learners decode proportions and hierarchies more effectively than traditional diagrams. For gaming, treemaps visualize resource trees or search algorithms in strategy titles and AI-driven simulations, compactly displaying inventory hierarchies or decision branches to optimize player or developer insights into large datasets. In web design, they render site maps as proportional rectangles to depict page hierarchies and traffic flows, enabling designers to identify structural imbalances at a glance. A contemporary example is the use of treemaps in notebooks as of 2025, where built-in zoomable implementations support interactive data stories, allowing users to explore nested narratives in journalism or education through reactive, collaborative visualizations. The cultural impact of treemaps spans from early financial visualizations to integrated modern tools, influencing how hierarchical information is perceived in public discourse. The SmartMoney Map of the Market, launched in 1999 by Martin Wattenberg, popularized treemaps by displaying live stock data for over 500 companies, with rectangle sizes indicating and colors signaling performance changes, making complex market dynamics accessible to general audiences for over a decade. This legacy extends to contemporary platforms like Inforiver Analytics+, which by 2024 integrated advanced treemap features into dashboards for dynamic hierarchy exploration, bridging artistic and analytical uses in narrative-driven reporting.

Challenges and Extensions

Limitations and Trade-offs

Treemaps face significant perceptual challenges that limit their effectiveness in accurately conveying hierarchical data. Human perception of area is inherently less precise than for linear dimensions like length, leading users to underestimate relative sizes with a power-law exponent of approximately 0.7, which complicates comparisons between adjacent rectangles, especially small ones. In deep hierarchies, lower-level rectangles become minuscule and prone to visual occlusion by larger parent nodes, obscuring structural details and increasing cognitive load for users. Additionally, treemaps often rely on color to encode categories or attributes, which can result in misinterpretation for users with color vision deficiencies if alternative encodings like texture or patterns are not provided. Algorithmic trade-offs further constrain treemap utility. The slice-and-dice algorithm, introduced in early treemap designs, prioritizes computational speed with linear-time but frequently generates skinny rectangles with extreme aspect ratios, exacerbating perceptual inaccuracies in size judgments. Conversely, the squarified algorithm improves aspect ratios for more uniform shapes that enhance readability but requires higher computational effort, making it slower for large or dynamic datasets. Stability poses another challenge: minor data updates can trigger substantial layout rearrangements in standard algorithms, disrupting user orientation and hindering tracking of changes over time. Scalability limits become evident with very deep trees or unbalanced distributions, where tiny leaf nodes render size estimation unreliable; controlled studies indicate relative errors in area comparisons under such conditions, particularly at moderate data densities. Compared to alternatives like charts, treemaps excel at proportional value comparisons via direct area encoding but underperform in revealing topological relationships, as their nested rectangles obscure path dependencies more than radial layouts. To mitigate these issues, hybrid approaches combining treemaps with node-link diagrams or subtle animations for transitions can balance proportion accuracy with structural clarity, though they introduce additional design complexity.

Modern Implementations and Research Directions

Modern software libraries and tools have made treemapping accessible across various programming environments and platforms. The library provides a robust implementation for web-based treemaps, supporting extensible tiling methods like squarified layouts to generate rectangles with balanced aspect ratios. In Python, the squarify package offers a pure implementation of the squarified treemap algorithm, enabling efficient visualization of hierarchical data through nested rectangles proportional to values. Similarly, R's treemap package facilitates the creation of customizable treemaps, handling large datasets with options for annotations and interactive elements. Tableau includes built-in support for squarified treemaps, allowing users to drag dimensions and measures onto the view for automatic generation of hierarchical visualizations. Contemporary integrations extend treemaps into business intelligence and mobile applications. Power BI supports interactive treemaps that display hierarchical data with nested rectangles sized by measures and colored by categories, enabling dynamic filtering and cross-highlighting in recent updates. On mobile devices, Android apps like DiskUsage employ treemaps to visualize file system hierarchies, showing storage consumption across internal and external drives. Emerging research focuses on enhancing treemap capabilities for complex and large-scale . Recent work explores hybrid treemap layouts that combine multiple tiling principles within a single visualization to improve for diverse hierarchical structures. For scalability with , studies demonstrate interactive treemaps for architectures, evaluating performance on datasets up to 10 levels deep to support real-time exploration without performance degradation. Extensions to three-dimensional and environments are under investigation, with prototypes adapting treemap principles to immersive 3D heatmaps for stock visualization in VR headsets. Efforts to address accessibility gaps emphasize alternatives to color reliance. 2024 guidelines for data visualizations recommend using patterns and textures in treemaps alongside or instead of color to accommodate color-blind users, ensuring WCAG 2.1 compliance through sufficient contrast and programmatic readability. Hybrid approaches integrating treemaps with node-link diagrams have been proposed to combine spatial hierarchy representation with relational graph elements, aiding in the analysis of compound graphs. Looking ahead, treemaps hold promise for real-time dashboards in various applications.

References

Add your contribution
Related Hubs
Contribute something
User Avatar
No comments yet.