
Community hub
Recent from talks
Contribute something
Nothing was collected or created yet.
Station model
View on WikipediaThis article needs additional citations for verification. (August 2025) |

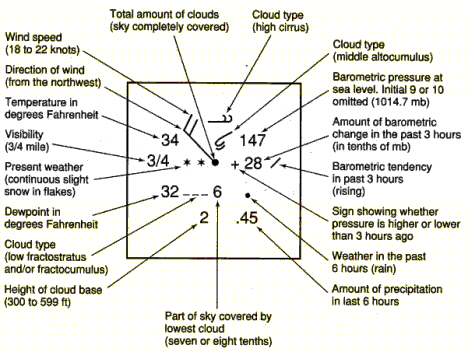
In meteorology, station models are symbolic illustrations showing the weather occurring at a given reporting station. Meteorologists created the station model to fit a number of weather elements into a small space on weather maps. This allows map users to analyze patterns in atmospheric pressure, temperature, wind speed and direction, cloud cover, precipitation, and other parameters.[1] The most common station plots depict surface weather observations although upper air plots at various mandatory levels are also frequently depicted.
Station model plots use an internationally accepted coding convention that has changed little since August 1, 1941. Elements in the plot show the key weather elements, including temperature, dew point, wind, cloud cover, air pressure, pressure tendency, and precipitation.[2][3]
Measurement location and units
[edit]Weather maps primarily use the station model to show surface weather conditions, but the model can also show the weather aloft as reported by a weather balloon's radiosonde or a pilot's report.
Plotted winds
[edit]
The station model uses a wind barb to show both wind direction and speed. The wind barb shows the speed using "flags" on the end.
- Each half of a flag depicts 5 kn (9.3 km/h; 5.8 mph)
- Each full flag depicts 10 kn (19 km/h; 12 mph)
- Each pennant (filled triangle) depicts 50 kn (93 km/h; 58 mph)[4]
Winds are depicted as blowing from the direction the flags are facing. Therefore, a northeast wind will be depicted with a line extending from the cloud circle to the northeast, with flags indicating wind speed on the northeast end of this line.[5] Once plotted on a map, an analysis of isotachs (lines of equal wind speeds) can be accomplished. Isotachs are particularly useful in diagnosing the location of the jet stream on upper level constant pressure charts, usually at or above the 300 hPa level.[6]
The flags and pennants point to the low pressure, so it is possible to determine at which hemisphere the station is standing. The barbs in the figure at the right are located at the Northern Hemisphere, because the wind is circling counter clock-wise around a low-pressure area at the Northern Hemisphere (the wind is blowing in the opposite direction at the Southern Hemisphere, see also Buys Ballot's law).
More than a century ago, winds were initially plotted as arrows facing downwind, with feathers on both sides of the staff to indicate wind speed.[7] In the United States, the change to the modern convention of flags shown on one side of the staff to indicate wind speed took effect on August 1, 1941.[8][9]
Cloud cover
[edit]
Along with wind direction, cloud cover is one of the oldest atmospheric conditions to be coded on a station model.[7][8] The circle in the middle of the station model represents cloud cover. In the United Kingdom, when the observation is taken from an automated weather observation site, the shape is a triangle.[10] If the shape is completely filled in, it is overcast. If conditions are completely clear, the circle or triangle is empty. If conditions are partly cloudy, the circle or triangle is partially filled in.[3] The cloud cover shape has different looks depending upon how many oktas (eighths of the sky) are covered by cloud. A sky half full of clouds would have a circle that was half white and half black. Below the shape indicating sky cover, the station model can indicate the coverage of low clouds, in oktas, and the ceiling height in hundreds of feet. The ceiling height is the height at which more than half the sky is covered by clouds.
For pilots, knowledge of the sky cover helps determine if visual flight rules (VFR) are being met. Knowing the degree of cloud cover can help determine whether or not various weather fronts, such as cold fronts or warm fronts, have passed by a location. A nephanalysis, contouring areas that are cloudy with scalloped lines, can be performed to indicate a system's cloud and precipitation pattern.[11] This technique is rarely performed nowadays, due to the prevalence of satellite imagery worldwide.[12]
Cloud types
[edit]
Above or below the circle for manned stations (automatic stations do not report cloud types) that indicates sky cover can lie one or more symbols indicating cloud types in any of the low, middle, and high-étages for tropospheric clouds. One predominant cloud type may be depicted for each of three étages, if known. The middle and high-étage types are depicted above the sky cover circle of the station model, while the main low-étage cloud type is indicated below the circle.[5] Since the station model has limited room, it makes no special provision for vertical or multi-level clouds that can occupy more than one étage at a particular time.[13] Consequently, cloud genera with significant vertical development may be coded and plotted as low or middle depending on the altitude at which they normally form. Cumulus and cumulonimbus usually form in the low étage of the troposphere and achieve vertical extent by growing upward into the middle or high étage. Conversely, nimbostratus usually forms in the middle étage of the troposphere and becomes vertically developed by growing downward into the low étage.[14] Although the SYNOP code has no separate formal group classification for vertical or multi-level clouds, the observer procedure for selecting numerical codes is designed to give high reporting priority to those genera or species that show significant vertical development.
The symbols used for clouds emulate the cloud shape. Cirrus is indicated by a couple hooks, cumulus are indicated by a mound shape, with cumulonimbus indicated with an upside down trapezoid on top of the cumulus symbol to indicate its anvil. When there is more than one cloud type present per level, the cloud type with the highest priority is included.[15] Knowing the cloud type at various locations can help determine whether or not a weather front has passed by a particular location. A low deck of stratus could indicate a station is still north of a warm front, while thunderstorms can indicate the approach of a squall line or cold front.
-
 Low étage (Sc,St) and upward-growing vertical (Cu, Cb)
 -
 Middle étage (Ac,As) and downward-growing vertical (Ns)
 -
 High étage (Ci,Cc,Cs)


Present weather and visibility
[edit]
To the left of the cloud shape in the center of the station model is the symbol depicting present weather. The present weather symbol depicts the current weather which normally is obstructing the visibility at the time of observation. The visibility itself is shown as a number, in statute miles in the United States and meters elsewhere, describing how far the observer can see at that time. This number is located to the left of the present weather symbol.[5] For pilots, knowledge of the horizontal visibility helps determine if they are flying through instrument meteorological conditions (IMC), such as foggy or smoky conditions, as well as areas of intense precipitation. Present weather depicted with the station model can include:
- Dust
- Fog
- Haze
- Ocean spray
- Precipitation
- Sand
- Smoke
- Thunderstorms
- Volcanic ash
Temperature and dew point
[edit]To left of center in the station model, the temperature and dew point are plotted. Within the United States on surface weather maps, they are still plotted in degrees Fahrenheit.[5] Otherwise, they will be in units of degrees Celsius. This knowledge is important to meteorologists because when this data is plotted on a map, isotherms and isodrosotherms (lines of equal dew point) are easily analyzed, either by man or machine, which can help determine location of weather fronts.
Sea level pressure and height of pressure surface
[edit]On the top right corner of the model for a surface weather map is the pressure, showing the last two integer digits of the pressure in millibars, or hectopascals, along with the first decimal. For instance, if the pressure at a certain location is 999.7 hPa, the pressure portion of the station model will read 997. Although the first digit or two of the pressure is left off, other nearby stations give away whether the pressure starts with a 10 or a 9. Most of the time, choosing first digits that would lead to a value nearest to 1000 works out best.[5] The plotting of this value within the station model allows for the analysis of isobars on weather maps. Within maps which plot data on constant pressure surfaces, the pressure is replaced with the height of the pressure surface.[16]
Pressure tendency
[edit]
Below the pressure will lie the pressure tendency figure, which indicates the pressure change over the past three hours. The number depicting the pressure change will usually have two digits and indicate the pressure change in 0.1 millibar increments. There are nine different figures which represent the pressure change. A slant angled up and right indicates a steady rise, while a downward slant to the lower right indicates a steady fall. Steady rises can indicate improving conditions and approaching high pressure, and normally occur in the wake of a cold front. Steady falls can indicate deteriorating conditions and an approaching low pressure area, with the largest falls occurring in advance of a surface cyclone and its attendant warm front.[17]
The time of the day must be considered, as there are two natural rises per day (locally around 10 am and 10 pm) and two natural falls per day (locally around 4 am and 4 pm). These daily changes in pressure can mask the movement of pressure systems and fronts past a location. The lowest natural dip in the pressure, in a stagnant weather pattern, occurs around 4 pm while the highest natural peak in pressure occurs around 10 am.[18] Once plotted on a map, the analysis of isallobars (lines of equal pressure change) can be plotted on a map, which can indicate the direction of motion of high and low pressures systems across the map domain.[19]

Past weather
[edit]Station models can have past weather plotted within them, which would be located just under the pressure tendency. They indicate the type of weather experienced during the past six hours. The weather types are limited to obstructions of visibility and precipitation.[5]
Animations may depict a time series of station model conditions which is most often used to show recent changes in weather conditions and are useful in nowcasting and forecasting.
See also
[edit]References
[edit]- ^ CoCoRAHS (2015).INTRODUCTION TO DRAWING ISOPLETHS. Archived 2007-04-28 at the Wayback Machine Colorado Climate Center. Retrieved on 2007-04-29.
- ^ National Weather Service (2003). Station Model Example. Retrieved on 2007-04-29.
- ^ a b Dr Elizabeth R. Tuttle (2005). Weather Maps. Archived 2008-07-09 at the Wayback Machine J. B. Calvert. Retrieved on 2007-05-10.
- ^ Hydrometeorological Prediction Center (2008). Decoding the station model. National Centers for Environmental Prediction. Retrieved on 2007-05-16.
- ^ a b c d e f JetStream (2008). How to read weather maps. Archived 2012-07-05 at the Wayback Machine National Weather Service. Retrieved on 2007-05-16.
- ^ Terry T. Lankford (2000). Aviation Weather Handbook. McGraw-Hill Professional. ISBN 978-0-07-136103-3. Retrieved on 2008-01-22.
- ^ a b United States Weather Bureau (1871). Daily Weather Map: January 1, 1871. Retrieved on 2008-01-22.
- ^ a b United States Weather Bureau (1941). Daily Weather Map: July 31, 1941. Retrieved on 2008-01-22.
- ^ United States Weather Bureau (1941). Daily Weather Map: August 1, 1941. Retrieved on 2008-01-22.
- ^ MetOffice (2008). Interpreting weather charts. Archived 2007-05-25 at the Wayback Machine Retrieved on 2007-05-17.
- ^ Glossary of Meteorology (2009). Nephanalysis. Archived 2007-08-16 at the Wayback Machine American Meteorological Society. Retrieved on 2008-01-22.
- ^ AEROGRAPHER'S MATE 1&C (2008). SHORT-RANGE EXTRAPOLATION. Integrated Publishing. Retrieved on 2008-01-22.
- ^ NOAA, ed. (September 3, 2007). Federal Meteorological Handbook (FMH) Number 2 (PDF). NOAA. p. C-17. Retrieved 26 November 2014.
- ^ Clouds Online (2012). "Cloud Atlas". Retrieved 1 February 2012.
- ^ JetStream (2003). Cloud type priority via Internet Wayback Machine. National Weather Service Southern Region Headquarters. Retrieved on 2007-05-17.
- ^ American Meteorological Society (2006). Map Symbols. Retrieved on 2008-01-22.
- ^ University of Wisconsin–Madison Department of Atmospheric and Ocean Sciences (1996). Air Masses and Fronts. Retrieved on 2008-01-22.
- ^ Frank Singleton (2000). Tides in the Atmosphere. Retrieved on 2007-05-16.
- ^ Dr P. M. Inness. Isobaric analysis and pressure tendency. Archived 2006-12-14 at the Wayback Machine Dr. Giles Harrison. Retrieved on 2008-01-22.
Station model
View on GrokipediaOverview
Definition and Purpose
The station model in meteorology is a compact graphical symbol that encodes multiple surface weather variables observed at a single reporting station, typically represented as a central circle with attached appendages, numerical values, and icons to summarize conditions efficiently on weather maps.[1] This standardized format draws from synoptic observation practices, where data such as temperature, pressure, wind, visibility, and cloud cover are plotted in designated positions around the circle.[3] The central circle itself denotes sky cover through shading or symbols, while surrounding elements include numerical digits for temperature and pressure, a flag-like system for wind, and pictorial symbols for present weather.[1] The primary purpose of the station model is to enable meteorologists to perform rapid visual assessments of weather patterns across large areas by integrating observations from numerous stations onto a single map, supporting synoptic-scale analysis essential for weather forecasting.[3] It is widely employed in operational meteorology for creating surface analysis charts, as well as in specialized applications like aviation weather reports (METARs) and marine forecasts, where quick interpretation of local conditions aids decision-making.[1] By standardizing the presentation of real-time data, the model facilitates the identification of broader atmospheric features, such as pressure gradients or moisture distributions, without overwhelming the map with raw textual data.[3] Key benefits of the station model include its ability to minimize visual clutter on densely populated weather maps, allowing for the simultaneous display of data from hundreds of stations while promoting intuitive pattern recognition, such as the alignment of wind shifts with frontal boundaries or pressure lows.[1] This efficiency enhances real-time data dissemination to forecasters, emergency responders, and the public, ultimately improving the accuracy and speed of weather predictions.[3] For instance, the encoded pressure values provide immediate context for geostential height patterns (detailed in relevant sections), underscoring the model's role in holistic meteorological interpretation.[1]History and Evolution
The meteorological station model originated in the late 19th century as part of efforts to standardize symbols for weather maps, building on earlier symbolic representations developed by pioneers like Luke Howard, who in 1803 introduced simple line-based icons for cloud types such as cirrus and cumulus.[5] These early symbols evolved through international collaboration, with the 1873 establishment of the International Meteorological Organization (IMO) by the Vienna Congress marking a key step in unifying weather notation across nations.[6] British meteorologist Sir Napier Shaw further advanced weather map practices in the 1910s through his influential works, including "The Weather Map: An Introduction to Modern Meteorology" (1918), which emphasized systematic plotting of observations to depict synoptic conditions.[7] Standardization accelerated in the mid-20th century, with the U.S. Weather Bureau adopting consistent station model formats for surface weather maps by the 1940s, as evidenced in daily analyses from 1945 that integrated frontal systems and coded observations.[5] The formation of the World Meteorological Organization (WMO) in 1950, succeeding the IMO, led to the formal integration of the SYNOP code (FM-12) into station models during the 1950s, enabling efficient global exchange of surface weather data through standardized numerical reporting.[8] This WMO framework, outlined in its Technical Regulations of 1951, ensured that elements like wind, pressure, and weather were plotted uniformly, facilitating synoptic forecasting.[9] The evolution from manual to digital plotting began in the 1980s with the development of the Advanced Weather Interactive Processing System (AWIPS), initiated by the National Weather Service in 1983 and tested in forecast offices by the late 1980s, allowing automated ingestion and visualization of station data.[10] Full deployment of AWIPS in the 1990s marked a shift toward computer-assisted mapping, reducing manual labor while preserving the core station model layout.[11] Concurrently, the introduction of Automated Surface Observing Systems (ASOS) in the 1990s by the National Weather Service and Federal Aviation Administration automated data collection at thousands of stations, integrating SYNOP-compatible reports into models for real-time aviation and forecasting needs.[12] In the satellite era post-2000, reliance on traditional station models diminished with the rise of remote sensing, yet they remain essential for aviation and ground-truth validation, as affirmed in WMO guidelines.[5] Modern adaptations include enhanced ASOS capabilities for climate monitoring, such as extended parameter logging for long-term trends in temperature and precipitation, supporting WMO efforts to track climate change impacts without altering the fundamental model structure.[13]International Standards and Variations
The World Meteorological Organization (WMO) defines international standards for station models primarily through the FM 12 SYNOP code, a numerical format for surface synoptic observations that ensures uniform global reporting of meteorological data. This code structures observations into mandatory and optional sections, with Section 1 requiring core elements such as wind direction and speed (coded as Nddff or 1ddff), air temperature (1snTTT), station-level pressure (3PoPoPoPo), and sea-level pressure (4PPPP), while visibility, cloud base height, and basic cloud cover are also included as essential for synoptic charts. Clouds and present weather details, such as type and intensity, are treated as optional, with present weather in Section 1 and cloud details in Section 8, allowing members to include them based on operational needs and data availability. These standards, outlined in the WMO Manual on Codes (WMO-No. 306, Volume I.1), facilitate the plotting of station models on weather maps for international exchange and analysis.[14] Regional variations adapt these standards to local practices while maintaining compatibility with SYNOP. In the United States, the National Weather Service (NWS) denotes calm winds (less than 1 knot) with a full circle encircling the sky cover symbol, differing from variable wind depictions elsewhere. European national services, such as those in Germany and France, emphasize plotting sea-level pressure with full decimal precision (e.g., 1013.2 hPa) to support detailed isobar analysis on synoptic charts. For aviation purposes, METAR (Meteorological Aerodrome Report) data—formatted under WMO FM 15—is routinely decoded and integrated into station models, plotting wind, visibility, present weather, and altimeter settings in a compact format for airport weather depictions.[1][15] Specialized station models extend the SYNOP framework for domain-specific applications. Upper-air variants, derived from radiosonde observations (WMO FM 96 TEMP), plot geopotential height above the station circle and temperature to the upper left at mandatory pressure levels like 850 hPa and 500 hPa, enabling hodograph and skew-T analyses. Marine station models, based on FM 13 SHIP codes, incorporate wave parameters such as significant wind-wave height (HwHw in half-meters) plotted below the temperature, essential for oceanographic charts. Adaptations for extreme environments include enhancements for tropical cyclones, where models may prioritize rapid-updating wind and pressure data under regional tropical cyclone warning systems, and polar regions, which account for ice cover and low visibility in automated observations; the International Maritime Meteorological Archive (IMMA) format further supports historical reanalysis by archiving legacy ship data in a flexible structure compatible with modern plotting.[16][17][18] Encoding differences underscore practical divergences in implementation. International SYNOP enforces metric units—wind speed in meters per second (or knots via indicator), pressure in hectopascals, and visibility in meters—while U.S. models often retain imperial conventions like knots for wind and statute miles for visibility in NWS products. Symbol variations appear in present weather depictions; for instance, the UK Met Office employs distinct icons for precipitation types, such as shaded drops for rain and asterisks for snow, integrated into their synoptic analyses.[19][20]Plotting Conventions
Station Location and Identification
In meteorological station models, the location of a weather observation site is typically marked by a small circle or dot on a synoptic map, representing the precise geographic position where measurements are taken. This marking allows for the spatial arrangement of data points across a region, with latitude and longitude coordinates implied by the map's scale and projection rather than explicitly plotted within the model itself. For stations situated above sea level, elevation is occasionally noted adjacent to the station identifier to provide context for pressure adjustments, though detailed units for such notations are covered in measurement conventions.[21] Station identification is achieved by plotting a unique alphanumeric code near the circle, most commonly a four-digit ICAO (International Civil Aviation Organization) identifier for land-based stations, particularly those at airports, which facilitates global standardization and quick reference. The station is typically marked by a circle; some national services, such as the UK Met Office, use a triangle for automated stations to distinguish observation methods, ensuring analysts can assess data reliability based on human versus instrumental collection. These identifiers and symbols are positioned consistently, often in the lower right of the plot, to maintain uniformity across maps.[22][23] On weather maps, station models are integrated by placing them relative to isobars, fronts, and pressure centers, enabling meteorologists to interpolate patterns such as temperature gradients or wind shifts. Clustering of stations in densely populated urban areas, as seen in regional analyses, highlights spatial variations like the urban heat island effect, where proximate plots reveal elevated temperatures compared to rural counterparts. This positioning aids in visualizing meso-scale phenomena without overwhelming the map.[21][24] Special cases adapt these conventions for non-traditional sites. For airport stations, the ICAO code often incorporates runway orientation implicitly through aviation-specific metadata, though the core model remains standard. Remote or mobile platforms, such as drifting buoys, deployed since the late 1970s as part of programs like NOAA's Global Drifter Program, utilize GPS-enabled positioning for real-time location updates and are identified by satellite-linked WMO (World Meteorological Organization) block numbers, allowing their plots to track oceanic or transient observations dynamically.Units and Measurement Scales
The World Meteorological Organization (WMO) establishes standardized units for meteorological observations in station models to promote global consistency and interoperability of data. These standards prioritize the International System of Units (SI), with wind speed measured in meters per second (m/s), temperature in degrees Celsius (°C), atmospheric pressure in hectopascals (hPa), and visibility in kilometers (km).[19] Non-SI alternatives, such as knots for wind speed and inches of mercury (inHg) for pressure, are permitted in specific contexts but must be convertible to SI equivalents.[19] In station models, wind speed is commonly reported in knots, where 1 knot equals approximately 0.514 m/s, facilitating aviation and maritime applications.[25] Temperature and dew point are expressed in °C, though Fahrenheit (°F) may appear in regional plots, particularly in the United States, with conversions such as 0°C equaling 32°F.[19] Pressure is typically given in hPa for sea-level equivalents, while visibility uses km internationally but statute miles in U.S. aviation reports, where 1 statute mile approximates 1.609 km.[26] Measurement scales in station models account for environmental adjustments to ensure comparability across elevations and locations. Pressure is routinely reduced to sea level (SLP) using WMO-specified methods, reported in hPa to represent hypothetical values at mean sea level for synoptic analysis.[19] Geopotential heights, used for upper-air levels, are scaled in geopotential meters (gpm), where 1 gpm equals the work against gravity for a 1 kg mass over 1 meter under standard conditions, differing slightly from geometric meters by about 0.3% at sea level.[19] Regional preferences reflect operational needs while aligning with WMO guidelines; for instance, SI metric units dominate globally, but U.S. aviation employs statute miles for visibility and inHg for altimeter settings (1 inHg ≈ 33.86 hPa).[26] Rounding rules maintain precision without excessive detail: temperatures and dew points are rounded to the nearest whole degree °C, pressures to 0.1 hPa, and wind directions to the nearest 10°.[19][27] These conventions support accurate data encoding and decoding in both traditional and digital formats.[19]Symbols, Abbreviations, and Encoding
The station model employs a standardized set of graphical symbols to represent meteorological observations concisely on weather charts. These symbols, developed under international guidelines, allow meteorologists to plot data from reports like SYNOP codes visually. Core symbols include wind barbs and pennants attached to a central circle, where a full pennant represents 50 knots of wind speed, a long barb 10 knots, and a short barb 5 knots, with the tail (shaft) pointing toward the direction from which the wind is blowing.[1][28] For sky cover, the central circle is shaded in increments of eighths (oktas), with an empty circle indicating clear skies (0/8), partial shading for scattered or broken clouds, and a fully filled circle for overcast conditions (8/8); a ninth category uses a filled circle with a cross for sky obscured.[1][28] Present weather conditions are depicted using international symbols, such as dots for rain, triangles for snow, and comma shapes for drizzle, positioned below the central circle when significant precipitation or visibility reduction occurs.[1] These graphical icons derive from WMO code tables, where present weather (ww) is first encoded alphanumerically before plotting; for instance, code 60 represents light rain, visualized as slanted lines or drops.[28] Abbreviations for weather phenomena, standardized in WMO Table 4678, include FG for fog (visibility ≤1 km in haze), BR for mist (visibility 1-10 km), RA for rain, SN for snow, and TS for thunderstorm, often combined like -RA for light rain or +SNRA for heavy snow mixed with rain.[28] These textual codes may appear near symbols in detailed plots or digital representations. Encoding rules ensure compact representation of numerical data. Pressure is encoded using the last three digits of sea-level pressure in hectopascals, omitting the leading 9 or 10; for example, 1013 hPa is plotted as 013, with the decimal point's position indicating tenths—such as 1013.2 hPa as 132 or 1009.8 hPa as 098.[1][28] Temperature and dew point are placed to the upper and lower left of the circle, respectively, in whole degrees, with a decimal point shown as a small flag if values are below zero (e.g., -5°C as 5 with a flag). The wind shaft extends from the circle in the direction from which the wind is blowing, with direction reported in 10-degree increments.[1] Since the 1990s, automated systems have increasingly used BUFR (Binary Universal Form for the Representation of meteorological data) for digital encoding of station observations, allowing efficient machine-readable transmission of the same symbolic data in binary format per WMO standards.[29][30] Common errors in interpreting station models include confusing full barbs (10 knots) with half barbs (5 knots), leading to wind speed miscalculations, or overlooking the directional convention where barbs point downwind.[1] Variations arise between hand-drawn plots, which may use stylized symbols, and software-generated ones, where precise shading and line weights adhere strictly to digital standards but can appear less intuitive without training.[1] Adherence to WMO guidelines minimizes these issues, ensuring global consistency in data portrayal.[28]Surface Weather Elements
Wind Direction and Speed
In the station model, wind direction and speed form a critical dynamic component, plotted as a barb extending outward from the central station circle. The direction is indicated by the orientation of the barb's shaft, which points toward the compass direction from which the wind is blowing, using a 360-degree scale or 36-point compass notation (e.g., 180° for a southerly wind). This convention ensures that the wind's origin is clearly visualized relative to the station location.[31] Wind speed is encoded along the barb through a series of symbolic flags positioned on its outer end, with values rounded to the nearest 5 knots for clarity. A full triangular flag (pennant) represents 50 knots, a long solid line (full barb) denotes 10 knots, and a short line (half barb) indicates 5 knots; these are combined additively for total speed (e.g., 65 knots as one pennant plus one full barb plus one half barb). For calm winds (0 knots), a solid circle is drawn around the station circle, while variable winds are often marked by an absent barb with directional ambiguity noted as variable (VRB) in textual reports or supplemental annotations. Gusts exceeding 10 knots are typically reported separately in textual data or as supplemental numerical annotations rather than integrated into the barb.[1][31][32] These plotting elements enable meteorologists to rapidly assess wind patterns across a weather map. For instance, a 20-knot southerly wind appears as two full barbs (20 knots total) on a shaft aligned at 180°, facilitating the identification of convergence—where winds flow toward a common point, often signaling uplift and potential storm development—or divergence, where winds spread outward, indicating subsidence and clearer conditions. Such interpretations are essential for analyzing synoptic-scale atmospheric flow and forecasting weather evolution.[1][33]Visibility and Present Weather
In the station model, visibility represents the horizontal distance at which prominent objects can be seen and is plotted as a numeric value below the central station circle. It is typically reported in statute miles in the United States or kilometers internationally, with values omitted if exceeding 10 miles (16 km) to indicate clear conditions. Reduced visibility, often below 1 km (or 0.6 miles), is caused by atmospheric phenomena such as fog or haze and may be denoted with a specific low-visibility indicator or the associated weather symbol if extremely limited.[1][15] Present weather depicts ongoing meteorological conditions at the observation time and is symbolized inside or adjacent to the station circle, using standardized graphical icons derived from WMO code tables. For precipitation like rain, symbols consist of three vertical drops, with drizzle shown as smaller, finer drops; intensity levels—light, moderate, or heavy—are indicated by the number of drops, line thickness, or shading density. Thunderstorms are represented by a cloud with a lightning bolt, potentially combined with precipitation symbols for associated rain or hail.[32][28] Non-precipitation phenomena affecting visibility are also encoded with distinct symbols near the circle. Fog appears as scattered or dense dots, haze as a shaded veil or fine lines, while dust and smoke are depicted as swirling lines or plumes, with intensity conveyed through symbol density or qualifiers in the underlying WMO codes (e.g., Code Table 4677 for ww). These elements, drawn from WMO Appendix I, prioritize the most significant condition observed.[28][34][35] Visibility and present weather data are crucial for aviation safety, maritime navigation, and public warnings, as low visibility combined with adverse weather can impair transportation and increase accident risks; international standards ensure consistent reporting across global observing networks.[28][32]Cloud Cover and Types
In the station model, cloud cover is depicted through the shading of a central circle, which represents the total fraction of the sky obscured by clouds, quantified in oktas (eighths) according to World Meteorological Organization (WMO) standards. An empty circle indicates clear skies (0/8 oktas), while progressive shading—from dotted or light fills for 1-3 oktas to denser patterns for 4-7 oktas—reflects increasing coverage, culminating in a fully shaded circle for overcast conditions (8/8 oktas). A separate symbol, such as cross-hatching, denotes sky obscured (9 oktas), often due to dense fog or precipitation preventing observation. This visual encoding, rooted in WMO code table 0501, facilitates rapid assessment of sky conditions on synoptic charts.[36][32] Cloud types are illustrated using standardized symbols positioned above the central circle, with placement distinguishing vertical layers to convey the structure of the cloud deck. Low-level clouds (typically below 2 km altitude) are plotted nearest the circle using simple icons, such as wavy lines for stratus or rounded shapes for cumulus; middle-level clouds (2-7 km) appear above them with more varied forms like lens-shaped for altocumulus; and high-level clouds (above 5 km) are shown at the top, often as filamentary wisps for cirrus or banded lines for cirrostratus. These symbols derive from WMO code tables 0513 (low, CL), 0515 (middle, CM), and 0509 (high, CH), prioritizing the predominant type per layer if multiple occur, as per synoptic reporting in FM 12 SYNOP format. Only significant convective types, like cumulonimbus (towering anvil symbol), are emphasized when present, overriding others in the same layer.[36][37] Cloud base heights, when available, supplement these depictions with numerical values from ceilometer measurements, reported in hundreds of feet (e.g., 005 for 500 ft) following common conventions like those in the United States; internationally, WMO SYNOP may use coded groups such as h in section 3 for approximate ranges.[37] This optional data highlights the lowest cloud layer's elevation, aiding interpretation of vertical extent—such as low ceilings under overcast stratus indicating stable, moist boundary layers prone to persistent cover. In regions with advanced observing networks, satellite-derived cloud type validations since the early 2000s have refined these reports by correlating visual symbols with infrared imagery for high-altitude features like thin cirrus, improving accuracy in climate and forecast models.[36][38]Atmospheric State Parameters
Temperature and Dew Point
In meteorological station models, the air temperature is conventionally plotted to the upper left of the central station circle as a two-digit whole number representing degrees Celsius in international standards, though Fahrenheit is used in some national contexts like the United States. The dew point temperature, which indicates the temperature at which air becomes saturated with moisture, is plotted directly below the air temperature in the lower left position, also typically as a two-digit whole number in degrees Celsius. In World Meteorological Organization (WMO) conventions, the dew point may incorporate tenths of a degree through specific coding in the underlying SYNOP format, though plotting often rounds to whole numbers for clarity; for example, values of 25°C air temperature and 20°C dew point would appear as 25 stacked above 20 to the left of the circle. These positions allow meteorologists to quickly assess near-surface thermal conditions and moisture levels when analyzing synoptic charts. The dew point temperature is derived from measurements using instruments such as the sling psychrometer or aspiration psychrometer, which compare the dry-bulb temperature (ambient air temperature) with the wet-bulb temperature (cooled by evaporation from a wetted wick). The difference, known as the wet-bulb depression, is used to compute the dew point via established psychrometric relations that account for vapor pressure over water or ice, ensuring accurate representation of atmospheric moisture content. If the air temperature equals the dew point, the relative humidity is 100%, signifying saturation and potential for fog or dew formation. Modern automated weather stations, employing platinum resistance thermometers and capacitive humidity sensors, have improved measurement precision since the 2010s, achieving accuracies of ±0.5°C for both air temperature and dew point under standard conditions. These parameters in the station model are significant for evaluating human comfort and weather hazards, as the dew point directly reflects the absolute moisture in the air independent of temperature; dew points exceeding 20°C often produce muggy conditions that exacerbate heat stress, while lower values indicate drier air conducive to clearer skies. Although not explicitly plotted, derived metrics like the heat index—combining air temperature and dew point to quantify perceived heat—and wind chill—factoring air temperature and wind speed for cold conditions—can be computed from station model data to assess thermal extremes. Units for these temperatures are standardized as Celsius in WMO guidelines, with conversions applied for regional maps as detailed in plotting conventions.Pressure and Geopotential Height
In the station model, sea level pressure is a key parameter representing the atmospheric pressure adjusted to mean sea level, enabling consistent comparison across varying elevations. It is encoded in the international SYNOP code (FM 12-IX) using the five-character group 4PPPP, where the leading "4" identifies the group and PPPP consists of four digits denoting the pressure in tenths of a hectopascal (hPa), with the thousands digit omitted for values typically between 900 and 1050 hPa. For instance, a sea level pressure of 1013.2 hPa is encoded as 40132.[39] This encoding derives from the World Meteorological Organization (WMO) standards for surface synoptic observations, ensuring compact transmission of data from land stations. On surface weather maps, the sea level pressure value is plotted in the upper-right quadrant of the station circle as three digits, corresponding to the last three digits of the encoded value, with an implied decimal point before the final digit and a leading "10" or "9" added for interpretation. Examples include 132 for 1013.2 hPa or 876 for 987.6 hPa.[1] This plotting convention facilitates the manual or automated drawing of isobars, which delineate pressure gradients critical for identifying high- and low-pressure systems, fronts, and associated weather patterns. For stations at high elevations, where the reduction to sea level may introduce significant uncertainty due to sparse temperature data in complex terrain, station pressure—the actual measured pressure at the site's elevation—is sometimes reported and plotted instead.[19] The reduction of station pressure to sea level pressure employs a hypsometric adjustment based on the ideal gas law, approximated in standard practice using the station elevation, mean temperature in the atmospheric column, and gravitational effects; however, in operational plotting, simplified assumptions or empirical corrections are applied to avoid detailed computations.[19] Historically, pressure was expressed in millibars (mb), a unit numerically equivalent to hPa but phased out in favor of the SI-compliant hectopascal following WMO's adoption in 1954, with full international transition largely complete by the 1980s. In upper-air station models, used on constant-pressure analysis charts (e.g., 500 hPa or 850 hPa levels), geopotential height replaces sea level pressure to indicate the elevation of the specified pressure surface above mean sea level, accounting for variations in gravity. This height is plotted in the upper-left quadrant of the station circle as three digits in decameters (dam), such as 552 for 5520 geopotential meters (gpm), approximating the physical height for practical purposes.[40] Geopotential height data originate from radiosonde observations encoded in the TEMP code (FM 35), where heights are reported relative to standard levels in geopotential units to reflect the work done against gravity. These values form the basis for contouring height fields on upper-air maps, revealing jet streams, troughs, and ridges that influence surface weather dynamics, with contours analogous to isobars on surface charts.[41]Pressure Tendency and Trends
In the station model, pressure tendency refers to the change in atmospheric pressure over the preceding three hours, providing insight into short-term dynamic weather evolution. This element is plotted below the central circle and consists of two components: a graphical symbol depicting the characteristic pattern of the pressure change and a two-digit numerical value indicating the magnitude of the total change in tenths of hectopascals (hPa). The numerical value, such as "25," represents a 2.5 hPa change, with the sign determined by the accompanying symbol—positive for rises and negative for falls.[1][21] The symbols follow World Meteorological Organization (WMO) standards for SYNOP code section 3, which categorize the pressure characteristic into nine types (codes 0 through 8), visually represented as simplified barograph traces to show whether the pressure has been steady, continuously rising or falling, or exhibited erratic behavior such as rising then falling. For instance, a steady rise is depicted by a rising line, while a fall followed by a steady period uses a falling line with a horizontal segment. These symbols distinguish between uniform trends (e.g., continuous increase) and variable ones (e.g., decreasing then increasing), aiding meteorologists in assessing the stability of pressure systems.[42][2] Interpretation of pressure tendency focuses on its implications for weather patterns: a rising tendency, such as +3.0 hPa over three hours, typically signals improving conditions like clearing skies associated with approaching high-pressure systems, whereas a falling tendency, like -2.5 hPa, suggests deteriorating weather, often indicating an advancing low-pressure area. A steep fall exceeding 3 hPa in three hours, for example, may warn of an intensifying cyclone or frontal passage. This data derives from 3-hourly surface synoptic observations, enabling real-time analysis of pressure gradients on weather charts.[23][2][43] While the primary focus is on three-hour intervals, some specialized models extend trends to 24 hours for broader context, though the core station model adheres to the shorter period for operational forecasting. The rate is expressed in hPa per three hours, emphasizing recent dynamics over long-term averages.[1]Additional Observations
Past Weather
In the station model, past weather is indicated by two symbols plotted to the lower right of the central circle, where the symbol closest to the circle denotes the most significant weather conditions (corresponding to SYNOP code W1) and the symbol farther denotes the second most significant (SYNOP code W2) during the past 3 or 6 hours preceding the observation, depending on the synoptic time. These symbols provide a qualitative summary of notable weather events, such as precipitation or obstructions to visibility, without specifying intensity or duration. For example, a raindrop symbol followed by a sun symbol would indicate clearing conditions with earlier rainfall as the two most significant events in the period.[44]/09%3A_Weather_Reports_and_Map_Analysis/9.02%3A_Synoptic_Weather_Maps) The codes for W1 and W2 follow World Meteorological Organization (WMO) Code Table 4561, which prioritizes the most and second-most significant phenomena observed during the period, with W1 typically assigned the higher or equal code value to W2. Codes 0–2 relate to cloud cover variations and are often not plotted as symbols, while higher codes represent more impactful events like precipitation or storms. The following table summarizes the code meanings:| Code | Description |
|---|---|
| 0 | Cloud covering ½ or less of the sky throughout the period |
| 1 | Cloud covering more than ½ of the sky during part of the period |
| 2 | Cloud covering more than ½ of the sky throughout the period |
| 3 | Sandstorm, dust storm, or blowing snow |
| 4 | Fog, ice fog, or thick haze |
| 5 | Dust or sand raised by wind |
| 6 | Moderate or heavy drizzle, rain, snow, or sleet; or moderate or heavy showers thereof |
| 7 | Moderate or heavy rain, snow, or sleet showers; or moderate or heavy intermittent falls thereof |
| 8 | Thunderstorm during the period, with or without precipitation |
| 9 | Thunderstorm combined with dust storm or sand storm during the period |