| ||||||||||||||||||||
| Turnout | 52.38% | |||||||||||||||||||
|---|---|---|---|---|---|---|---|---|---|---|---|---|---|---|---|---|---|---|---|---|
| ||||||||||||||||||||


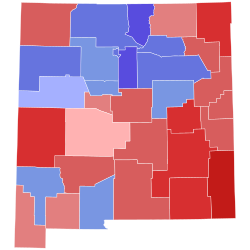
Lujan Grisham: 40–50% 50–60% 60–70% 70–80% 80–90% >90% Ronchetti: 40–50% 50–60% 60–70% 70–80% 80–90% >90% Tie: 40–50% No data | ||||||||||||||||||||
| ||||||||||||||||||||
| Elections in New Mexico |
|---|
 |
The 2022 New Mexico gubernatorial election took place on November 8, 2022, to elect the governor and lieutenant governor of New Mexico. The election coincided with various other federal and state elections. Primary elections were held on June 7.[1]
Incumbent Democratic Governor Michelle Lujan Grisham won a second term by a margin of 6.38%. She was first elected in 2018 with 57.2% of the vote. Her opponent was Republican Mark Ronchetti, who was also his party's nominee in New Mexico's 2020 U.S. Senate election.
Despite losing, Ronchetti managed to carry a congressional district that elected Democrat Gabe Vasquez in the concurrent U.S. House elections. This was the first gubernatorial election in New Mexico since 1986 in which the winner was from the same party as the incumbent president, and the first time since 1978 that it was a Democrat.
Organizations
| Party | Candidate | Votes | % | |
|---|---|---|---|---|
| Democratic | Michelle Lujan Grisham (incumbent) | 125,238 | 100.0% | |
| Total votes | 125,238 | 100.0% | ||
| Party | Candidate | Votes | % | |
|---|---|---|---|---|
| Democratic | Howie Morales (incumbent) | 117,293 | 100.0% | |
| Total votes | 117,293 | 100.0% | ||
Aggregate polls
| Source of poll aggregation |
Dates administered |
Dates updated |
Jay Block |
Rebecca Dow |
Mark Ronchetti |
Greg Zanetti |
Other [a] |
Margin |
|---|---|---|---|---|---|---|---|---|
| Real Clear Politics[15] | April 29 – May 19, 2022 | May 23, 2022 | 10.0% | 13.0% | 44.5% | 9.5% | 23.0% | Ronchetti +31.5 |
| Poll source | Date(s) administered |
Sample size[b] |
Margin of error |
Jay Block |
Rebecca Dow |
Mark Ronchetti |
Greg Zanetti |
Other | Undecided |
|---|---|---|---|---|---|---|---|---|---|
| Research & Polling Inc.[16] | May 15–19, 2022 | 560 (LV) | ± 4.1% | 8% | 17% | 45% | 9% | 1%[c] | 21% |
| SurveyUSA[17] | April 29 – May 7, 2022 | 505 (LV) | ± 6.4% | 12% | 9% | 44% | 10% | 2%[d] | 23% |
| Public Opinion Strategies (R)[18][A] | January 31 – February 1, 2022 | 400 (LV) | ± 4.9% | 2% | 9% | 60% | 7% | 3% | 19% |

| Party | Candidate | Votes | % | |
|---|---|---|---|---|
| Republican | Mark Ronchetti | 68,658 | 58.41% | |
| Republican | Rebecca Dow | 18,185 | 15.47% | |
| Republican | Gregory Zanetti | 16,394 | 13.95% | |
| Republican | Jay Block | 12,469 | 10.61% | |
| Republican | Ethel Maharg | 1,845 | 1.57% | |
| Total votes | 117,551 | 100.0% | ||

| Party | Candidate | Votes | % | |
|---|---|---|---|---|
| Republican | Ant Thornton | 64,386 | 59.71% | |
| Republican | Peggy Muller-Aragon | 43,438 | 40.29% | |
| Total votes | 107,824 | 100.0% | ||
Endorsements
| Party | Candidate | Votes | % | |
|---|---|---|---|---|
| Libertarian | Karen Bedonie | 980 | 86.12% | |
| Libertarian | Ginger G. Grider (write-in) | 158 | 13.88% | |
| Total votes | 1,138 | 100.0% | ||
Travis Sanchez won the Libertarian primary unopposed, but withdrew to become the Libertarian nominee for New Mexico State Auditor.[21] Sanchez was replaced by Efren Gallardo Jr.
| Party | Candidate | Votes | % | |
|---|---|---|---|---|
| Libertarian | Travis Sanchez | 1,175 | 100.0% | |
| Total votes | 1,175 | 100.0% | ||
| Source | Ranking | As of |
|---|---|---|
| The Cook Political Report[23] | Lean D | June 8, 2022 |
| Inside Elections[24] | Tilt D | November 3, 2022 |
| Sabato's Crystal Ball[25] | Lean D | January 26, 2022 |
| Politico[26] | Lean D | April 1, 2022 |
| RCP[27] | Tossup | June 20, 2022 |
| Fox News[28] | Tossup | August 22, 2022 |
| 538[29] | Likely D | July 31, 2022 |
| Elections Daily[30] | Lean D | November 7, 2022 |
U.S. presidents
Federal officials
State officials
Local officials[35]
Labor unions
Organizations
U.S. presidents
Federal officials
State officials
Sheriffs
Organizations
Aggregate polls
| Source of poll aggregation |
Dates administered |
Dates updated |
Michelle Lujan Grisham (D) |
Mark Ronchetti (R) |
Karen Bedonie (L) |
Other [e] |
Margin |
|---|---|---|---|---|---|---|---|
| Real Clear Politics[56] | October 6–21, 2022 | October 21, 2022 | 47.0% | 43.5% | – | 9.5% | Lujan Grisham +3.5 |
| FiveThirtyEight[57] | June 14 – October 24, 2022 | October 24, 2022 | 48.7% | 41.1% | 4.9% | 5.3% | Lujan Grisham +7.6 |
| Average | 47.9% | 42.3% | – | 7.4% | Lujan Grisham +5.6 | ||
Graphical summary
This graph was using the legacy Graph extension, which is no longer supported. It needs to be converted to the new Chart extension. |
| Poll source | Date(s) administered |
Sample size[b] |
Margin of error |
Michelle Lujan Grisham (D) |
Mark Ronchetti (R) |
Karen Bedonie (L) |
Other | Undecided |
|---|---|---|---|---|---|---|---|---|
| Emerson College[58] | October 25–28, 2022 | 1,000 (LV) | ± 3.0% | 49% | 46% | 2% | <1%[f] | 3% |
| 50% | 48% | 2% | <1%[g] | – | ||||
| Research & Polling Inc.[59][h] | October 20–27, 2022 | 1,254 (LV) | ± 2.8% | 50% | 42% | 3% | – | 5% |
| SurveyUSA[60] | October 21–26, 2022 | 650 (LV) | ± 4.9% | 46% | 39% | 5% | – | 9% |
| The Trafalgar Group (R)[61] | October 19–21, 2022 | 1,077 (LV) | ± 2.9% | 46% | 47% | 4% | – | 4% |
| Public Policy Polling (D)[62] | October 6–7, 2022 | 806 (V) | ± 3.5% | 48% | 40% | 7% | – | 6% |
| SurveyUSA[63] | October 1–6, 2022 | 570 (LV) | ± 5.8% | 53% | 37% | 3% | – | 7% |
| Cygnal (R)[64][B] | September 27–29, 2022 | 400 (LV) | ± 4.9% | 46% | 44% | 5% | – | 5% |
| SurveyUSA[65] | September 8–12, 2022 | 558 (LV) | ± 5.7% | 48% | 36% | 5% | – | 11% |
| Emerson College[66] | September 8–11, 2022 | 1,000 (LV) | ± 3.0% | 48% | 43% | – | 3%[i] | 5% |
| Research & Polling Inc.[67][h] | August 19–25, 2022 | 518 (LV) | ± 4.3% | 47% | 40% | 5% | – | 8% |
| GQR Research (D)[68][C] | June 11–17, 2022 | 500 (LV) | ± 4.4% | 48% | 44% | 5% | – | 3% |
| Public Policy Polling (D)[69] | June 13–14, 2022 | 642 (V) | ± 3.9% | 45% | 42% | 9% | – | 5% |
| Public Opinion Strategies (R)[70][A] | June 11–14, 2022 | 600 (LV) | ± 4.0% | 45% | 46% | – | – | 9% |
| SurveyUSA[71] | April 29 – May 7, 2022 | 1,389 (LV) | ± 3.6% | 47% | 43% | – | – | 11% |
| Cygnal (R)[72][D] | January 3–4, 2022 | 531 (LV) | ± 4.2% | 43% | 42% | – | – | 16% |
Michelle Lujan Grisham vs. Jay Block
| Poll source | Date(s) administered |
Sample size[b] |
Margin of error |
Michelle Lujan Grisham (D) |
Jay Block (R) |
Undecided |
|---|---|---|---|---|---|---|
| SurveyUSA[71] | April 29 – May 7, 2022 | 1,389 (LV) | ± 3.6% | 47% | 37% | 16% |
Michelle Lujan Grisham vs. Rebecca Dow
| Poll source | Date(s) administered |
Sample size[b] |
Margin of error |
Michelle Lujan Grisham (D) |
Rebecca Dow (R) |
Undecided |
|---|---|---|---|---|---|---|
| SurveyUSA[71] | April 29 – May 7, 2022 | 1,389 (LV) | ± 3.6% | 48% | 36% | 16% |
| Cygnal (R)[72][D] | January 3–4, 2022 | 531 (LV) | ± 4.2% | 43% | 36% | 20% |
Michelle Lujan Grisham vs. Ethel Maharg
| Poll source | Date(s) administered |
Sample size[b] |
Margin of error |
Michelle Lujan Grisham (D) |
Ethel Maharg (R) |
Undecided |
|---|---|---|---|---|---|---|
| SurveyUSA[71] | April 29 – May 7, 2022 | 1,389 (LV) | ± 3.6% | 48% | 32% | 19% |
Michelle Lujan Grisham vs. Gregory Zanetti
| Poll source | Date(s) administered |
Sample size[b] |
Margin of error |
Michelle Lujan Grisham (D) |
Gregory Zanetti (R) |
Undecided |
|---|---|---|---|---|---|---|
| SurveyUSA[71] | April 29 – May 7, 2022 | 1,389 (LV) | ± 3.6% | 48% | 36% | 16% |
| Cygnal (R)[72][D] | January 3–4, 2022 | 531 (LV) | ± 4.2% | 43% | 38% | 21% |
Michelle Lujan Grisham vs. generic Republican
| Poll source | Date(s) administered |
Sample size[b] |
Margin of error |
Michelle Lujan Grisham (D) |
Generic Republican |
Undecided |
|---|---|---|---|---|---|---|
| Cygnal (R)[73] | July 6–8, 2021 | 600 (LV) | ± 4.0% | 45% | 47% | 7% |
| No. | Date | Host | Moderator | Link | Democratic | Republican | Libertarian |
|---|---|---|---|---|---|---|---|
| Key:
P Participant A Absent N Non-invitee I Invitee W Withdrawn |
|||||||
| Michelle Lujan Grisham | Mark Ronchetti | Karen Bedonie | |||||
| 1 | Oct. 13, 2022 | KOAT-TV | Doug Fernandez | [74] | P | P | N |

| Party | Candidate | Votes | % | ±% | |
|---|---|---|---|---|---|
| Democratic |
|
370,168 | 51.97% | −5.23% | |
| Republican |
|
324,701 | 45.59% | +2.79% | |
| Libertarian |
|
17,387 | 2.44% | N/A | |
| Total votes | 712,256 | 100.0% | |||
| Turnout | 714,797 | 52.38% | |||
| Registered electors | 1,364,559 | ||||
| Democratic hold | |||||
By county
| ||||||||||||||||||||||||||||||||||||||||||||||||||||||||||||||||||||||||||||||||||||||||||||||||||||||||||||||||||||||||||||||||||||||||||||||||||||||||||||||||||||||||||||||||||||||||||||||||||||||||||||||||||||||||||||||||||||||||||||||||||||||||||||||||||||||||||||||||||||||||
|---|---|---|---|---|---|---|---|---|---|---|---|---|---|---|---|---|---|---|---|---|---|---|---|---|---|---|---|---|---|---|---|---|---|---|---|---|---|---|---|---|---|---|---|---|---|---|---|---|---|---|---|---|---|---|---|---|---|---|---|---|---|---|---|---|---|---|---|---|---|---|---|---|---|---|---|---|---|---|---|---|---|---|---|---|---|---|---|---|---|---|---|---|---|---|---|---|---|---|---|---|---|---|---|---|---|---|---|---|---|---|---|---|---|---|---|---|---|---|---|---|---|---|---|---|---|---|---|---|---|---|---|---|---|---|---|---|---|---|---|---|---|---|---|---|---|---|---|---|---|---|---|---|---|---|---|---|---|---|---|---|---|---|---|---|---|---|---|---|---|---|---|---|---|---|---|---|---|---|---|---|---|---|---|---|---|---|---|---|---|---|---|---|---|---|---|---|---|---|---|---|---|---|---|---|---|---|---|---|---|---|---|---|---|---|---|---|---|---|---|---|---|---|---|---|---|---|---|---|---|---|---|---|---|---|---|---|---|---|---|---|---|---|---|---|---|---|---|---|---|---|---|---|---|---|---|---|---|---|---|---|---|---|---|---|---|---|---|---|---|---|---|---|---|---|---|---|---|---|---|---|
Counties that flipped from Democratic to Republican | ||||||||||||||||||||||||||||||||||||||||||||||||||||||||||||||||||||||||||||||||||||||||||||||||||||||||||||||||||||||||||||||||||||||||||||||||||||||||||||||||||||||||||||||||||||||||||||||||||||||||||||||||||||||||||||||||||||||||||||||||||||||||||||||||||||||||||||||||||||||||
Lujan Grisham won two of three congressional districts, with Ronchetti winning the remaining one, which elected a Democrat.[77]
| District | Lujan Grisham | Ronchetti | Representative |
|---|---|---|---|
| 1st | 53% | 45% | Melanie Stansbury |
| 2nd | 48% | 49% | Yvette Herrell (117th Congress) |
| Gabe Vasquez (118th Congress) | |||
| 3rd | 54% | 44% | Teresa Leger Fernandez |
Partisan clients
{{cite news}}: CS1 maint: bot: original URL status unknown (link)
Official campaign websites