Hubbry Logo
Color solidColor solidMain
Open search
Color solid
Community hub
Color solid
logo
8 pages, 0 posts
0 subscribers
Be the first to start a discussion here.
Color solid
Color solid
from Wikipedia

Side-by-side comparison of several different color solids for the HSL, HSV, and RGB color models. Potential shapes include cubes, cylinders, cones, spheres, pyramids, bipyramids, bicones, and irregular shapes.
Painters long mixed colors by combining relatively bright pigments with black and white. Mixtures with white are called tints, mixtures with black are called shades, and mixtures with both are called tones. See Tints and shades.[1]
Optimal color solid plotted within the CIE L* a* b* color space (left or top), and within the CIE L* u* v* color space (right or bottom), both with D65 white point. Because they are (approximately) perceptually uniform color spaces, the optimal color solids have an irregular, not spherical shape. Notice they have two sharp edges, one edge with warm colors, and the other edge with cool colors.

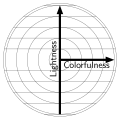
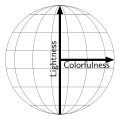
A color solid is the three-dimensional representation of a color space or model and can be thought as an analog of, for example, the one-dimensional color wheel, which depicts the variable of hue (similarity with red, yellow, green, blue, etc.); or the 2D chromaticity diagram (or the color triangle), which depicts the variables of hue and spectral purity. The added spatial dimension allows a color solid to depict the three dimensions of color: lightness (gradations of light and dark, tints or shades), hue, and colorfulness, allowing the solid to depict all conceivable colors in an organized three-dimensional structure.

Organization

[edit]
Munsell Color Tree

Different color theorists have each designed unique color solids. Many are in the shape of a sphere, whereas others are warped three-dimensional ellipsoid figures—these variations being designed to express some aspect of the relationship of the colors more clearly. The color spheres conceived by Philipp Otto Runge and Johannes Itten are typical examples and prototypes for many other color solid schematics.[2]

As in the color wheel, contrasting (or complementary) hues are located opposite each other in most color solids. Moving toward the central axis, colors become less and less saturated, until all colors meet at the central axis as a neutral gray. Moving vertically in the color solid, colors become lighter (toward the top) and darker (toward the bottom). At the upper pole, all hues meet in white; at the bottom pole, all hues meet in black.

The vertical axis of the color solid, then, is gray all along its length, varying from black at the bottom to white at the top, it is a grayscale. All pure (saturated) hues are located on the surface of the solid, varying from light to dark down the color solid. All colors that are desaturated in any degree (that is, that they can be though of containing both black and white in varying amounts) comprise the solid's interior, likewise varying in brightness from top to bottom.

Optimal color solid

[edit]

The optimal color solid or RöschMacAdam color solid is a type of color solid that contains all the possible colors that surfaces can have. That is, the optimal color solid is the theoretical limit for the color of objects*. It is bounded by the set of all optimal colors.[3] For now, we are unable to produce objects with such colors, at least not without recurring to more complex physical phenomena.

*(with classical reflection. Phenomena like fluorescence or structural coloration may cause the color of objects to lie outside the optimal color solid)

The reflectance spectrum of a color is the amount of light of each wavelength that it reflects, in proportion to a given maximum, which has the value of 1 (100%). If the reflectance spectrum of a color is 0 (0%) or 1 (100%) across the entire visible spectrum, and it has no more than two transitions between 0 and 1, or 1 and 0, then it is an optimal color. With the current state of technology, we are unable to produce any material or pigment with these properties.[4]

Thus four types of "optimal color" spectra are possible:

  • The transition goes from zero at both ends of the spectrum to one in the middle, as shown in the image at right.
  • It goes from one at the ends to zero in the middle.
  • It goes from 1 at the start of the visible spectrum to 0 in some point in the middle until its end.
  • It goes from 0 at the start of the visible spectrum to 1 at some point in the middle until its end.

The first type produces colors that are similar to the spectral colors and follow roughly the horseshoe-shaped portion of the CIE xy chromaticity diagram (the spectral locus), but are, in surfaces, more chromatic, although less spectrally pure. The second type produces colors that are similar to (but, in surfaces, more chromatic and less spectrally pure than) the colors on the straight line in the CIE xy chromaticity diagram (the line of purples), leading to magenta or purple-like colors.

Reflectance spectrum of a color-optimal surface. There is no known material with these properties, they are, for what we know, only theoretical.[5]

In optimal color solids, the colors of the visible spectrum are theoretically black, because their reflectance spectrum is 1 (100%) in only one wavelength, and 0 in all of the other infinite visible wavelengths that there are, meaning that they have a lightness of 0 with respect to white, and will also have 0 chroma, but, of course, 100% of spectral purity. In short: In optimal color solids, spectral colors are equivalent to black (0 lightness, 0 chroma), but have full spectral purity (they are located in the horseshoe-shaped spectral locus of the chromaticity diagram).[5]

In linear color spaces, such as LMS or CIE 1931 XYZ, the set of rays that start at the origin (black, (0, 0, 0)) and pass through all the points that represent the colors of the visible spectrum, and the portion of a plane that passes through the violet half-line and the red half-line (both ends of the visible spectrum), generate the "spectrum cone". The black point (coordinates (0, 0, 0)) of the optimal color solid (and only the black point) is tangent to the "spectrum cone", and the white point ((1, 1, 1)) (only the white point) is tangent to the "inverted spectrum cone", with the "inverted spectrum cone" being symmetrical to the "spectrum cone" with respect to the middle gray point ((0.5, 0.5, 0.5)). This means that, in linear color spaces, the optimal color solid is centrally symmetric.[5]

In most color spaces, the surface of the optimal color solid is smooth, except for two points (black and white); and two sharp edges: the "warm" edge, which goes from black, to red, to orange, to yellow, to white; and the "cool" edge, which goes from black, to deep violet, to blue, to cyan, to white. This is due to the following: If the portion of the reflectance spectrum of a color is spectral red (which is located at one end of the spectrum), it will be seen as black. If the size of the portion of total or reflectance is increased, now covering from the red end of the spectrum to the yellow wavelengths, it will be seen as red. If the portion is expanded even more, covering the green wavelengths, it will be seen as orange or yellow. If it is expanded even more, it will cover more wavelengths than the yellow semichrome does, approaching white, until it is reached when the full spectrum is reflected. The described process is called "cumulation". Cumulation can be started at either end of the visible spectrum (we just described cumulation starting from the red end of the spectrum, generating the "warm" sharp edge), cumulation starting at the violet end of the spectrum will generate the "cool" sharp edge.[5]

Optimal color solid or Rösch–MacAdam color solid (with D65 white point) plotted within CIE 1931 XYZ color space. Notice the central symmetry of the solid, and the two sharp edges, one with warm colors and the other one with cool colors.

Maximum chroma colors, semichromes, or full colors

[edit]

Each hue has a maximum chroma point, semichrome, or full color; objects cannot have a color of that hue with a higher chroma. They are the most chromatic, vibrant colors that objects can have. They were called semichromes or full colors by the German chemist and philosopher Wilhelm Ostwald in the early 20th century.[5][6]

If B is the complementary wavelength of wavelength A, then the straight line that connects A and B passes through the achromatic axis in a linear color space, such as LMS or CIE 1931 XYZ. If the reflectance spectrum of a color is 1 (100%) for all the wavelengths between A and B, and 0 for all the wavelengths of the other half of the color space, then that color is a maximum chroma color, semichrome, or full color (this is the explanation to why they were called semichromes). Thus, maximum chroma colors are a type of optimal color.[5][6]

As explained, full colors are far from being monochromatic. If the spectral purity of a maximum chroma color is increased, its chroma decreases, because it will approach the visible spectrum, ergo, it will approach black.[5]

In perceptually uniform color spaces, the lightness of the full colors varies from around 30% in the violetish blue hues, to around 90% in the yellowish hues. The chroma of each maximum chroma point also varies depending on the hue; in optimal color solids plotted in perceptually uniform color spaces, semichromes like red, green, blue, violet, and magenta have a high chroma, while semichromes like yellow, orange, and cyan have a slightly lower chroma.

Slice of the Munsell color space in the hues of 5PB and 5Y. The point farthest from the achromatic axis in each of these two hue slices is the maximum chroma color, semichrome, or full color of that hue.

In color spheres and the HSL color space, the maximum chroma colors are located around the equator at the periphery of the color sphere. This makes color solids with a spherical shape inherently non-perceptually uniform, since they imply that all full colors have a lightness of 50%, when, as humans perceive them, there are full colors with a lightness from around 30% to around 90%. A perceptually uniform color solid has an irregular shape.[7][8]

History of the idea of optimal colors

[edit]

In the beginning of the 20th century, industrial demands for a controllable way to describe colors and the new possibility to measure light spectra initiated intense research on mathematical descriptions of colors.

The idea of optimal colors was introduced by the Baltic German chemist Wilhelm Ostwald. Erwin Schrödinger showed in his 1919 article Theorie der Pigmente von größter Leuchtkraft (Theory of Pigments with Highest Luminosity)[4] that the most-saturated colors that can be created with a given total reflectivity are generated by surfaces having either zero or full reflectance at any given wavelength, and the reflectivity spectrum must have at most two transitions between zero and full.

Schrödinger's work was further developed by David MacAdam and Siegfried Rösch [Wikidata].[9] MacAdam was the first person to calculate precise coordinates of selected points on the boundary of the optimal color solid in the CIE 1931 color space for lightness levels from Y = 10 to 95 in steps of 10 units. This enabled him to draw the optimal color solid at an acceptable degree of precision. Because of his achievement, the boundary of the optimal color solid is called the MacAdam limit (1935).

On modern computers, it is possible to calculate an optimal color solid with great precision in seconds. Usually, only the MacAdam limits (the optimal colors, the boundary of the optimal color solid) are computed, because all the other (non-optimal) possible surface colors exist inside the boundary.

MacAdam limits for illuminant CIE F4 in CIE xyY color space

Color volume

[edit]

A color volume, a type of color solid, is the set of all available colors at all available hue, saturation, lightness and/or brightness, especially when referring to a specific gamut.[10][11] It can be thought as the result of the combiantion of a 2D color gamut (that represents all available chromaticities) with the dynamic range of all available values of lightness or of brightness.[12][13][14]

The term has been used to describe HDR's higher color volume than SDR with a peak brightness of at least 1,000 cd/m2, higher than SDR's 100 cd/m2 limit; and wider color gamut than Rec. 709 / sRGB (generally DCI-P3 or Rec. 2020).[10][12][15][16][17]

Color volume of the sRGB gamut plotted within CIE xyY color space

Usage

[edit]

The color solid can also be used to clearly visualize the volume or gamut of a screen, printer, the human eye, etc, because it gives information about the dimension of lightness, whilst the commonly used chromaticity diagram lacks this dimension of color.

Artists and art critics find the color solid to be a useful means of organizing the three variables of color—hue, lightness (or value), and saturation (or chroma), as modelled in the HCL and HSL color models—in a single schematic, using it as an aid in the composition and analysis of visual art.

[edit]

See also

[edit]

References

[edit]
[edit]
Revisions and contributorsEdit on WikipediaRead on Wikipedia
from Grokipedia
A color solid is a three-dimensional geometric representation of the visible color spectrum, where each point within the solid corresponds to a unique color defined by its attributes of hue, value (lightness), and chroma (saturation or color intensity). This concept emerged in the history of as an attempt to visualize and systematize human color perception in a spatial model, contrasting with earlier two-dimensional color wheels or linear scales that could not fully capture the perceptual relationships among colors. Early proposals for color solids date back to the , with Finnish astronomer Aron Sigfrid Forsius describing a spherical model in that placed at the pole, at the opposite pole, and hues arranged equatorially with grays along the axis. During the , at least 28 such three-dimensional systems had been proposed worldwide, often in shapes like pyramids, cubes, or globes, influenced by advances in and . In the 19th century, physicist provided foundational theoretical support by formalizing color perception in three dimensions, paving the way for more perceptually uniform models. The most influential modern color solids include the , developed by American artist Albert H. Munsell starting in 1905 and first published in 1915 as A Color Notation, which arranges colors in a roughly spherical solid with evenly spaced value and chroma scales radiating from a central gray axis. Similarly, German chemist , inspired by Munsell, introduced his color solid in 1916 through Die Farbenfibel, structuring it as a double cone or spinning top with 24 hues divided into full colors, tints, shades, and neutrals to emphasize mixtures of black, white, and pure hues. These models have been pivotal in fields like art education, , and , enabling precise color specification, matching, and of perceptual uniformity, and they continue to influence contemporary digital color spaces despite limitations in accounting for metamerism and viewing conditions.

Definition and Fundamentals

Core Concept and Dimensions

A represents a three-dimensional geometric model that encompasses the full spectrum of perceivable colors within a , serving as a comprehensive enclosure for all possible color sensations experienced by the human visual system. Unlike two-dimensional color wheels, which primarily depict hue variations in a circular and often overlook and saturation, the color solid integrates these attributes into a volumetric structure, allowing for a more holistic representation of color relationships. This model conceptualizes colors as points within a bounded space, where the boundaries delineate the limits of human color perception. The primary dimensions of a color solid are hue, saturation (or chroma), and (or value). Hue corresponds to the angular position around a central vertical axis, capturing the qualitative aspect of color such as , , or , and forms a continuous circle of hues. Saturation, measured as the radial distance from this central axis, indicates the intensity or purity of the hue, ranging from neutral grays at the center to the most vivid colors at the periphery. extends along the vertical axis, from at the bottom to at the top, representing the perceived independent of hue or saturation. These orthogonal dimensions together define the solid's , enabling the localization of any color as a unique coordinate triplet. In idealized forms, color solids are often visualized as shapes like a double cone or a to approximate the perceptual volume. A double cone, for instance, is widest at the mid-lightness level to reflect maximum saturation in mid-tones, tapering to points at black and white, while a provides a more compact enclosure assuming uniform distribution, though both simplify the actual irregular boundaries. These geometric approximations illustrate how the interplay of hue, saturation, and creates a cohesive three-dimensional entity, with cross-sections at constant yielding hue-saturation circles that vary in and . The color solid is not perfectly uniform due to inherent limitations in human vision, such as varying sensitivity to hue changes and non-linear responses to chromatic and achromatic stimuli. These perceptual irregularities result from neurological in the , leading to an asymmetric volume where certain color regions expand or contract based on physiological constraints, rather than adhering to a simple .

Perceptual Basis

The perceptual basis of the color solid stems from the of , which posits that color is organized into three antagonistic channels: red-green, blue-yellow, and black-white (or ). This theory, originally proposed by Ewald Hering in 1878 and supported by subsequent neurophysiological evidence, explains why color experiences cannot occur simultaneously in opposing pairs, such as reddish-green or bluish-yellow, thereby necessitating a three-dimensional representation to capture the full range of perceivable colors without overlap in these channels. The separation into these opponent dimensions motivates the structure of the color solid, where one axis typically aligns with achromatic , and the other two encode chromatic opponencies, providing a psychological foundation for modeling the bounded volume of color experiences. Human color vision is fundamentally limited by , the principle that perception arises from the responses of three types of photoreceptors sensitive to short (), medium (), and long (red) wavelengths. This trichromatic mechanism, as described in the Young-Helmholtz theory, constrains the visible color gamut to a finite subset of all possible spectral combinations, forming the boundaries of the color solid; colors outside this volume, known as impossible colors, cannot be perceived under normal conditions because they would require simultaneous activation of mutually exclusive responses. For instance, a "reddish-green" or "yellowish-blue" cannot be seen in standard viewing because the opponent-process channels inhibit such mixtures, though stabilized images or specialized techniques can induce fleeting perceptions of these forbidden hues. These limits ensure the color solid represents only the realizable colors within human physiology, excluding hyperspectral or non-physical stimuli beyond capabilities. A key perceptual requirement for the color solid is uniformity, where equal distances within the space correspond to equally noticeable color differences, quantified by the (JND). Psychophysical studies, such as those mapping ellipses, demonstrate that JNDs vary across the plane, with larger differences often needed for detection in saturated regions compared to neutrals, as indicated by the varying sizes and orientations of ellipses, guiding the design of the solid to reflect these non-Euclidean perceptual metrics rather than physical spectral data. This emphasis on perceptual scaling ensures the solid prioritizes human discriminability, where a unit step in any direction approximates one JND, facilitating intuitive navigation of color relationships. The shape of the color solid is further influenced by environmental factors, particularly illuminants and metamerism, which alter perceived color boundaries under varying . Metamerism occurs when two spectrally distinct colors appear identical under one illuminant but differ under another due to mismatched excitations, effectively warping the solid's by expanding or contracting the for specific hues. For example, lighting may enhance warm tones while compressing cool ones, demonstrating how illuminant spectral power distributions dynamically reshape the perceptual volume without changing the underlying trichromatic limits. This variability underscores the solid's adaptation to real-world viewing conditions, where mechanisms partially compensate but cannot eliminate illuminant-induced distortions.

Historical Development

Early Proposals

The earliest documented conceptualization of a color solid emerged in from Finnish astronomer and Aron Sigfrid Forsius, who proposed a spherical model integrating the perceptual dimensions of hue, saturation, and . In his unpublished on physics, Forsius depicted the sphere with light colors positioned at one pole, dark colors at the opposite pole, neutral grays aligned along the central axis, and primary hues—red, , , and —arranged symmetrically on the equatorial plane, marking the first known three-dimensional arrangement of colors. This model drew from Neoplatonic influences and visual observations, laying foundational groundwork for later systems despite its rudimentary diagram. Building on such ideas, German astronomer Tobias Mayer introduced a double pyramid model in a 1758 university lecture, emphasizing a symmetrical organization of colors through mixtures of primaries. Mayer's structure formed a hexahedron-like solid, with a central plane of chromatic mixtures bounded by at the upper apex and at the lower, treating as an independent orthogonal to hue and saturation. Published posthumously in 1775, this proposal relied on visual estimation rather than spectral analysis, aiming to classify colors systematically for astronomical and cartographic applications. German Romantic painter Philipp Otto Runge advanced these concepts in his 1810 publication Farben-Kugel (Color Sphere), presenting a spherical model motivated by poetic appreciation of nature's chromatic diversity, artistic needs for pigment mixing, and symbolic interpretations tying colors to spiritual elements. The sphere centered a vertical axis from white to black, with an equatorial hue circle based on Newton's spectrum, divided into primaries (, , ), secondaries (, orange, violet), and tertiaries, where equal mixtures neutralized to gray at the core— symbolizing divinity, incarnation, and the spirit in a Christian trinitarian framework. Runge's work, completed amid his battle with , sought to unify color experiences philosophically for painters. Despite their innovations, these 17th- and 19th-century proposals shared key limitations, primarily the assumption of perfect geometric that disregarded perceptual irregularities in human vision. Forsius and Mayer's models idealized uniform spacing and mixing, failing to account for non-linear hue transitions or varying intensity perceptions, while Runge's presumed equal "force" in primary mixtures, which did not align with actual or behaviors, leading to idealized rather than empirically accurate representations.

Key Theorists and Models

Albert Munsell, an American artist and educator, pioneered a perceptually based color solid through extensive experiments conducted between 1905 and 1915, resulting in an irregular, tree-like three-dimensional structure that deviated from prior geometric ideals to better reflect human vision. Unlike symmetrical models, Munsell's solid accounts for variations in maximum chroma across hues and values, with some colors achieving greater saturation at mid-tones while others are limited by perceptual boundaries; this irregularity was determined via visual matching tasks using painted samples and observer judgments. He introduced the , specifying colors by three attributes—Hue (angular position around the tree), Value (lightness from 0 black to 10 white), and Chroma (saturation extending radially)—as detailed in his 1905 publication A Color Notation and the 1915 Atlas of the Munsell Color System. Wilhelm Ostwald, a German chemist and Nobel laureate, advanced color ordering in the 1916–1920s with his double-cone model, emphasizing psychological scaling to align with perceived attributes rather than physical spectra. The solid consists of a vertical axis for achromatic series (from black to white), with conical expansions at each end for full colors arranged in a hue circle of 24 hues (derived from four principal hues: yellow, red, blue, and green, with intermediates), where saturation decreases linearly toward the gray axis; this structure represents colors as mixtures of white, black, and full hue, scaled by observer assessments of brightness and purity. Ostwald's approach, outlined in Die Farbenfibel (1916), prioritized practical notation for design and science, influencing later systems through its focus on perceptual harmony. The (CIE) established foundational tristimulus coordinates in 1931 with the CIE XYZ color space, enabling quantitative approximations of color solids by mapping data to perceptual responses via standard observer functions; this laid the groundwork for representing the color solid as a volume over the chromaticity diagram, with Y as . Subsequent developments, including the 1976 CIELab* (CIELAB) space, transformed XYZ values using nonlinear functions (e.g., cube-root compression) to approximate uniform perceptual spacing, where Euclidean distances better correspond to visual differences, rendering the color solid as an irregular with elongated axes along hues. These models connect empirical solids like Munsell's to device-independent metrics, facilitating volume calculations in uniform spaces. Post-2000 advancements incorporate the CIE's (2002) and CIECAM16 (2016) color appearance models to enhance uniformity in complex viewing conditions, adapting for illuminants, surrounds, and backgrounds to refine color solid approximations. predicts attributes like (J), chroma (C), and hue angle (h) from XYZ inputs, yielding more perceptually uniform encodings (e.g., via JCh) that mitigate distortions in traditional spaces, while CIECAM16 addresses mathematical inconsistencies in for improved accuracy in . These models support modern solid visualizations by embedding appearance correlations, as in uniform color spaces derived from for difference prediction.

Structure and Organization

Geometric Representations

Color solids are visualized through various geometric forms that aim to represent the perceptual organization of colors in , typically incorporating dimensions of hue, saturation (or chroma), and (or value). Idealized shapes provide symmetrical and mathematically simple models, while more realistic representations account for perceptual nonuniformities observed in human vision. One of the earliest idealized geometric representations is the color sphere proposed by in 1810, where hues form an equatorial belt, varies along the vertical axis from at the to at the north pole, and saturation radiates outward from the neutral axis toward the surface. This spherical model assumes uniform perceptual spacing, with the surface defining the boundary of highly saturated colors. In contrast, the HSV (Hue, Saturation, Value) color model employs a , popularized in , where hue circumnavigates the , saturation extends radially from the central axis, and value aligns vertically from at the base to at the top. Another idealized form is the double cone introduced by in the early 20th century, consisting of two cones joined at their bases, with the widest equator at maximum saturation; hues lie along the equatorial circle, progresses from at one apex to at the other, and saturation increases toward the equator. Realistic color solids deviate from these symmetries to better match empirical perceptual data. The Munsell color solid, developed by Albert H. Munsell around 1905, forms an asymmetric, irregular structure resembling a distorted with bulging protuberances in the equatorial regions for warmer hues like and , where higher chromas are perceptible, and tapered poles at extreme values where chroma diminishes. This irregularity reflects measured variations in the maximum achievable saturation across different hues and levels, resulting in a more perceptually uniform distribution of color samples. The boundary of a color solid delineates the locus of maximum saturation for each combination of hue and , enclosing all realizable colors within the surface while excluding those beyond human or device capabilities. In these models, the surface thus serves as the envelope of the most vivid colors, with interior points representing desaturated variants approaching the neutral axis. Visualization techniques for color solids often involve projections and cross-sections to convey the three-dimensional structure on two-dimensional media. Helical ramps, for instance, illustrate the continuous progression of hues around the axis, spiraling from the pole to the pole to highlight transitions in saturation and hue adjacency. Constant hue planes, to the hue circle, reveal radial cross-sections as lightness-saturation fans, demonstrating how maximum chroma varies with lightness for a fixed hue, often appearing as irregular ovals in realistic models like Munsell's.

Irregularity and Boundaries

Color solids deviate from ideal symmetric shapes primarily due to variations in human perceptual sensitivity across hues, with the demonstrating approximately twice the sensitivity to hue differences compared to chroma differences—a phenomenon known as hue superimportance. This perceptual nonuniformity results in an irregular structure, where the maximal chroma achievable for a given hue and varies significantly; for instance, hues support higher chroma levels than hues, reflecting the uneven distribution of perceptual scales. These irregularities stem from physiological constraints imposed by the three types of photoreceptors in the —long-wavelength-sensitive (), medium-wavelength-sensitive (), and short-wavelength-sensitive (S) cones—whose overlapping sensitivities limit the range of distinct color signals that can be generated. The differential response profiles of these cones, particularly the broader sensitivity of and cones compared to S cones, compress the color solid in certain regions, such as those dominated by short wavelengths, while allowing greater extension in others like yellows. The boundaries of color solids are delineated by the projection of the spectral locus—a curve representing the chromaticities of monochromatic spectral lights—from two-dimensional diagrams into , forming the outer edges of achievable colors under standard illuminants. This locus, which spans only about 75% of the full hue circle due to gaps at the transition, excludes impossible colors that would require non-physical s exceeding 100% or negative values, thereby confining the solid to physically realizable stimuli with reflectance functions between 0 and 1. Illustrative examples of this irregularity include the compression of the color solid at its dark and light extremes, near black and white, where limited ranges restrict chroma extensions and force a tapering . Similarly, hue-dependent chroma maxima manifest as elongated protrusions for warm hues like and , contrasting with the narrower profiles for cool hues like and , underscoring the solid's departure from uniformity. The viable regions within these boundaries are empirically mapped through color matching experiments, in which observers adjust mixtures of primary lights to match spectral stimuli, as pioneered by William David Wright in 1929 and John Guild in 1931. These foundational studies quantified the standard observer's responses, establishing the spectral locus and excluding unmatchable colors to define the perceptual boundaries of the color solid.

Optimal Color Solids

Maximum Chroma and Full Colors

Maximum chroma colors, also known as full colors or semichromes, represent the points on the boundary of a color solid where saturation reaches its peak for a given hue and level. These colors are characterized by spectra that exhibit a step-function pattern, reflecting approximately half of the incident (typically between a dominant wavelength and its complementary) while absorbing the remainder, thereby achieving the highest possible purity without desaturation by white or black components. In Ostwald's color system, full colors are defined as semichromes, consisting of spectral halves that maximize chromatic content for each hue, forming the purest object colors theoretically attainable under standard illumination. Semichromes possess selectivity with values of 0 or 1 across wavelengths in their ideal form, resulting in maximal vibrancy and hue dominance. This binary pattern allows for a theoretical benchmark of chroma, where the proportion of reflected aligns with the dominant hue to elevate purity to its maximum. Properties of maximum chroma colors include their dependence on composition rather than mere coordinates, ensuring no admixture of neutral tones that would dilute perceptual vividness; for instance, a maximum chroma green might approximate the of around 520 nm while absorbing complementary wavelengths, yielding a hue of exceptional intensity not replicable by simple dilution. In the geometric structure of the color solid, maximum chroma colors manifest as an equatorial belt encircling the achromatic axis, delineating the locus of highest saturation across all hues at mid-lightness levels. This belt varies in radial extent due to perceptual nonuniformities, with and yellows often exhibiting greater maximum chroma than cyans or magentas, reflecting the solid's irregular boundaries. Such colors embody purity in object-mode , where the absence of desaturating elements like maximizes the perceptual distance from grays, providing a theoretical benchmark for vividness in color representation.

Evolution of Optimal Color Ideas

The concept of optimal colors within color solids began with early 19th-century efforts to geometrically represent the most saturated or "pure" hues as boundaries of the solid. Philipp Otto Runge's 1810 Farben-Kugel positioned pure spectral hues along the equatorial surface of a , with at the pole and at the opposite pole, conceptualizing these boundary colors as the maximal chromatic extremes achievable in mixtures. Earlier, in 1758, Tobias Mayer proposed a triangular color order system where boundary colors—mixtures of primary s like red, blue, and yellow—formed the edges connecting pure primaries at the vertices, extending this into a multilevel solid by incorporating and admixtures to define optimal saturation limits. In the 20th century, refinements emphasized perceptual uniformity in defining optimal boundaries. Albert H. Munsell's color system, developed from 1905 onward and formalized in his 1915 Atlas of the Munsell Color System, constructed chroma scales that extended radially from neutral axes to perceptual maxima, where the highest chroma for each hue and value represented the practical limit of pigment vividness, calibrated through visual matching experiments to ensure equal perceptual steps. Wilhelm Ostwald's 1916 color system, influenced by his semichrome theory, focused on vividness by placing "full colors"—the most saturated exemplars without black or white components—along the equatorial belt of a double cone, prioritizing purity and luminance as metrics for optimal boundary definition over strict spectral locus adherence. Post-1950 developments integrated these ideas with (CIE) standards to achieve device-independent optima. The CIE 1976 Lab* uniform , building on the 1931 CIE XYZ tristimulus values, enabled mapping of color solids where optimal boundaries align with perceptual uniformity, allowing quantification of maximal chroma loci independent of specific pigments or displays. This framework facilitated computational models of optimal solids, such as those deriving from the ellipses for just-noticeable differences. In the 2020s, AI-driven approaches have optimized gamut mapping within these solids; for instance, algorithms dynamically adjust boundary colors in real-time for substrate variations in , enhancing perceptual fidelity while minimizing clipping of high-chroma regions. Ongoing debates center on whether optimal colors should prioritize perceptual uniformity, as in Munsell-derived or CIE-based solids, or reflectance profiles for physical accuracy. Spectrum-based models, which simulate full hyperspectral , often yield more realistic metamerism handling in simulations compared to perception-based approximations like RGB or LAB, though the latter remain computationally efficient for practical applications. These discussions highlight trade-offs between human visual response and objective fidelity in defining solid boundaries.

Properties and Metrics

Color Volume Calculation

The volume of a color solid serves as a key metric for assessing the and capacity of a color , representing the total occupied by all representable colors within a perceptual . In uniform spaces like CIELAB, this volume quantifies the gamut's perceptual extent, enabling comparisons of color reproduction capabilities across devices or theoretical models. Conceptually, the volume VV of a color solid is defined by the triple integral over its domain in perceptual coordinates: VdLdadbV \approx \iiint dL \, da \, db in Cartesian CIELAB coordinates (LL^*, aa^*, bb^*), or equivalently in cylindrical form as VCdHdCdLV \approx \iiint C \, dH \, dC \, dL where HH is hue angle (in radians), CC is chroma, and LL is lightness. This integral captures the full extent of the solid, with limits determined by the boundaries of representable colors. In practice, direct analytical evaluation is infeasible due to irregular boundaries, so numerical approximations are employed. While CIELAB is widely used, newer perceptually uniform spaces like ICtCp improve accuracy for calculations involving high-dynamic-range content. To calculate the volume, the color solid is first mapped to the perceptual space by converting device-dependent coordinates (e.g., from RGB) to CIELAB using standard CIE transformations, which account for the reference and observer function. The domain is then discretized: one common method divides the space into a uniform 3D grid of , each a small cubic element (e.g., with side length scaled for perceptual uniformity). Points within the boundary are identified (often via or inclusion tests), and the volume is the sum of voxel volumes inside the solid, adjusted for grid resolution to minimize error. Alternatively, sampling estimates the volume by generating random points within a bounding box and computing the ratio of points falling inside the solid, multiplied by the box volume; this is particularly useful for complex, non-convex shapes. Surface-based methods, such as tessellating the boundary into triangles and summing volumes, provide another approach. Several factors influence the computed volume, including the choice of illuminant—typically D65 for daylight simulation—and the standard observer model, such as the CIE 1931 2° function to approximate human vision. These ensure consistency but can alter the solid's shape and size if varied (e.g., D50 for ). For a rough , a models the solid as a with radius rr as the maximum chroma and height hh as the range, yielding V=πr2h.V = \pi r^2 h. This simplifies computation but overlooks chroma variations across hues and lightness levels. Volumes are typically reported in cubic units of the perceptual space, such as cubic CIELAB units, which approximate perceptual uniformity where 1 unit corresponds roughly to a (JND) in color.

Gamut Volume Comparisons

The Munsell color solid, designed for perceptual uniformity, encompasses a substantial volume of visible colors, estimated at approximately 10 million distinguishable colors when considering just-noticeable differences across its hue, value, and chroma dimensions. In contrast, the sRGB gamut, a standard for digital displays, yields a perceptual volume of about 4.9 million distinguishable colors (MDC) under typical luminance conditions (100 cd/m² peak white, 0.1 cd/m² black), highlighting the Munsell's broader coverage of natural object colors that exceed many device limitations. Approximations of the Ostwald color solid, a double-cone model emphasizing hue, blackness, and whiteness, align closely with Munsell in conceptual volume but differ in boundary definition; when mapped to CIE Lab*, Ostwald's structure shows a more symmetric but less irregular representation of real-world colors compared to Lab*'s empirically derived, non-uniform solid that better captures human perception irregularities. Device gamuts further illustrate volume disparities, with CMYK printer gamuts typically smaller than RGB display gamuts due to subtractive limitations versus additive emission. For instance, standard CMYK profiles struggle with bright blues and greens, leading to clipping and desaturation in reproduction. The gamut itself occupies about 35% of the CIE 1931 visible area, underscoring significant losses when mapping to print media. Modern metrics for gamut volume comparisons often employ DeltaE-based normalization in perceptually uniform spaces like or , where volumes are computed as integrals of just-noticeable differences (JNDs) to account for human visual sensitivity. Recent data from the 2020s shows wide-gamut displays, such as panels, exceeding 100% coverage—reaching 110-120% in some models—expanding perceptual volumes to over 18 MDC for equivalents at higher peaks (e.g., 1,000 cd/m²). These larger volumes facilitate superior color reproduction by preserving vibrancy and accuracy across bright-to-dark tones, reducing metamerism, and enabling closer matches to real-world scenes in applications like HDR imaging.

Applications

In Visual Arts and Design

In and , color solids serve as foundational tools for creating harmonious color palettes by enabling artists to select paths through the that maintain perceptual consistency. For instance, designers can trace analogous hues at equal levels of chroma and value within the solid, ensuring that adjacent colors relate smoothly without abrupt perceptual shifts, as exemplified in the Munsell system's radial organization of hue around a central value axis. This approach allows for the construction of palettes that emphasize balance, such as selecting colors along a helical path that spirals through the solid to achieve progressive saturation while preserving uniformity. The Munsell color solid, in particular, has been integral to art education since its development in the early , where it facilitates matching physical paints to specific coordinates for balanced compositions. Students learn to notate colors using hue, value, and chroma scales, enabling precise replication of natural scenes or abstract arrangements that avoid disproportionate dominance of any single dimension. This method promotes an understanding of color relationships as interdependent, much like musical harmony, allowing educators to teach principles of proportion and contrast through the solid's irregular boundaries. In historical contexts, the school integrated three-dimensional color models, such as Philipp Otto Runge's color sphere—a precursor to modern solids—into its curriculum to inform architectural and . adapted this spherical representation into practical exercises for studying contrasts in hue, lightness, and temperature, applying it to and spatial compositions that unified form and color in functional environments. Contemporary graphic designers similarly draw on visualizations of color solids to develop branding palettes, selecting subsets of optimal colors from the solid's perimeter for vibrant, cohesive identities that align with perceptual harmony. A key advantage of employing color solids in these practices is their perceptual balance, which helps artists predict and avoid muddy mixtures by quantifying how chroma diminishes with value shifts, ensuring cleaner overlays and blends in compositions. This uniformity in spacing—where equal steps in any dimension appear visually equivalent—reduces trial-and-error in palette refinement, fostering more intuitive and effective color selection across media.

In Digital Color Management

In digital color management, color solids play a crucial role in integrating device gamuts with perceptual color spaces through ICC profiles. The International Color Consortium (ICC) specification defines the Profile Connection Space (PCS) primarily as CIELAB, a device-independent uniform color space where the theoretical optimal color solid—bounded by the Rösch-MacAdam limits—represents the maximum range of surface-reflectance colors perceptible under standard illuminants like D65. Device-specific ICC profiles map input colors from RGB or CMYK spaces to this PCS, enabling cross-media consistency by aligning disparate device gamuts to a common perceptual solid; for instance, a camera's captured colors are transformed into CIELAB coordinates, then remapped to a printer's gamut while preserving relative perceptual distances within the solid. This process ensures that colors maintain visual across displays, prints, and other outputs, with gamut boundaries visualized as 3D solids to identify clipping regions. Software implementations leverage color solids for practical handling of gamuts, particularly in Adobe applications. In , relative colorimetric rendering intent performs clipping by projecting out-of-gamut colors onto the nearest boundary of the target solid in CIELAB , preventing desaturation artifacts during conversions like RGB to CMYK. Similarly, Adobe Premiere Pro's color management pipeline uses solid-based algorithms for HDR workflows, where advanced scopes and external tools allow users to preview and adjust mappings interactively. Complementary utilities, such as Imatest's Gamutvision, render ICC profile gamuts as rotatable 3D solids in CIELAB, facilitating profile validation by quantifying volume overlaps and compression needs between source and destination solids. Key challenges in this domain involve managing out-of- colors, where perceptual rendering intents apply compression techniques to scale the source toward the achromatic axis (grays) of the target , thereby preserving hue and at the expense of saturation for vivid colors outside the destination's boundaries. This method, detailed in early gamut mapping research, minimizes perceived distortions but can reduce contrast in high-chroma regions; advanced algorithms mitigate this by segmenting the into hue planes for localized adjustments. In the 2020s, (HDR) advancements have expanded effective color , with Rec. 2020's wider primaries enabling laser display systems to approximate larger portions of the Rösch-MacAdam —calculations show volume increases of approximately 72% over under D65 illumination—supporting brighter, more saturated reproductions in . As of 2025, integrations of AI in , such as Adobe Sensei's automated mapping, further enhance solid-based workflows by predicting optimal adjustments for AR/VR applications. Industry standards incorporate color solids to benchmark capabilities. ISO 12647-2 for sheet-fed defines primary densities and characterizations in CIELAB, establishing a reference for control and proofing to ensure reproducible color solids across production runs. For video, Recommendation BT.2020 specifies primaries that extend the color for UHDTV, covering approximately 76% of the CIE 1931 and serving as a target for HDR mapping in broadcast and streaming pipelines.

References

Add your contribution
Related Hubs
User Avatar
No comments yet.