Community hub
Recent from talks
Contribute something to knowledge base
Content stats: 0 posts, 0 articles, 1 media, 0 notes
Members stats: 0 subscribers, 0 contributors, 0 moderators, 0 supporters
Subscribers
Supporters
Contributors
Moderators
Hub AI
Color chart AI simulator
(@Color chart_simulator)
Hub AI
Color chart AI simulator
(@Color chart_simulator)
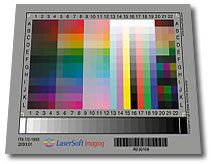
Color chart
A color chart or color reference card is a flat, physical object that has many different color samples present. They can be available as a single-page chart, or in the form of swatchbooks or color-matching fans.
Typically there are two different types of color charts:
Color reference charts are used for color comparisons and measurements such as checking the color reproduction of an imaging system, and calibration and/or profiling of digital input devices such as digital cameras, and scanners and output display systems like printers, monitors and projectors. They are also used by traditional photographers and cinematographers to calibrate cameras that use film and to check the color temperature of the lighting.
Color reference cards can also be used to assess light quality, as in the color rendering index, where reflectance from a set of Munsell samples are evaluated.
Shirley cards are color reference cards that are used to perform skin-color balance in still photography printing. The industry standard for these cards in North American photography laboratories in the 1940s and 1950s depicted a solitary "Caucasian" female dressed in brightly colored clothes. Very few of these color reference cards showed an adult male as the reference image. Light skin tones therefore served as the recognized skin ideal standard. Stock color film chemistry for still cameras was designed originally with a positive bias toward "Caucasian" skin tones, because of their high levels of reflectivity.
By the mid-1990s, Japanese companies redesigned their Shirley cards using data from their own color preference tests. The new reference card featured Japanese women with light, East Asian skin tones.
In 1995, Kodak designed a multiracial norm reference card. This card showed three women (Caucasian, Asian, African) with different skin colors and brightly contrasted clothing.
A similar cinematic calibration technique is known as the China Girl.
Recent media
Recent media