
Community hub
Recent from talks
Contribute something
Nothing was collected or created yet.
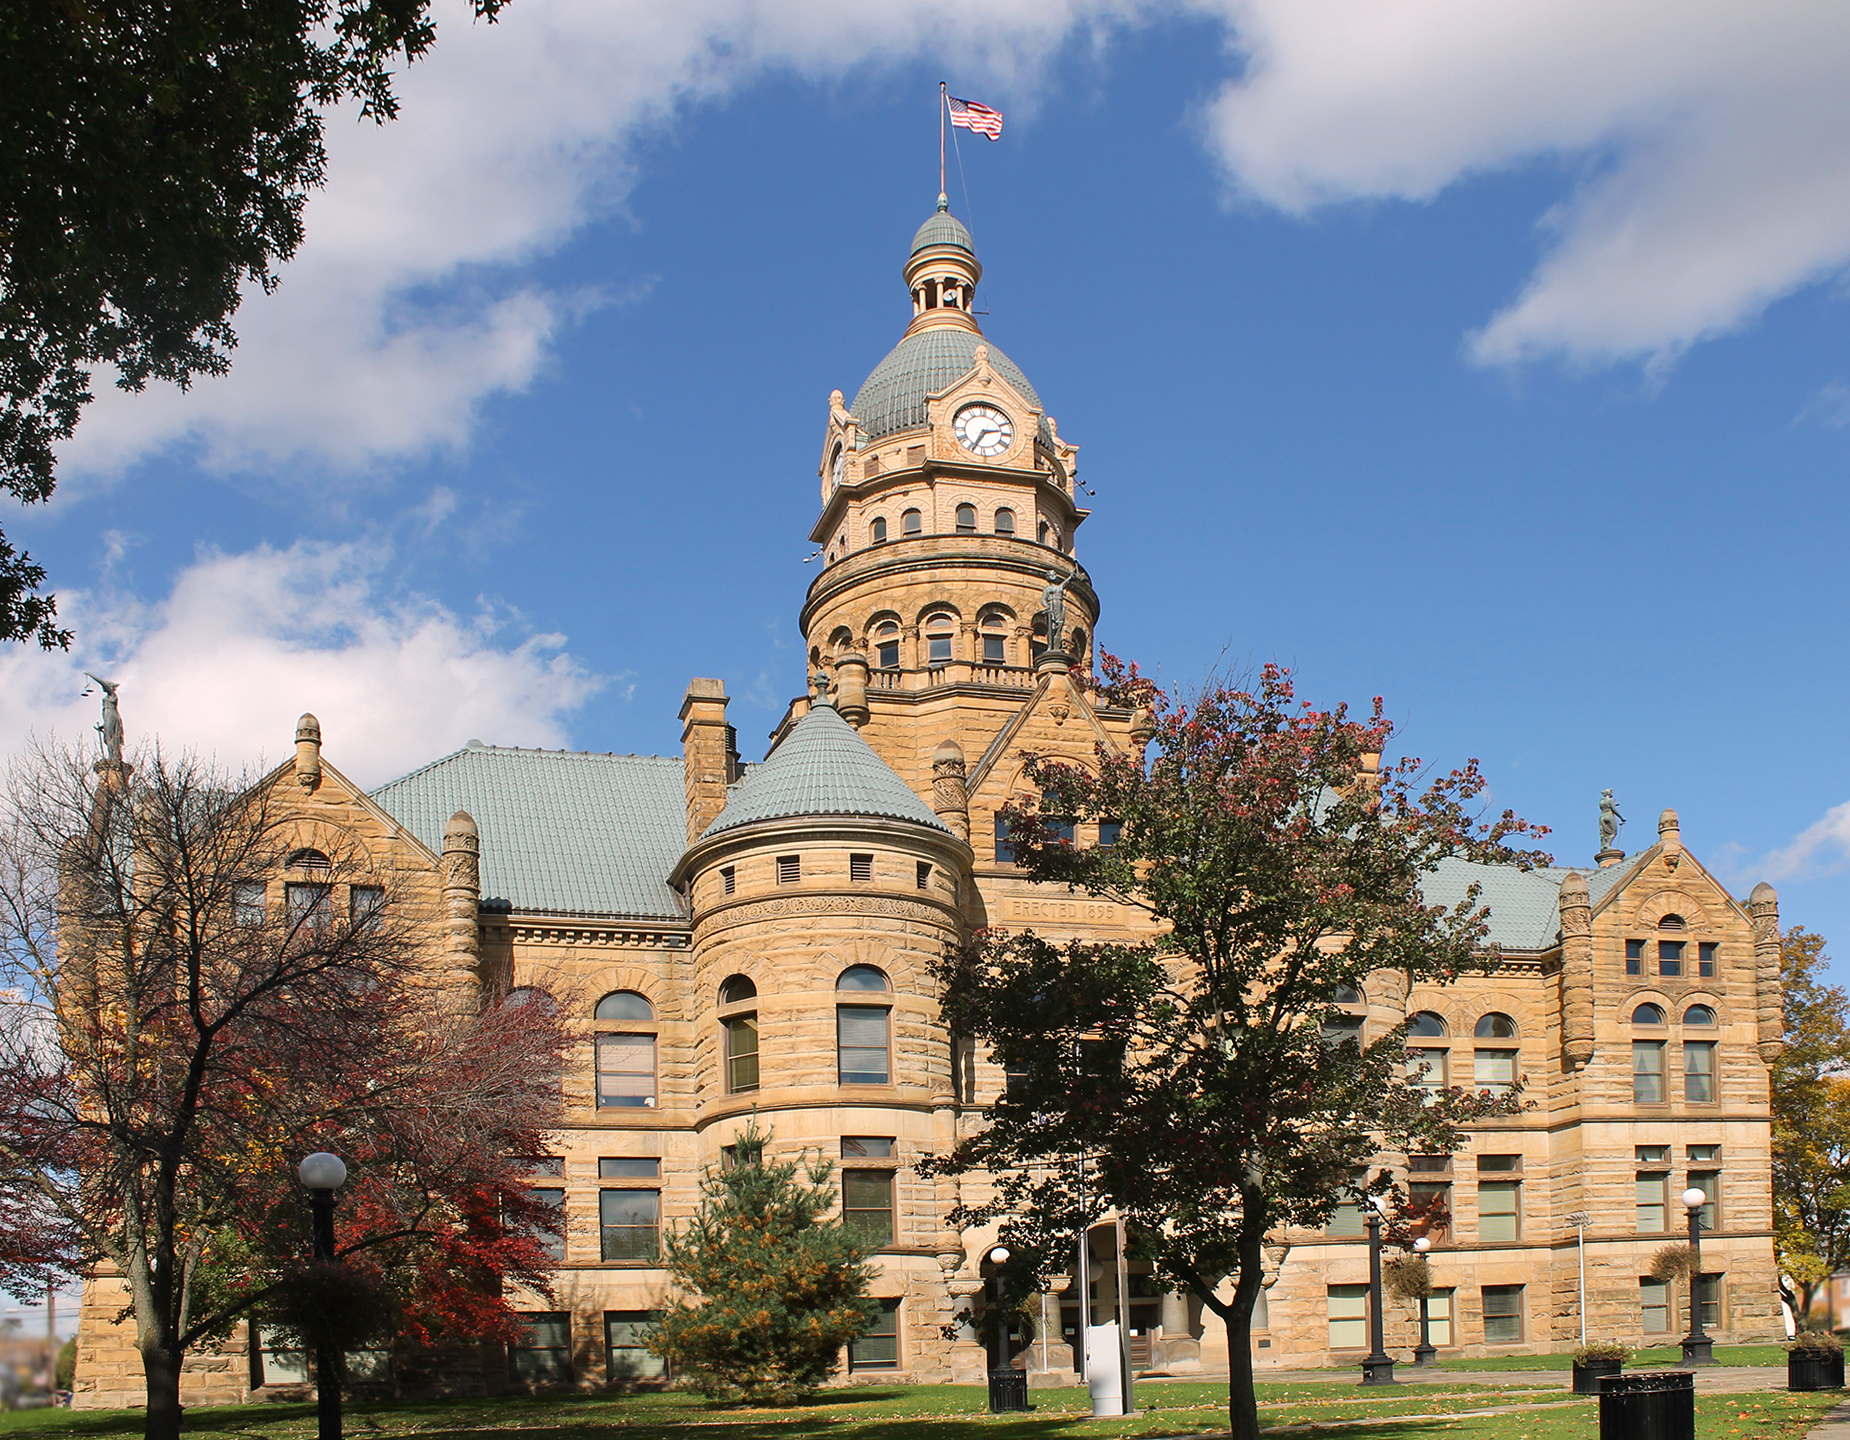
Trumbull County, Ohio
View on Wikipedia
Trumbull County is located in the far northeast portion of the U.S. state of Ohio. As of the 2020 census, the population was 201,977.[3] Its county seat and largest city is Warren, which developed industry along the Mahoning River.[4] Trumbull County is part of the Youngstown–Warren, OH Metropolitan Statistical Area.
Key Information


History
[edit]In the early years of the European discovery and exploration of the New World, the land that became Trumbull County was originally claimed by French explorers as part of the French colony of Canada (New France). Their settlements had some fur traders who interacted with Native American tribes in this area. After losing the Seven Years' War to Great Britain, France was forced to cede its territories east of the Mississippi River in 1763. Great Britain renamed New France as the Province of Quebec.
Following the United States' victory in its Revolutionary War, the British were forced to cede this land to the new nation. The federal government convinced Connecticut to give up its claim to the land, but it was known as part of the Connecticut Western Reserve in the Northwest Territory. Connecticut retained sovereignty over some of the eastern portion of what became Ohio, selling this area in 1795 to the Connecticut Land Company, a speculative private development firm. As first organized, Trumbull County consisted of the entire area of the Connecticut Western Reserve before population increased, and it was divided into smaller counties. The county's main city, Warren, was originally founded as the capitol of the Western Reserve territory.[5]
No Native American settlements have ever formally been identified in Trumbull County; however, artifacts are uncovered often. Early settlers did believe they noted an ancient village site in Kinsman, a more contemporary site in Hartford, and several strange stone constructions were noted in the Black Ash Swamp by early Bristol residents- this area now known as the Grand River Preserve. Many presumably different groups of Natives were still frequenting camps in the vicinity of Newton Falls and somewhere near the Champion-Warren township border when modern Americans first began to settle there. Several of the names of specific Native persons are echoed across most of these early residents' histories- namely Cadashaway, Paqua and Kiogg. A memorial stone piles believed to have been Native in origin was situated on the West Bank of the Mahoning, but was later removed for construction purposes.[6] Before 1600, the area was ambiguously between the territories of the Erie people to the east and the Whittlesey Culture to the west. It is currently unknown precisely where one tribe's territory ended and the other began. After the Beaver Wars, the area was frequented by travelling Lenape, Wyandot, Ottawa, Shawnee and Seneca, who all had settlements nearby for a time and shared the valley's animal, food and medicinal resources. They also regularly panned for salt in the marshes. The Natives collectively used this area as a shared hunting ground, but had to give up ownership of the region for settlement as punishment for participating in the Northwest Indian War.[7] However, early residents say Natives still frequented the area until roughly 1811. Some of the final Native residents were camped along the Grand River in Mespotamia during the war, leading to an upsetting altercation in which the locals found and ransacked their camp and, as a warning to leave, carved an image of a Native man into a tree and shot it. The Natives responded by carving a white man into a tree without a mark on it, but seem to have later felt it was unsafe to stay and left. They could have gone south to Prophetstown, a religious compound run by Tecumseh's brother, and got caught up in the Shawnee War and War of 1812, or they and several other Native communities scattered around northeast Ohio may have condensed into a handful of settlements in the Cuyahoga River, before the majority of them relocated west in 1813 to either live with the main Ottawa or Wyandot tribe. Only a handful of Native individuals were left throughout all of Northeast Ohio and historically recorded following this.[8]
The county is named for Jonathan Trumbull, Governor of Connecticut, who once owned the land in this region.[9] Early settlements were made along the Mahoning River and other waterways, which provided transportation access and water power to the industries that developed later in the 19th century.
Geography
[edit]According to the United States Census Bureau, the county has a total area of 637 square miles (1,650 km2), of which 618 square miles (1,600 km2) is land and 18 square miles (47 km2) (2.9%) is water.[10] It is approximately a square with sides of 25.24 miles; it is the only square county in Ohio.[11]
Adjacent counties
[edit]- Ashtabula County (north)
- Crawford County, Pennsylvania (northeast)
- Mercer County, Pennsylvania (east)
- Mahoning County (south)
- Portage County (southwest)
- Geauga County (northwest)
Major highways
[edit]Demographics
[edit]| Census | Pop. | Note | %± |
|---|---|---|---|
| 1800 | 1,302 | — | |
| 1810 | 8,671 | 566.0% | |
| 1820 | 15,546 | 79.3% | |
| 1830 | 26,153 | 68.2% | |
| 1840 | 38,107 | 45.7% | |
| 1850 | 30,490 | −20.0% | |
| 1860 | 30,656 | 0.5% | |
| 1870 | 38,659 | 26.1% | |
| 1880 | 44,880 | 16.1% | |
| 1890 | 42,373 | −5.6% | |
| 1900 | 46,591 | 10.0% | |
| 1910 | 52,766 | 13.3% | |
| 1920 | 83,920 | 59.0% | |
| 1930 | 123,063 | 46.6% | |
| 1940 | 132,315 | 7.5% | |
| 1950 | 158,915 | 20.1% | |
| 1960 | 208,526 | 31.2% | |
| 1970 | 232,579 | 11.5% | |
| 1980 | 241,863 | 4.0% | |
| 1990 | 227,813 | −5.8% | |
| 2000 | 225,116 | −1.2% | |
| 2010 | 210,312 | −6.6% | |
| 2020 | 201,977 | −4.0% | |
| 2024 (est.) | 200,300 | −0.8% | |
| U.S. Decennial Census[12] 1790-1960[13] 1900-1990[14] 1990-2000[15] 2010-2020[3] 2024[2] | |||
2020 census
[edit]| Race / Ethnicity (NH = Non-Hispanic) | Pop 1980[16] | Pop 1990[17] | Pop 2000[18] | Pop 2010[19] | Pop 2020[20] | % 1980 | % 1990 | % 2000 | % 2010 | % 2020 |
|---|---|---|---|---|---|---|---|---|---|---|
| White alone (NH) | 224,592 | 209,819 | 201,953 | 185,388 | 169,627 | 92.86% | 92.10% | 89.71% | 88.15% | 83.98% |
| Black or African American alone (NH) | 14,517 | 15,136 | 17,628 | 17,200 | 16,940 | 6.00% | 6.64% | 7.83% | 8.18% | 8.39% |
| Native American or Alaska Native alone (NH) | 201 | 328 | 305 | 326 | 249 | 0.08% | 0.14% | 0.14% | 0.16% | 0.12% |
| Asian alone (NH) | 806 | 960 | 987 | 979 | 1,099 | 0.33% | 0.42% | 0.44% | 0.47% | 0.54% |
| Native Hawaiian or Pacific Islander alone (NH) | x [21] | x [22] | 31 | 36 | 26 | x | x | 0.01% | 0.02% | 0.01% |
| Other race alone (NH) | 373 | 116 | 179 | 216 | 609 | 0.15% | 0.05% | 0.08% | 0.10% | 0.30% |
| Mixed race or Multiracial (NH) | x [23] | x [24] | 2,239 | 3,366 | 9,248 | x | x | 0.99% | 1.60% | 4.58% |
| Hispanic or Latino (any race) | 1,374 | 1,454 | 1,794 | 2,801 | 4,179 | 0.57% | 0.64% | 0.80% | 1.33% | 2.07% |
| Total | 241,863 | 227,813 | 225,116 | 210,312 | 201,977 | 100.00% | 100.00% | 100.00% | 100.00% | 100.00% |
2010 census
[edit]As of the census of 2010, there were 210,312 people, 86,011 households, and 56,874 families living in the county.[25] The population density was 340.1 inhabitants per square mile (131.3/km2). There were 96,163 housing units at an average density of 155.5 units per square mile (60.0 units/km2).[26] The racial makeup of the county was 89.0% white, 8.3% black or African American, 0.5% Asian, 0.2% American Indian, 0.3% from other races, and 1.8% from two or more races. Those of Hispanic or Latino origin made up 1.3% of the population.[25] In terms of ancestry, 21.6% were German, 16.5% were American, 14.3% were Irish, 13.7% were Italian, and 10.6% were English.[27]
Of the 86,011 households, 28.8% had children under the age of 18 living with them, 47.4% were married couples living together, 13.7% had a female householder with no husband present, 33.9% were non-families, and 29.2% of all households were made up of individuals. The average household size was 2.40 and the average family size was 2.95. The median age was 42.8 years.[25]
The median income for a household in the county was $42,296 and the median income for a family was $52,731. Males had a median income of $43,382 versus $30,859 for females. The per capita income for the county was $21,854. About 11.5% of families and 15.4% of the population were below the poverty line, including 24.9% of those under age 18 and 8.1% of those age 65 or over.[28]
2000 census
[edit]As of the census of 2000, there were 225,116 people, 89,020 households, and 61,690 families living in the county. The population density was 365 inhabitants per square mile (141/km2). There were 95,117 housing units at an average density of 154 units per square mile (59 units/km2). The racial makeup of the county was 90.21% White, 7.90% Black or African American, 0.15% Native American, 0.45% Asian, 0.02% Pacific Islander, 0.21% from other races, and 1.07% from two or more races. 0.80% of the population were Hispanic or Latino of any race. 94.6% spoke English and 1.0% German as their first language.
There were 89,020 households, out of which 29.90% had children under the age of 18 living with them, 52.90% were married couples living together, 12.50% had a female householder with no husband present, and 30.70% were non-families. 26.90% of all households were made up of individuals, and 11.40% had someone living alone who was 65 years of age or older. The average household size was 2.48 and the average family size was 3.02.
In the county, the population was spread out, with 24.40% under the age of 18, 7.70% from 18 to 24, 27.30% from 25 to 44, 24.80% from 45 to 64, and 15.70% who were 65 years of age or older. The median age was 39 years. For every 100 females there were 93.80 males. For every 100 females age 18 and over, there were 90.60 males.
The median income for a household in the county was $38,298, and the median income for a family was $46,203. Males had a median income of $36,823 versus $24,443 for females. The per capita income for the county was $19,188. About 7.90% of families and 10.30% of the population were below the poverty line, including 15.40% of those under age 18 and 7.60% of those age 65 or over.
Politics
[edit]Trumbull County was historically a Democratic stronghold; in 2016, however, Donald Trump won the county by a reasonably comfortable margin of 6.22%, being the first Republican to win the county since Richard Nixon in 1972.[29] Trump expanded his margin in the county to 10.6 points in 2020 and to 16.8 in 2024.[30] Trump's 2024 performance was the highest of any Republican presidential candidate since 1928.
| Year | Republican | Democratic | Third party(ies) | |||
|---|---|---|---|---|---|---|
| No. | % | No. | % | No. | % | |
| 2024 | 55,983 | 57.66% | 39,758 | 40.95% | 1,355 | 1.40% |
| 2020 | 55,194 | 54.57% | 44,519 | 44.01% | 1,439 | 1.42% |
| 2016 | 49,024 | 50.71% | 43,014 | 44.49% | 4,638 | 4.80% |
| 2012 | 38,279 | 37.54% | 61,672 | 60.48% | 2,012 | 1.97% |
| 2008 | 40,164 | 37.44% | 64,145 | 59.80% | 2,962 | 2.76% |
| 2004 | 40,977 | 37.89% | 66,673 | 61.65% | 495 | 0.46% |
| 2000 | 34,654 | 36.01% | 57,643 | 59.90% | 3,942 | 4.10% |
| 1996 | 24,811 | 26.19% | 55,604 | 58.69% | 14,330 | 15.12% |
| 1992 | 25,831 | 24.01% | 54,591 | 50.73% | 27,184 | 25.26% |
| 1988 | 38,815 | 39.51% | 58,674 | 59.72% | 761 | 0.77% |
| 1984 | 45,623 | 44.18% | 56,902 | 55.11% | 734 | 0.71% |
| 1980 | 41,056 | 44.15% | 44,366 | 47.70% | 7,580 | 8.15% |
| 1976 | 36,469 | 39.41% | 53,828 | 58.16% | 2,247 | 2.43% |
| 1972 | 47,680 | 55.92% | 35,278 | 41.37% | 2,308 | 2.71% |
| 1968 | 33,076 | 39.97% | 40,365 | 48.77% | 9,319 | 11.26% |
| 1964 | 27,059 | 33.24% | 54,342 | 66.76% | 0 | 0.00% |
| 1960 | 40,724 | 46.46% | 46,928 | 53.54% | 0 | 0.00% |
| 1956 | 43,936 | 57.17% | 32,913 | 42.83% | 0 | 0.00% |
| 1952 | 37,793 | 49.17% | 39,062 | 50.83% | 0 | 0.00% |
| 1948 | 25,297 | 39.91% | 37,097 | 58.52% | 998 | 1.57% |
| 1944 | 25,150 | 42.30% | 34,312 | 57.70% | 0 | 0.00% |
| 1940 | 25,026 | 41.96% | 34,615 | 58.04% | 0 | 0.00% |
| 1936 | 16,887 | 33.55% | 32,384 | 64.34% | 1,058 | 2.10% |
| 1932 | 23,029 | 53.66% | 17,871 | 41.64% | 2,013 | 4.69% |
| 1928 | 29,710 | 75.80% | 9,110 | 23.24% | 374 | 0.95% |
| 1924 | 22,341 | 74.35% | 4,007 | 13.33% | 3,701 | 12.32% |
| 1920 | 17,343 | 68.66% | 6,815 | 26.98% | 1,101 | 4.36% |
| 1916 | 6,167 | 47.15% | 6,091 | 46.57% | 822 | 6.28% |
| 1912 | 2,633 | 23.15% | 3,347 | 29.42% | 5,395 | 47.43% |
| 1908 | 6,978 | 58.00% | 4,476 | 37.20% | 577 | 4.80% |
| 1904 | 7,383 | 68.37% | 2,110 | 19.54% | 1,306 | 12.09% |
| 1900 | 7,723 | 65.71% | 3,686 | 31.36% | 344 | 2.93% |
| 1896 | 7,867 | 66.23% | 3,829 | 32.24% | 182 | 1.53% |
| 1892 | 5,819 | 59.45% | 3,217 | 32.87% | 752 | 7.68% |
| 1888 | 6,299 | 62.47% | 3,177 | 31.51% | 607 | 6.02% |
| 1884 | 6,521 | 65.35% | 3,000 | 30.07% | 457 | 4.58% |
| 1880 | 6,796 | 66.39% | 3,148 | 30.75% | 293 | 2.86% |
| 1876 | 6,133 | 63.77% | 3,030 | 31.51% | 454 | 4.72% |
| 1872 | 5,869 | 70.68% | 2,321 | 27.95% | 114 | 1.37% |
| 1868 | 5,338 | 69.77% | 2,313 | 30.23% | 0 | 0.00% |
| 1864 | 5,093 | 72.83% | 1,900 | 27.17% | 0 | 0.00% |
| 1860 | 4,349 | 69.22% | 1,672 | 26.61% | 262 | 4.17% |
| 1856 | 4,049 | 67.63% | 1,920 | 32.07% | 18 | 0.30% |
| Year | Republican | Democratic | Third party(ies) | |||
|---|---|---|---|---|---|---|
| No. | % | No. | % | No. | % | |
| 2024 | 48,755 | 50.97% | 43,178 | 45.14% | 3,722 | 3.89% |
Government
[edit]County officials
[edit]| Party | Name | Position | |
|---|---|---|---|
| R | Tony Bernard | Commissioner | |
| R | Rick Hernandez | Commissioner | |
| R | Denny Malloy | Commissioner | |
| R | Martha Yoder | Auditor | |
| R | Randy Law | Clerk of Courts | |
| D | Lawrence M. D'Amico | Coroner | |
| R | David DeChristofaro | Engineer | |
| D | Dennis Watkins | Prosecuting Attorney | |
| R | Dawn Zinni | Recorder | |
| R | Michael G. Wilson | Sheriff | |
| R | Agostino Ragozzino | Treasurer | |
Judicial representation
[edit]| Party | Name | Position | |
|---|---|---|---|
| R | Sarah Thomas Kovoor [33] | Court of Common Pleas | |
| D | Ronald J. Rice [34] | Court of Common Pleas | |
| D | Cynthia Wescott Rice [35] | Court of Common Pleas | |
| D | Sean J. O'Brien[36] | Court of Common Pleas | |
| R | David Engler | Court of Common Pleas Juvenile Division | |
| D | Samuel F. Bluedorn | Court of Common Pleas Juvenile Division | |
| D | James A. Fredericka | Court of Common Pleas Probate Court | |
| R | Thomas A. Campbell | County Municipal Court, Central District | |
| I | Marty D. Nosich | County Municipal Court, Eastern District | |
| D | Jeffrey D. Adler | Girard Municipal Court | |
| D | Philip M. Vigorito | Newton Falls Municipal Court | |
| D | Christopher J. Shaker | Niles Municipal Court | |
| R | Natasha Natale | Warren Municipal Court | |
| D | Patty Knepp | Warren Municipal Court | |
| R | Scott Lynch | 11th District Court of Appeals | |
| R | Matt Lynch | 11th District Court of Appeals | |
| R | John J. Eklund | 11th District Court of Appeals | |
| R | Eugene A. Lucci | 11th District Court of Appeals | |
| R | Robert Patton | 11th District Court of Appeals | |
Legislative representation
[edit]| Party | Name | District | Body | |
|---|---|---|---|---|
| R | Nick Santucci | 64 | Ohio House of Representatives | |
| R | David Thomas | 65 | Ohio House of Representatives | |
| R | Sandra O'Brien | 32 | Ohio Senate | |
| R | David Joyce | 14 | U.S. House of Representatives | |
| R | Bernie Moreno | Statewide | U.S. Senate | |
| R | Jon Husted | Statewide | U.S. Senate | |
Higher learning
[edit]- Kent State University Trumbull is a regional campus of Kent State University, offering several associate degrees and a few bachelor's degrees.[37]
- Trumbull County Career and Technical Center is a vocational school, offering different learning and career advancement opportunities for both high school and adult learners.[38]
Communities
[edit]
Cities
[edit]Villages
[edit]Townships
[edit]Defunct township
[edit]Census-designated places
[edit]Unincorporated communities
[edit]Ghost towns
[edit]- Antietam (in Hartford)
- Bentley (in Brookfield)
- Brockway (in Hartford)
- Chestnut Ridge (in Hubbard)
- Dewey (in Kinsman)
- Doughton (in Hubbard)
- Germantown (in Hubbard)
- Kingsbury (in Mecca)
- Longsville (in Hubbard)
- Mosier (in Liberty)
- Oil Diggings (in Mecca)
- Old Burg Hill (in Hartford)
- Penza (Liberty/ Hubbard border)
- Superior (in Vernon)
- Walnut Hill (in Brookfield)
- Wassie (Bristolville/ Champion border)
- York (in Gustavus)
- Ohltown (in Weathersfield)
The Camp Ravenna Joint Military Training Center, formally known as the Ravenna Training and Logistics Site and commonly known as the Ravenna Arsenal, occupies a small part of Braceville Township.
Education
[edit]School districts include:[40]
- Bloomfield-Mespo Local School District
- Bristol Local School District
- Brookfield Local School District
- Cardinal Local School District
- Champion Local School District
- Girard City School District
- Howland Local School District
- Hubbard Exempted Village School District
- Jackson-Milton Local School District
- Joseph Badger Local School District
- LaBrae Local School District
- Lakeview Local School District
- Liberty Local School District
- Lordstown Local School District
- Maplewood Local School District
- Mathews Local School District
- McDonald Local School District
- Newton Falls Exempted Village School District
- Niles City School District
- Southington Local School District
- Warren City School District
- Weathersfield Local School District
- Youngstown City School District
See also
[edit]References
[edit]- Specific
- ^ "Ohio County Profiles: Trumbull County" (PDF). Ohio Department of Development. Archived from the original (PDF) on June 21, 2007. Retrieved April 28, 2007.
- ^ a b "Trumbull County, Ohio". Census.gov.
- ^ a b "State & County QuickFacts". United States Census Bureau. Retrieved August 28, 2022.
- ^ "Find a County". National Association of Counties. Archived from the original on May 31, 2011. Retrieved June 7, 2011.
- ^ About Warren: "Early History" Archived February 10, 2009, at the Wayback Machine, City of Warren, Ohio
- ^ Histories of Trumbull and Mahoning Counties, Vol. 2; H. Z. Williams; 1858
- ^ "Treaty With The Wyandot, Etc., 1795". Oklahoma State University Libraries Tribal Treaties Database.
- ^ "OTTAWA | Encyclopedia of Cleveland History | Case Western Reserve University". May 11, 2018.
- ^ "Trumbull County data". Ohio State University Extension Data Center. Archived from the original on September 27, 2016. Retrieved April 28, 2007.
- ^ "2010 Census Gazetteer Files". United States Census Bureau. August 22, 2012. Archived from the original on May 4, 2014. Retrieved February 11, 2015.
- ^ "TRUMBULL COUNTY TOURISM BUREAU". Archived from the original on April 24, 2009.
- ^ "U.S. Decennial Census". United States Census Bureau. Retrieved February 11, 2015.
- ^ "Historical Census Browser". University of Virginia Library. Retrieved February 11, 2015.
- ^ Forstall, Richard L., ed. (March 27, 1995). "Population of Counties by Decennial Census: 1900 to 1990". United States Census Bureau. Retrieved February 11, 2015.
- ^ "Census 2000 PHC-T-4. Ranking Tables for Counties: 1990 and 2000" (PDF). United States Census Bureau. April 2, 2001. Archived (PDF) from the original on October 9, 2022. Retrieved February 11, 2015.
- ^ "1980 Census of Population - General Social and Economic Characteristics - Ohio- Table 59 - Persons by Spanish Origin, Race, and Sex: 1980 AND Table 58 - Race by Sex: 1980" (PDF). United States Census Bureau. p. 49-67 and 27-47.
- ^ "1990 Census of Population - General Population Characteristics - Ohio: Table 6 - Race and Hispanic Origin" (PDF). United States Census Bureau. p. 21-95.
- ^ "P004: Hispanic or Latino, and Not Hispanic or Latino by Race – 2000: DEC Summary File 1 – Trumbull County, Ohio". United States Census Bureau.
- ^ "P2: Hispanic or Latino, and Not Hispanic or Latino by Race – 2010: DEC Redistricting Data (PL 94-171) – Trumbull County, Ohio". United States Census Bureau.
- ^ "P2: Hispanic or Latino, and Not Hispanic or Latino by Race – 2020: DEC Redistricting Data (PL 94-171) – Trumbull County, Ohio". United States Census Bureau.
- ^ included in the Asian category in the 1980 Census
- ^ included in the Asian category in the 1990 Census
- ^ not an option in the 1980 Census
- ^ not an option in the 1990 Census
- ^ a b c "DP-1 Profile of General Population and Housing Characteristics: 2010 Demographic Profile Data". United States Census Bureau. Archived from the original on February 13, 2020. Retrieved January 19, 2016.
- ^ "Population, Housing Units, Area, and Density: 2010 - County". United States Census Bureau. Archived from the original on February 13, 2020. Retrieved January 19, 2016.
- ^ "DP02 SELECTED SOCIAL CHARACTERISTICS IN THE UNITED STATES – 2006-2010 American Community Survey 5-Year Estimates". United States Census Bureau. Archived from the original on February 13, 2020. Retrieved January 19, 2016.
- ^ "DP03 SELECTED ECONOMIC CHARACTERISTICS – 2006-2010 American Community Survey 5-Year Estimates". United States Census Bureau. Archived from the original on February 13, 2020. Retrieved January 19, 2016.
- ^ Sullivan, Robert David; ‘How the Red and Blue Map Evolved Over the Past Century’; America Magazine in The National Catholic Review; June 29, 2016
- ^ "Trumbull County Board of Elections". boe.co.trumbull.oh.gov. Retrieved October 26, 2022.
- ^ Leip, David. "Dave Leip's Atlas of U.S. Presidential Elections". uselectionatlas.org. Retrieved May 3, 2018.
- ^ "2024 Senate Election (Official Returns)". Commonwealth of Texas by county. November 5, 2024. Retrieved December 5, 2024.
- ^ "Trumbull County Common Pleas Court General Division".
- ^ "Trumbull County Common Pleas Court General Division".
- ^ "Trumbull County Common Pleas Court General Division".
- ^ "Trumbull County Common Pleas Court General Division".
- ^ Kent State University Trumbull
- ^ "Home". tctcadulttraining.org.
- ^ "Trumbull County". August 26, 2018.
- ^ "2020 CENSUS - SCHOOL DISTRICT REFERENCE MAP: Trumbull County, OH" (PDF). U.S. Census Bureau. Retrieved January 12, 2025. - Text list
External links
[edit]Places adjacent to Trumbull County, Ohio | |
|---|---|
Municipalities and communities of Trumbull County, Ohio, United States | ||
|---|---|---|
| Cities |  | |
| Villages | ||
| Townships | ||
| CDPs | ||
| Unincorporated communities | ||
| Footnotes | ‡This populated place also has portions in an adjacent county or counties | |
| International | |
|---|---|
| National | |
| Geographic | |
| Other | |
Trumbull County, Ohio
View on GrokipediaHistory
Formation and early settlement
Trumbull County was formed on July 10, 1800, within the Northwest Territory, originally encompassing the entire Connecticut Western Reserve, a tract of approximately 3 million acres in northeastern Ohio.[2][7] The county derived its name from Jonathan Trumbull Sr., Connecticut's governor during the American Revolution and a signer of the Declaration of Independence, reflecting the strong ties to New England interests in the region.[7] This establishment followed surveys initiated by the Connecticut Land Company, which had purchased the Western Reserve from the state of Connecticut in 1795 for $1.2 million after the legislature relinquished overlapping colonial charter claims to the federal government while retaining western land rights as compensation.[7][8] The Western Reserve's land distribution was managed by the Connecticut Land Company, a syndicate of 35 investors who subdivided the territory into townships through early surveys starting in 1796, enabling sales to prospective settlers primarily from Connecticut, Massachusetts, and New York.[8][9] Prior to widespread European arrival, the area served as hunting grounds and supported seasonal villages of Native American tribes, including the Lenape (Delaware) and Wyandot, with fur traders engaging in limited exchanges; formal cessions of title, such as through the 1795 Treaty of Greenville and subsequent agreements, facilitated legal settlement by clearing indigenous claims under federal oversight.[10][2] Warren, platted in 1799 by surveyors including Moses Warren after whom it was named, became the county seat upon organization and saw its first permanent settler, Ephraim Quinby, arrive in 1800, establishing a nucleus for governance and trade.[11] Early inhabitants focused on subsistence agriculture, clearing dense forests for farms growing corn, wheat, and potatoes, while population expanded rapidly from New England migrants seeking affordable land, reaching several thousand by the 1810 census amid Ohio's statehood in 1803, which prompted the gradual carving of adjacent counties from Trumbull's vast expanse.[2][12] This agrarian base supported township formations and basic infrastructure, such as log cabins and rudimentary roads, laying the groundwork for community development through the 1820s.[13]Industrial growth in the 19th and 20th centuries
The Pennsylvania and Ohio Canal, constructed between 1835 and 1840, traversed Trumbull County through communities such as Newton Falls, Warren, and Niles, enabling the transport of coal and iron resources that laid the groundwork for industrial expansion by linking local mines to broader markets.[14] [15] By the late 19th century, railroads supplanted canals, with lines like the Mahoning Coal Railroad facilitating coal extraction from area mines, including those near Church Hill, and supporting the shift toward heavy manufacturing.[16] These infrastructure developments positioned Trumbull County within the Mahoning Valley's emerging steel production hub, where proximity to iron ore, coal, and water resources along the Mahoning River proved advantageous after the 1890s.[17] Steel manufacturing took root prominently in the early 20th century, with the establishment of Trumbull Steel in Warren in 1906 as the county's first integrated steelworks, followed by the formal organization of the Trumbull Steel Company in 1912, which initially produced 60,000 tons of sheet steel annually.[18] [6] The facility, later rebranded as Republic Steel, expanded amid rising demand, contributing to the Mahoning Valley's designation as the "Steel Valley" due to its concentration of mills processing ore into finished products.[19] Coal mining complemented steel operations, drawing early labor to underground operations and providing essential fuel for blast furnaces.[20] Waves of European immigrants, including Italians arriving as early as 1873 for mine work, Slovaks, Greeks, and Irish laborers, swelled the workforce to meet industrial needs, nearly doubling the county's population from 1900 to 1920.[20] [21] This growth peaked around World War II, when Republic Steel's refurbished blast furnace in Warren, completed in 1939, achieved production highs exceeding 400,000 tons and supported national wartime output of steel for armaments and infrastructure.[22] The industry's booms during both world wars underscored Trumbull County's role in U.S. heavy manufacturing, with steel mills driving economic vitality through high employment and output until the mid-20th century.[19]Deindustrialization and post-1970s decline
The deindustrialization of Trumbull County accelerated following the September 19, 1977, closure of the Youngstown Sheet & Tube Company's Campbell Works mill, an event known locally as "Black Monday," which immediately eliminated 5,000 jobs and triggered a cascade of shutdowns across the Mahoning Valley encompassing Trumbull and adjacent Mahoning counties.[23] Over the subsequent five years, approximately 50,000 steel and related manufacturing positions vanished in the region, with Trumbull County—home to Warren's Republic Steel operations and other heavy industry—experiencing proportional losses amid the collapse of integrated steel production.[23][24] U.S. Steel's closure of its Youngstown-area facilities in 1979 further compounded the crisis, as aging infrastructure proved uncompetitive against imported steel surging amid 1970s recessions and lax foreign trade enforcement.[25] Causal factors included intensified global competition from lower-cost producers, particularly Japanese and European mills benefiting from modern technologies and weaker currencies, which flooded U.S. markets and eroded domestic market share; high unionized labor costs, averaging far above international benchmarks, reduced flexibility in an era of rising automation; and stringent environmental regulations, such as Mahoning River water quality standards, that imposed compliance burdens on outdated facilities without equivalent constraints abroad.[26][27] Trade policies exacerbating import surges, rather than isolated corporate decisions, drove the structural shift toward efficient minimills elsewhere, countering narratives attributing decline primarily to executive malfeasance by highlighting empirical productivity gaps—U.S. steel output per worker quintupled post-1980s via mechanization, yet employment plummeted due to these efficiencies outpacing demand recovery.[28][27] The fallout manifested in acute population exodus and urban decay, exemplified by Warren's shrinkage from 63,494 residents in 1970 to 40,768 by 2010, as families fled absent high-wage opportunities, leaving thousands of vacant properties and blighted neighborhoods.[29] While some workforce adaptation occurred toward lower-paying service sectors, per capita income stagnated relative to national averages, perpetuating socioeconomic distress without reversing the manufacturing base erosion. Efforts to offset losses via Utica Shale gas exploration in eastern Ohio yielded limited regional gains—around 1,500 jobs announced in the Mahoning Valley by 2012—but failed to materialize transformative employment, as drilling's high-skill, transient nature overstated local benefits amid broader fracking critiques for exaggerating net job creation.[30][31]Geography
Physical features and terrain
Trumbull County lies within the glaciated section of the Allegheny Plateau in northeastern Ohio, featuring rolling terrain sculpted by Pleistocene glacial advances that deposited till and shaped undulating hills and valleys.[32] The landscape reflects the broader physiographic characteristics of the region, with glacial outwash and moraines contributing to varied surface features including low relief plains and subtle escarpments.[33] The county spans 618 square miles of land area, dominated by forested uplands, scattered wetlands, and riverine corridors.[34] Elevations average approximately 974 feet above sea level, ranging from around 700 feet in river bottoms to over 1,200 feet on higher ridges.[35] Soils primarily consist of glacial till-derived types, such as the Trumbull series—very deep, poorly drained loams formed in low-lime till on plains—which support historical agricultural use where artificially drained but remain prone to saturation in natural states.[36] The Mahoning River serves as the principal waterway, traversing the county northward and creating narrow floodplains susceptible to periodic inundation due to its meandering course through glacial sediments.[37] Wetlands, characterized by hydric soils that develop anaerobic layers from prolonged saturation or flooding, occur extensively in depressions and along tributaries, comprising swamp forest types like elm-ash-red maple associations.[38] Upland areas historically supported oak-dominated forests on better-drained slopes, though glaciation homogenized much of the pre-existing terrain into a mosaic of till plains and shallow valleys.[39]Adjacent counties and major highways
Trumbull County borders Ashtabula County to the north, Mahoning County to the south, Portage County and Geauga County to the west, Mercer County, Pennsylvania to the east, and Crawford County, Pennsylvania to the northeast.[40][41] Key highways providing regional connectivity include Interstate 80, which traverses the county east-west as part of the Ohio Turnpike; U.S. Route 422, running east-west through central areas; U.S. Route 62; and State Route 11, offering north-south access along the eastern side.[41][42] Other state routes such as Ohio State Route 5, Ohio State Route 7, Ohio State Route 45, Ohio State Route 46, Ohio State Route 82, Ohio State Route 87, and Ohio State Route 88 facilitate intra-county and local travel.[42] These routes link Trumbull County to surrounding areas, though public transit within the county remains limited to on-demand services rather than extensive fixed routes.[43]Economy
Historical industries and peak employment
Trumbull County's historical industries centered on steel production and coal mining, with steel emerging as the dominant sector by the early 20th century. The Trumbull Steel Company, established in Warren in 1912, became the county's first and largest steel manufacturer, initially producing 60,000 tons of sheet steel annually for electrical and automotive applications.[6] This facility expanded through mergers, including with the Trumbull Cliffs Blast Furnace, which supplied pig iron exclusively to the steel operations, and was incorporated into Republic Steel Corporation in 1930.[44] Republic Steel's Warren plant employed over 6,000 workers at its height, supporting ancillary manufacturing such as machinery for steel mills and coal mines produced by firms like Trumbull Manufacturing Company.[45][46] Steel output surged during World War I and especially World War II, when demand for war materials drove the industry to capacity, with Republic Steel operations contributing to national production peaks of over 80 million tons annually across U.S. facilities in 1944.[19] Employment in Trumbull's steel sector reached its zenith in the 1940s, fueled by wartime expansion, though precise county-wide figures are aggregated within broader Mahoning Valley data showing tens of thousands in steel-related jobs.[47] The industry's supply chain relied heavily on Great Lakes shipping for iron ore from Minnesota's Mesabi Range and coal from Appalachian sources, transported via the Mahoning River and rail connections to Lake Erie ports.[48] Coal mining, concentrated in the county's eastern townships like Mineral Ridge and Vienna, predated steel dominance and peaked in the 1870s, when Trumbull led Ohio in production with 1,065,000 tons in 1875 alone.[49] Commercial extraction began around 1825, with major output from 1870 to 1884 supporting local ironworks and fueling blast furnaces; by 1867, the county mined over 7.1 million bushels, comprising more than one-fifth of Ohio's total.[50] Mines like those in Hubbard and Brookfield employed hundreds seasonally, with rail lines such as the Mineral Ridge Railroad facilitating transport, though production waned post-1880s as steel shifted toward imported coking coal.[51] Combined, these industries positioned Trumbull as a key contributor to Ohio's industrial output, with steel exports via Great Lakes routes bolstering U.S. manufacturing during mid-20th-century peaks.[52]Current economic sectors and challenges
The economy of Trumbull County primarily employs approximately 87,000 workers across service-oriented sectors, with manufacturing remaining the largest industry at 16,426 jobs in 2023, followed by health care and social assistance, and retail trade.[53] Remnants of heavy industry persist in areas such as plastics fabrication, auto parts production, steel processing, and emerging electric vehicle components, though these represent a fraction of historical peaks.[54] Transportation and warehousing have shown growth, with a 34% employment increase in recent years, supporting logistics amid regional diversification.[55] In 2023, the county's median household income stood at $55,088, below the Ohio state average of approximately $66,000 and the national figure of $74,580.[53] Poverty affects 16.8% of residents, exceeding state and national rates of 13.3% and 11.5%, respectively.[53] Unemployment averaged 5.2% in 2024, higher than the national rate of 4.1% and persisting above U.S. averages since the 2008 recession, reflecting structural labor market frictions.[56] Key challenges include a heavy historical dependence on unionized manufacturing vulnerable to offshoring and automation, which has constrained workforce adaptability and entrepreneurship in non-traditional sectors. Skill mismatches exacerbate underemployment, as many residents lack training in growing fields like advanced logistics or healthcare support, while regulatory burdens on small businesses and extended welfare benefits may disincentivize labor force participation.[55] The county's "at-risk" designation by the Appalachian Regional Commission underscores these ongoing vulnerabilities, with limited diversification leaving the economy susceptible to national manufacturing cycles.[57]Revitalization efforts and future prospects
In recent years, Trumbull County has pursued revitalization through state and federal grants aimed at site preparation and infrastructure. A $6.2 million grant from the Ohio Department of Development's 2024 Building Demolition and Site Revitalization program supported the demolition of blighted structures to clear land for potential development, targeting urban decay in areas like Warren.[58] Similarly, $2.7 million in American Rescue Plan funds from the U.S. Department of Commerce was allocated in 2022 to bolster manufacturing infrastructure, focusing on equipment upgrades and facility improvements to attract new employers.[59] These efforts complement private-sector expansions, such as Foxconn's planned addition of up to 800 jobs at its facility by tripling employment, announced in 2025, which could inject $8-12 million in investments.[60] Workforce development initiatives, including OhioMeansJobs centers, provide training and job matching services, with recent grants like a $600,000 award projected to create 205 new jobs and retain 360 in retail and commercial sectors around Howland Commons Plaza.[61] [62] The county's support for the Valley Vision strategy, including a $500,000 commissioner allocation in 2025, emphasizes regional coordination for innovation and health care facilities, yielding announcements of over 1,200 jobs from multiple projects.[63] [64] Energy sector prospects include limited but growing Utica Shale activity; while southern Trumbull holds marginal potential compared to southeastern Ohio plays, a resurgence in regional drilling since 2024 has prompted test wells, with the first Utica well drilled in the county in 2020 signaling possible future extraction if commodity prices rise.[65] [66] Subsidies have mixed outcomes, with short-term job gains but persistent fiscal strains; despite influxes like $6.4 million in state development aid in FY2023, county budgets faced $2 million cuts due to revenue shortfalls, highlighting inefficiencies in grant-dependent models that fail to reverse structural declines.[67] [68] Critics, including local officials, note that such programs often subsidize retention over organic growth, as evidenced by broader Ohio cases like the terminated HB6 coal subsidies, which cost over $500 million without sustaining employment.[69] Successes appear in targeted small business incentives, where state housing grants under programs like Welcome Home Ohio have funded rehabilitation of nine homes with $270,000, potentially spurring local entrepreneurship.[70] Future prospects remain cautious, with Ohio Department of Development projections estimating a 20-31% population drop by 2050 absent policy shifts, mirroring declines in peer Rust Belt counties like Mahoning (22% loss).[71] Sustained recovery would require deregulation to lower energy costs—leveraging Utica potential—and trade reforms to revive manufacturing, as subsidies alone have not stemmed annual outflows of 0.4% since 2010; without these, outmigration to growing metros will continue.[72] [73]Demographics
Population trends and census data
The population of Trumbull County peaked in the 1970 census at 226,207 residents, reflecting industrial expansion in the Mahoning Valley, but entered a pattern of decline thereafter amid Rust Belt deindustrialization and sustained out-migration to areas with stronger job prospects.[4] Decennial census data show a continued downward trajectory, with 210,312 residents enumerated in 2010 and 201,977 in 2020, representing a 3.9% decrease over the decade driven largely by negative net domestic migration exceeding natural increase (births minus deaths).[74] Post-2020 estimates confirm the trend's persistence, albeit at a moderated pace, with the county's population at 200,643 in 2022, reflecting an approximate annual decline of 0.3% from the 2020 baseline as out-migration persists amid limited local economic retention of younger workers.[72] Natural population change remains marginally negative, with death rates outpacing births due to an aging demographic structure where older cohorts predominate, further amplified by net migration losses estimated through annual updates incorporating vital statistics and mobility data.[4] Projections for 2025 place the county's population at approximately 199,700, assuming ongoing negative growth rates of around -0.2% annually, consistent with broader Ohio Rust Belt counties facing structural depopulation challenges.[75] Within the county, population concentrates in the urban Warren micropolitan area, which retains relative stability through some service-sector anchors, while rural townships undergo accelerated depopulation from farm consolidation, service withdrawals, and youth exodus, exacerbating uneven spatial declines.[76]Racial, ethnic, and age composition
As of the 2020 United States Census, Trumbull County's population was 85.4% non-Hispanic White, 8.0% Black or African American (non-Hispanic), 2.6% Hispanic or Latino (of any race), 0.5% Asian (non-Hispanic), 0.1% American Indian and Alaska Native (non-Hispanic), and 3.1% two or more races (non-Hispanic).[53][77] Smaller proportions included 0.02% Native Hawaiian and Other Pacific Islander. These figures reflect a modest increase in non-White shares since 2010, when non-Hispanic Whites comprised 88.2%, driven by slight rises in multiracial and Hispanic identifications amid overall population decline.[72]| Race/Ethnicity (2020) | Percentage |
|---|---|
| White (non-Hispanic) | 85.4% |
| Black (non-Hispanic) | 8.0% |
| Hispanic or Latino | 2.6% |
| Two or more races | 3.1% |
| Asian | 0.5% |
| Other | <0.5% |
Income, poverty, and housing statistics
The median household income in Trumbull County was $55,088 (in 2023 dollars) for the 2019–2023 period, compared to the Ohio state median of $66,990 over the same timeframe.[3] Per capita income stood at $31,292 during this period, also trailing the state figure of $38,800.[3] These metrics reflect persistent economic pressures from deindustrialization, with household incomes concentrated in manufacturing and service sectors that offer limited wage growth relative to urban benchmarks. The poverty rate for persons in Trumbull County was 16.8% in the 2023 five-year estimate, exceeding the Ohio average of 13.4% and indicating elevated economic vulnerability, particularly among families in former steel-mill communities. This rate has hovered above state levels since the 1980s industrial downturn, with urban pockets like Warren exhibiting rates over 20% in recent ACS data, while rural areas show lower incidences around 10–12%.[76] Housing statistics reveal a median value of $128,400 for owner-occupied units in 2019–2023, substantially below Ohio's $230,000 median, consistent with affordable but aging stock from mid-20th-century expansion.[3] The owner-occupied housing unit rate was 71.5%, higher than the national average but indicative of limited rental market options.[3] Vacancy rates averaged around 9–10% for total housing units in recent ACS surveys, elevated due to outmigration and property abandonment in depopulated neighborhoods, though rental vacancies have stabilized at 6.7%.[81] These patterns underscore disparities between stable suburban owner-occupancy and higher vacancy in core urban zones.Governance
County government structure and officials
Trumbull County is administered by a board of three commissioners elected at-large to staggered four-year terms, serving as the primary executive and legislative body for county operations.[82] The board manages county finances through budgeting, taxation, appropriation, and purchasing; oversees property management; and approves actions such as annexations, road vacations, drainage improvements, water and sewer districts, solid waste disposal, and tax abatements.[82] Commissioners also appoint department heads for entities including the 911 Center, Job and Family Services, and Building Inspection, while participating in boards like the Planning Commission for zoning and development matters.[82] As of 2025, the commissioners are Rick Hernandez (president, Republican), Tony Bernard (Republican), and Denny Malloy (Republican), with terms extending through early 2029 for recent elections.[83] They conduct weekly public workshops on Tuesdays and regular meetings on Wednesdays at 10:30 a.m. in the County Administration Building in Warren.[84] The board promotes public-private partnerships across sectors including human services, economic development, health, infrastructure, job training, and agriculture.[82] Facing fiscal pressures from a declining revenue base, commissioners have implemented $2 million in budget cuts in recent years, maintaining cash reserves of approximately $13.9 million—about 20% of the total budget—while avoiding immediate tax increases or new levies.[85][86] Other key elected county officials include the auditor (Marth C. Yoder), treasurer (Sam Lamancusa), engineer (David DeChristofaro), sheriff (Michael G. Wilson), prosecutor (Dennis Watkins), coroner (Lawrence M. D’Amico), recorder (Dawn Zinni-Hanni), clerk of courts (Randy Law), and county clerk (Lisa DeNunzio Blair).[83]Judicial and law enforcement systems
The Trumbull County Court of Common Pleas General Division exercises original jurisdiction over adult felony and serious misdemeanor criminal cases, as well as civil actions involving claims exceeding $15,000, including personal injury and business disputes.[87] It also oversees grand and petit jury proceedings, appeals from administrative agencies, civil stalking protection orders, and specialized programs such as drug court and adult probation.[87] Complementing the Common Pleas Court are several municipal courts, including Warren Municipal Court, Niles Municipal Court, Newton Falls Municipal Court, and Girard Municipal Court, which adjudicate misdemeanors, traffic offenses, and small claims.[88][89][90] Additionally, the Trumbull County Central District Court handles cases in specific areas like Cortland.[91] The Trumbull County Sheriff's Office serves as the primary law enforcement agency, functioning as a full-service operation with 45 sworn officers responsible for patrol, criminal investigations, jail management, and court security.[92] The office contributes deputies to the Trumbull Area Gang (TAG) Drug Task Force, targeting drug trafficking, gangs, and related crimes.[93] Property crime rates in the county align closely with national averages, recorded at 34.5 on an index where the U.S. average stands at 35.4.[94] Law enforcement has responded to the opioid epidemic, amid which the county reported 30 confirmed overdose deaths in the first seven months of 2024.[95] County-wide budget reductions for 2025, trimming departmental requests from over $81 million to approximately $68 million, have prompted concerns over potential delays in court processing and sheriff operations due to underfunding.[96][97] Community policing initiatives include the Sheriff's Mounted Unit, which supports event patrols, crowd control, and public relations efforts, as well as the 2025 adoption of the Blue Envelope program to facilitate safer interactions with developmentally disabled drivers.[98][99] Furthermore, around 300 officers from 32 local agencies have undergone crisis intervention training to address mental health incidents effectively.[100]State and federal representation
Trumbull County is coterminous with Ohio's 14th congressional district in the United States House of Representatives, represented by David P. Joyce, a Republican first elected in 2012.[101] Following the 2020 United States Census, which recorded a population decline in Ohio prompting the loss of one congressional seat statewide, the Ohio Redistricting Commission redrew district boundaries in 2022; this reassigned Trumbull County from the previous 17th district—historically centered on Youngstown and sharing territory with Mahoning County—to the 14th, which now encompasses northeastern counties bordering Pennsylvania and Lake Erie.[102] The shift aimed to balance population across 15 districts, with Trumbull's apportionment reflecting regional deindustrialization and out-migration since the 2010 census.[103] In the Ohio State Senate, the county comprises Ohio Senate District 32, represented by Sandra O'Brien, a Republican serving since 2023 after prior terms in the Ohio House.[104] This district, redrawn post-2020 census to include Ashtabula, Geauga, and Trumbull counties, adjusted for population changes by consolidating rural and suburban areas in northeast Ohio, maintaining approximate equal representation of around 376,000 residents per district.[105] For the Ohio House of Representatives, Trumbull County primarily falls within the 64th district, represented by Nick Santucci, a Republican elected in 2022 and reelected in 2024, covering urban centers like Warren and Niles.[106] Portions of the county may align with adjacent districts due to 2022 redistricting, which subdivided larger areas to achieve parity near 119,000 constituents per district amid the county's 201,977 population in 2020 and subsequent decline.[107] These representatives, all affiliated with the Republican Party, reflect the county's evolving conservative orientation in state and federal delegations following demographic and economic shifts.[108]Politics
Historical voting patterns
Trumbull County displayed robust Democratic Party allegiance in electoral contests from the mid-20th century through the 1980s, driven primarily by the mobilization of labor unions tied to the steel mills, auto plants, and other heavy industries concentrated around Warren.[109] These unions, including the United Steelworkers, prioritized candidates advocating for protective tariffs, workplace regulations, and New Deal-style economic interventions that sustained manufacturing employment.[109] Voter turnout in presidential elections often exceeded statewide averages during this era, fueled by organized labor's door-to-door campaigns and factory-based endorsements, with margins favoring Democrats most pronounced in urban Warren precincts compared to rural townships where agricultural and small-business interests occasionally tempered support.[110] In presidential races, the county backed Democratic nominees consistently, contributing to its reputation as part of the solidly blue Mahoning Valley bloc. For instance, it supported John F. Kennedy in 1960 amid a tight national contest, Lyndon B. Johnson in the 1964 landslide, Hubert Humphrey in 1968 despite Richard Nixon's statewide victory, and Jimmy Carter in 1976, extending a Democratic streak traceable back several decades.[110] Even in 1972 and 1980, when Republicans swept Ohio, Trumbull's industrial base yielded narrower Republican margins than rural or suburban counties, underscoring union loyalty over national anti-Democratic sentiment.[110] Gubernatorial elections mirrored this pattern, with Democratic candidates like John J. Gilligan in 1970 securing strong pluralities in Trumbull amid union-backed pushes for state-level labor reforms and infrastructure spending.[111] Through the 1980s, incumbents such as Richard Celeste maintained county majorities by appealing to working-class voters concerned with economic stagnation in steel-dependent communities, though Republican Jim Rhodes occasionally narrowed gaps in off-year cycles.[112] This era's voting reflected causal ties between employment in unionized factories—peaking at over 20,000 steel jobs countywide in the 1970s—and partisan fidelity, independent of broader Ohio trends toward moderation.[109]Recent electoral shifts and influences
In the 2010s, Trumbull County underwent a marked partisan realignment, transitioning from a reliably Democratic stronghold—rooted in its unionized steel and manufacturing workforce—to delivering Republican presidential majorities, reflecting widespread voter frustration with economic stagnation following decades of deindustrialization.[113] This shift accelerated with Donald Trump's 2016 victory, where he captured 50.8% of the vote to Hillary Clinton's 45.5%, a 5.3-point margin that ended 28 years of Democratic dominance in presidential contests and exceeded expectations for a county with a history of supporting labor-backed candidates.[114] Trump's appeal centered on promises to revive manufacturing through tariffs and renegotiated trade deals, resonating amid the loss of approximately 20,000 factory jobs in Trumbull and adjacent Mahoning County since 2000, largely attributed to globalization policies like NAFTA that facilitated offshoring to lower-wage countries.[115] By 2020, Republican support solidified, with Trump winning 54.6% against Joe Biden's 44.2%—a 10.4-point edge that outpaced Ohio's statewide Republican margin of 8 points—driven by persistent grievances over unaddressed plant closures and wage erosion, as voters in this Rust Belt area prioritized candidates addressing causal factors like import competition over broader progressive platforms.[116] Local analyses highlight disillusionment among non-college-educated workers, including former union members who defected as independents, viewing Democratic trade stances as complicit in the sector's decline, which saw steel production plummet by over 50% regionally since the 1970s due to foreign subsidies and lax enforcement of fair trade rules.[117] While pockets of union loyalists persisted, citing entrenched party ties, the broader electorate's pivot underscored a rejection of policies perceived to favor global integration at the expense of domestic job security.[118] This trend extended into 2024, when Trump secured a third consecutive win in the county, the first such Republican streak in its history, further diverging from pre-2016 patterns where Democrats routinely held double-digit leads.[119] County-level data reveal Trump's margins expanding in rural and working-class precincts, contrasting with urban Democratic enclaves, as economic realism—evident in surveys linking vote choice to personal experiences of factory shutdowns—overrode traditional allegiances. These shifts, while influenced by national polarization, stem empirically from material conditions: Trumbull's median household income lagged 15% below the state average by 2020, correlating with higher Republican turnout among those hit hardest by automation and trade-induced unemployment.[120]| Election Year | Republican Vote Share | Democratic Vote Share | Republican Margin |
|---|---|---|---|
| 2016 | 50.8% | 45.5% | +5.3 points |
| 2020 | 54.6% | 44.2% | +10.4 points |