
Community hub
Recent from talks
Contribute something
Nothing was collected or created yet.
Louvain method
View on WikipediaThis article possibly contains original research. (April 2025) |
| Part of a series on | ||||
| Network science | ||||
|---|---|---|---|---|
| Network types | ||||
| Graphs | ||||
|
||||
| Models | ||||
|
||||
| ||||

The Louvain method for community detection is a greedy optimization method intended to extract non-overlapping communities from large networks created by Blondel et al.[1] from the University of Louvain (the source of this method's name).
Modularity optimization
[edit]The inspiration for this method of community detection is the optimization of modularity as the algorithm progresses. Modularity is a scale value between −1 (non-modular clustering) and 1 (fully modular clustering) that measures the relative density of edges inside communities with respect to edges outside communities. Optimizing this value theoretically results in the best possible grouping of the nodes of a given network. But because going through all possible configurations of the nodes into groups is impractical, heuristic algorithms are used.
In the Louvain Method of community detection, first small communities are found by optimizing modularity locally on all nodes, then each small community is grouped into one node and the first step is repeated. The method is similar to the earlier method by Clauset, Newman and Moore[2] that connects communities whose amalgamation produces the largest increase in modularity. The Louvain algorithm was shown to correctly identify the community structure when it exists, in particular in the stochastic block model.[3]
Algorithm description
[edit]Modularity
[edit]The value to be optimized is modularity, defined as a value in the range that measures the density of links inside communities compared to links between communities.[1] For a weighted graph, modularity is defined as:
![{\displaystyle [-1,1]}](https://wikimedia.org/api/rest_v1/media/math/render/svg/51e3b7f14a6f70e614728c583409a0b9a8b9de01)
![{\displaystyle Q={\frac {1}{2m}}\sum _{i=1}^{N}\sum _{j=1}^{N}{\bigg [}A_{ij}-{\frac {k_{i}k_{j}}{2m}}{\bigg ]}\delta (c_{i},c_{j}),}](https://wikimedia.org/api/rest_v1/media/math/render/svg/f99a07248d5e108638d66bac645a0719e987bfe4)
where:
- represents the edge weight between nodes i and j; see Adjacency matrix;
- and are the sum of the weights of the edges attached to nodes i and j, respectively;
- m is the sum of all of the edge weights in the graph;
- N is the total number of nodes in the graph;
- and are the communities to which the nodes i and j belong; and
- is Kronecker delta function:


Based on the above equation, the modularity of a community c can be calculated as:[4]

where
- is the sum of edge weights between nodes within the community c (each edge is considered twice); and
- is the sum of all edge weights for nodes within the community (including edges which link to other communities).


As nodes in different communities do not contribute to the modularity Q, it can be written as:

The Louvain method algorithm
[edit]The Louvain method works by repeating two phases.[1] In phase one, nodes are sorted into communities based on how the modularity of the graph changes when a node moves communities. In phase two, the graph is reinterpreted so that communities are seen as individual nodes. A detailed explanation is provided below.
Phase 1
[edit]
Each node in the network is assigned to its own community.
[edit]The Louvain method begins by considering each node v in a graph to be its own community. This can be seen in Figure 1, where each dot (representing nodes) is a unique color (representing which community the node belongs to).
Nodes are grouped into communities
[edit]For each node v, we consider how moving v from its current community C into a neighboring community C' will affect the modularity of the graph partition. In the pseudo-code below, this happens in the for-loop. We select the community C' with the greatest change in modularity, and if the change is positive, we move v into C'; otherwise we leave it where it is. This continues until the modularity stops improving.

function moveNodes(Graph G, Partition P):
    do
        old_modularity <- current_modularity_of_partition
        for v in V(G), do
            # find the community that causes the largest increase in modularity when v is moved into it
            C' <- argmax(delta_Q) # delta_Q is the change in modularity
            if delta_Q > 0, then
                move v into C'
            end if
        end for
    update current_modularity_of_partition
    while current_modularity_of_partition > old_modularity
    return P
end function
This process is applied repeatedly and sequentially to all nodes until no modularity increase can occur. Once this local maximum of modularity is hit, the first phase has ended. Figure 2 shows how the graph in Figure 1 might look after one iteration of phase 1.
Phase 2
[edit]Communities are reduced to a single node
[edit]For each community in our graph's partition, the individual nodes making up that community are combined and the community itself becomes a node. The edges connecting distinct communities are used to weight the new edges connecting our aggregate nodes.
This process is modeled in the pseudo-code, where the function aggregateGraph returns a new graph whose vertices are the partition of the old graph, and whose edges are calculated using the old graph. This function does not show the edges being weighted, but a simple modification would allow for that information to be tracked.

function aggregateGraph(Graph G, Partition P):
    V <- P
    E <- [(A,B) | (x,y) is in E(G), x is in A and A is in P, y is in B and B is in P]
    return Graph(V,E)
end function
Figure 3 shows what the graph from Figure 2 would look like after being aggregated. This graph is analogous to the graph in Figure 1 in the sense that each node is assigned to a single community. From here, the process can be repeated so that more nodes are moved into existing communities until an optimal level of modularity is reached.
The pseudo-code below shows how the previous two functions work together to complete the process.
function louvain(Graph G, Partition P):
    do
        P <- moveNodes(G, P)
        done <- length(P) == length(V(G)) # every community is a single node, despite running moveNodes
        if not done, then:
            G <- aggregateGraph(G, P)
            P <- singletonPartition(G)
        end if
    while not done
end function

function singletonPartition(Graph G):
    return [{v} | v is in V(G)] # each node is placed in its own community
end function
Time complexity
[edit]Generally, the Louvain method is assumed to have a time complexity of . Richard Blondel, co-author of the paper that originally published the Louvain method, seems to support this notion,[6] but other sources claim the time complexity is "essentially linear in the number of links in the graph,"[7] meaning the time complexity would instead be , where m is the number of edges in the graph. Unfortunately, no source has published an analysis of the Louvain method's time complexity so one is attempted here.


In the pseudo-code above, the function louvain controls the execution of the algorithm. It's clear to see that inside of louvain, moveNodes will be repeated until it is no longer possible to combine nodes into communities. This depends on two factors: how much the modularity of the graph can improve and, in the worst case, if the modularity can improve with every iteration of louvain, it depends on how quickly aggregateGraph will reduce the graph down to a single node.
If, in each iteration of louvain, moveNodes is only able to move one node into a community, then aggregateGraph will only be able to reduce the size of the graph by one. This would cause louvain to repeat v times. Since moveNodes iterates through all nodes in a graph, this would result in a time complexity of , where n is the number of nodes.

It is unclear if this situation is possible, so the above result should be considered a loose bound. Blondel et al. state in their original publication that most of the run time is spent in the early iterations of the algorithm because "the number of communities decreases drastically after just a few passes."[1] This can be understood by considering a scenario where moveNodes is able to move each node so that every community has two nodes. In this case, aggregateGraph would return a graph half the size of the original. If this continued, then the Louvain method would have a runtime of , although it is unclear if this would be the worst case, best case, average case, or none of those. Additionally, there is no guarantee the size of the graph would be reduced by the same factor with each iteration, and so no single logarithm function can perfectly describe the time complexity.

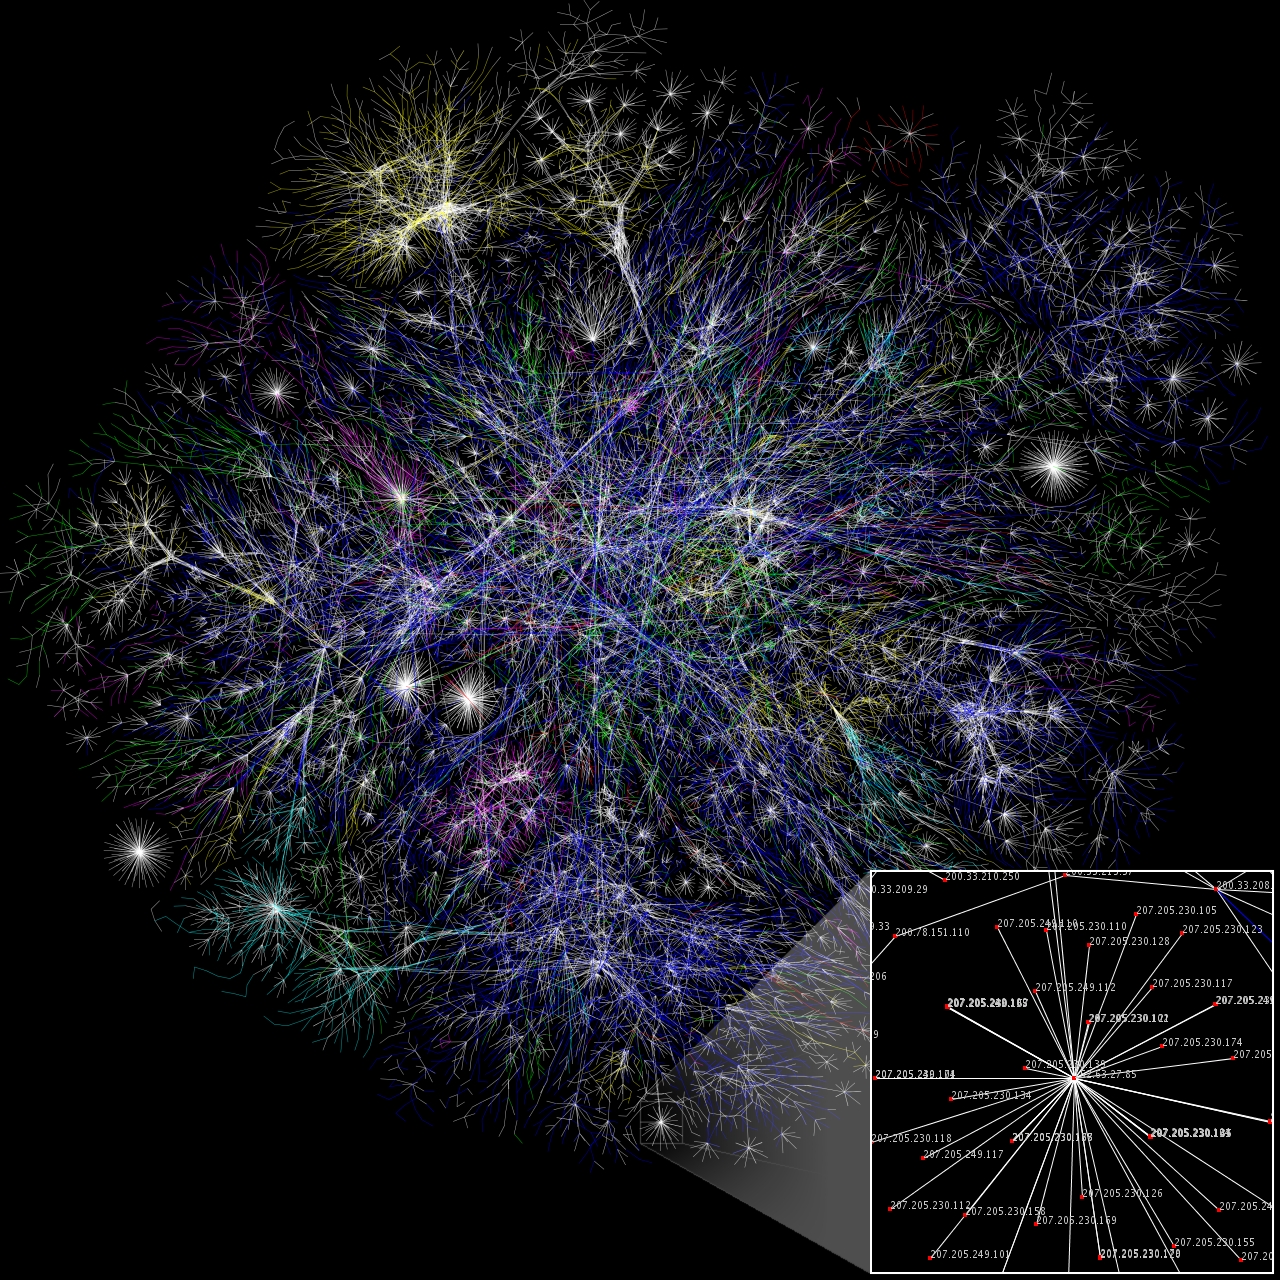
Previous uses
[edit]- Twitter social Network (2.4 Million nodes, 38 million links) by Josep Pujol, Vijay Erramilli, and Pablo Rodriguez:[8] The authors explore the problem of partitioning Online Social Networks onto different machines.
- Mobile phone Network (4 Million nodes, 100 Million links) by Derek Greene, Donal Doyle, and Padraig Cunningham:[9] Community-tracking strategies for identifying dynamic communities of different dynamic social networks.
- Detecting species in network-based dynamical model.[10]
Disadvantages
[edit]Louvain produces only non-overlapping communities, which means that each node can belong to at most one community. This is highly unrealistic in many real-world applications. For example, in social networks, most people belong to multiple communities: their family, their friends, their co-workers, old school buddies, etc. In biological networks, most genes or proteins belong to more than one pathway or complex. Furthermore, Louvain has been shown to sometimes produce arbitrarily badly connected communities, and has been effectively superseded (at least in the non-overlapping case) by the Leiden algorithm.

A worst case example of an arbitrarily badly connected community is a internally disconnected community. An internally disconnected community arises through the Louvain algorithm when a node that had been acting as a "bridge" between two groups of nodes in its community is moved to a new community, leaving the old one disconnected. The remaining nodes in the old community may also be relocated, but if their connection to the community is strong enough despite the removal of the "bridge" node, they will instead remain in place. For an example of this, see the image to the right; note how the removal of the bridge node, node 0, caused the red community to be split into two disjoint subgroups. While this is the worst-case scenario, there are other, more subtle problems with the Louvain algorithm that can also lead to arbitrarily badly connected communities, such as the formation of communities using nodes that are only weakly connected.

Another common issue with the Louvain algorithm is the resolution limit of modularity - that is, multiple small communities being grouped together into a larger community. This causes the smaller communities to be hidden; for an example of this, see the visual depiction of the resolution limit to the right. Note how, when the green community is absorbed into the blue community to increase the graph's modularity, the smaller group of nodes that it represented is lost. There is no longer a way to differentiate those nodes from the nodes that were already in the blue community. Conversely, the nodes that were already in the blue community no longer appear distinct from those that were in the green community; in other words, whatever difference caused them to initially be placed in separate communities has been obscured.
Both the resolution limit of modularity and the arbitrarily badly connected community problem are further exasperated by each iteration of the algorithm. Ultimately, the only thing the Louvain algorithm guarantees is that the resulting communities cannot be merged further; in other words, they're well-separated. To avoid the problems that arise from arbitrarily badly connected communities and the resolution limit of modularity, it is recommended to use the Leiden algorithm instead, as its refinement phase and other various adjustments have corrected these issues.[5]
Comparison to other methods of non-overlapping community detection
[edit]When comparing modularity optimization methods, the two measures of importance are the speed and the resulting modularity value. A higher speed is better as it shows a method is more efficient than others and a higher modularity value is desirable as it points to having better-defined communities. The compared methods are, the algorithm of Clauset, Newman, and Moore,[2] Pons and Latapy,[11] and Wakita and Tsurumi.[12]
| Karate | Arxiv | Internet | Web nd.edu | Phone | Web uk-2005 | Web WebBase 2001 | |
|---|---|---|---|---|---|---|---|
| Nodes/links | 34/77 | 9k/24k | 70k/351k | 325k/1M | 2.6M/6.3M | 39M/783M | 118M/1B |
| Clauset, Newman, and Moore | .38/0s | .772/3.6s | .692/799s | .927/5034s | -/- | -/- | -/- |
| Pons and Latapy | .42/0s | .757/3.3s | .729/575s | .895/6666s | -/- | -/- | -/- |
| Wakita and Tsurumi | .42/0s | .761/0.7s | .667/62s | .898/248s | .56/464s | -/- | -/- |
| Louvain Method | .42/0s | .813/0s | .781/1s | .935/3s | .769/134s | .979/738s | .984/152mn |
-/- in the table refers to a method that took over 24hrs to run. This table (from[1][14]) shows that the Louvain method outperforms many similar modularity optimization methods in both the modularity and the time categories.
See also
[edit]References
[edit]- ^ a b c d e Blondel, Vincent D; Guillaume, Jean-Loup; Lambiotte, Renaud; Lefebvre, Etienne (9 October 2008). "Fast unfolding of communities in large networks". Journal of Statistical Mechanics: Theory and Experiment. 2008 (10) 10008. arXiv:0803.0476. Bibcode:2008JSMTE..10..008B. doi:10.1088/1742-5468/2008/10/P10008. S2CID 334423.
- ^ a b Clauset, Aaron; Newman, M. E. J.; Moore, Cristopher (2004-12-06). "Finding community structure in very large networks". Physical Review E. 70 (6) 066111. arXiv:cond-mat/0408187. Bibcode:2004PhRvE..70f6111C. doi:10.1103/PhysRevE.70.066111. ISSN 1539-3755. PMID 15697438. S2CID 8977721.
- ^ Cohen-Addad, Vincent; Kosowski, Adrian; Mallmann-Trenn, Frederik; Saulpic, David (2020). "On the Power of Louvain in the Stochastic Block Model". Advances in Neural Information Processing Systems (Neurips 2020). Curran Associates, Inc. pp. 4055–4066.
- ^ Ghosh, Sayan; Halappanavar, Mahantesh; Tumeo, Antonino; Kalyanaraman, Ananth; Lu, Hao; Chavarría-Miranda, Daniel G.; Khan, Arif; Gebremedhin, Assefaw Hadish (2018). "Distributed Louvain Algorithm for Graph Community Detection" (PDF). 2018 IEEE International Parallel and Distributed Processing Symposium, IPDPS 2018, Vancouver, BC, Canada, May 21–25, 2018. IEEE Computer Society. pp. 885–895. doi:10.1109/IPDPS.2018.00098. ISBN 978-1-5386-4368-6.
- ^ a b c d Traag, V. A.; Waltman, L.; van Eck, N. J. (2019-03-26). "From Louvain to Leiden: guaranteeing well-connected communities". Scientific Reports. 9 (1): 5233. arXiv:1810.08473. Bibcode:2019NatSR...9.5233T. doi:10.1038/s41598-019-41695-z. ISSN 2045-2322. PMC 6435756. PMID 30914743.
- ^ "Louvain method for community detection". perso.uclouvain.be. Retrieved 2024-11-21.
- ^ "Louvain - Analytics & Algorithms - Ultipa Graph". www.ultipa.com. Retrieved 2024-11-21.
- ^ Pujol, Josep M.; Erramilli, Vijay; Rodriguez, Pablo (2009). "Divide and Conquer: Partitioning Online Social Networks". arXiv:0905.4918v1 [cs.NI].
- ^ Greene, Derek; Doyle, Dónal; Cunningham, Pádraig (May 2011). Tracking the Evolution of Communities in Dynamic Social Networks (PDF) (Technical report). University College Dublin. UCD-CSI-2011-06. Archived from the original (PDF) on 2013-05-12. Retrieved 2014-11-20.
- ^ Markovitch, Omer; Krasnogor, Natalio (2018). "Predicting species emergence in simulated complex pre-biotic networks". PLOS ONE. 13 (2) e0192871. Bibcode:2018PLoSO..1392871M. doi:10.1371/journal.pone.0192871. PMC 5813963. PMID 29447212.
- ^ Pons, Pascal; Latapy, Matthieu (2006). "Computing Communities in Large Networks Using Random Walks" (PDF). Journal of Graph Algorithms and Applications. 10 (2): 191–218. arXiv:cond-mat/0412368. doi:10.7155/jgaa.00124. S2CID 121714719.
- ^ Wakita, Ken; Tsurumi, Toshiyuki (2007). "Finding Community Structure in Mega-scale Social Networks". arXiv:cs/0702048.
- ^ Blondel, Vincent D.; Guillaume, Jean-Loup; Lambiotte, Renaud; Lefebvre, Etienne (2008). "Fast unfolding of communities in large networks". Journal of Statistical Mechanics: Theory and Experiment. 2008 (10) 10008. arXiv:0803.0476. Bibcode:2008JSMTE..10..008B. doi:10.1088/1742-5468/2008/10/P10008. S2CID 334423.
- ^ Aynaud, Thomas; Blondel, Vincent D.; Guillaume, Jean-Loup; Lambiotte, Renaud (2013). "Multilevel Local Optimization of Modularity". In Bichot, Charles-Edmond; Siarry, Patrick (eds.). Graph Partitioning (1 ed.). Wiley (published 13 February 2013). pp. 315–345. doi:10.1002/9781118601181.ch13. ISBN 978-1-84821-233-6.
- "The Louvain method for community detection in large networks" Vincent Blondel http://perso.uclouvain.be/vincent.blondel/research/louvain.html
Louvain method
View on GrokipediaIntroduction
Overview
The Louvain method is a heuristic algorithm designed for detecting communities in large networks by partitioning nodes into densely connected groups while minimizing inter-group connections. It operates on undirected graphs, where communities represent subsets of nodes with a higher density of internal edges compared to the overall network. Developed to handle networks with millions of nodes and edges, the method efficiently identifies such structures without requiring exhaustive computational searches.[3] As a heuristic approach, the Louvain method approximates the solution to the NP-hard problem of modularity optimization, which serves as its primary objective function to quantify the quality of detected communities. Modularity measures the strength of division by comparing the observed intra-community edges to those expected under a random null model. By iteratively improving this measure, the algorithm achieves high-quality partitions in practical timeframes, outperforming exact methods on scalability.[3] A distinguishing feature of the Louvain method is its two-phase iterative structure, which produces a hierarchical decomposition of the network, yielding a dendrogram that reveals communities at multiple resolution levels. This allows users to analyze structures from fine-grained local clusters to coarse global partitions, making it versatile for applications in social networks, biology, and web graphs.[3]History
The Louvain method was first proposed in 2008 by Vincent D. Blondel, Jean-Loup Guillaume, Renaud Lambiotte, and Etienne Lefebvre, affiliated with the Université catholique de Louvain and other institutions in Belgium, France, and the UK.[1] Their seminal paper, titled "Fast unfolding of communities in large networks," was published in the Journal of Statistical Mechanics: Theory and Experiment.[3] The name "Louvain method" derives from the university's location in the planned town of Louvain-la-Neuve, near Brussels.[2] The authors developed the algorithm to tackle the computational challenges of detecting communities in massive networks, where exact optimization of modularity—a key metric for assessing partition quality—is intractable for graphs with millions or billions of nodes and edges.[1] This motivation stemmed from the need to reveal hierarchical structures and functional modules in real-world systems, such as social interactions or biological interactions, without sacrificing efficiency.[1] In its original presentation, the method was demonstrated on diverse large-scale datasets, including a web graph comprising 118 million nodes and over one billion links, as well as a scientific collaboration network derived from citation data in the KDD Cup dataset.[1] These applications highlighted its ability to process enormous graphs in seconds to hours on commodity server hardware, outperforming prior heuristics in speed while achieving comparable or superior modularity scores.[1] Following publication, the Louvain method experienced swift uptake in the research community, with implementations appearing in prominent open-source graph libraries shortly thereafter; for instance, the python-louvain package, compatible with NetworkX, was released in 2011, and igraph incorporated a version of the algorithm (ascommunity_multilevel) by version 0.6 in 2012.[4] This early integration facilitated its application in fields like network science and data mining, marking the beginning of its widespread use for analyzing complex systems.[2]
Theoretical Foundations
Community Detection Basics
Community detection in networks involves identifying groups of nodes, known as communities, that exhibit denser internal connections compared to their links with the rest of the network. These communities represent subsets of vertices where interactions are more frequent within the group than across groups, allowing for a coarse-grained understanding of the network's structure.[5] The problem is primarily studied in undirected graphs, which may be unweighted or weighted to reflect the strength of connections between nodes. While extensions exist for directed networks—where edges have orientation—and dynamic networks that evolve over time, the foundational approaches assume static, undirected structures to simplify analysis and computation. Detecting optimal communities is computationally challenging, as the problem of exact graph partitioning is NP-hard, akin to well-known hard problems like finding the maximum clique. For large-scale networks with millions of nodes and edges, exhaustive search becomes infeasible, necessitating heuristic algorithms that provide approximate solutions efficiently.[6] To evaluate the quality of detected communities, researchers rely on quality functions that quantify how well a partition captures the network's modular structure. Modularity, for instance, assesses partitions by comparing the density of intra-community edges to what would be expected in a random network with the same degree distribution, enabling objective comparisons across methods. The Louvain method exemplifies such a heuristic tailored for scalable community detection.[5]Modularity Optimization
Modularity serves as the primary quality function in the Louvain method, providing a scalar measure of the strength of a network's division into communities by quantifying the density of links within communities relative to the density expected in a random network with the same degree sequence.[1] Introduced by Newman and Girvan, it evaluates how well a partition separates the network into densely connected subgroups compared to a null model.[5] The modularity is formally defined as where the summation is over all communities , is the total weight of all edges in the network, is the sum of the weights of edges within community , and is the sum of the weights of all edges incident to nodes in .[1] This formulation compares observed intra-community edge weights to those anticipated under a configuration model, penalizing partitions that do not exceed random expectations.[5] Modularity values range from -1 to 1, where a value of 0 indicates a random partitioning with no discernible community structure, negative values suggest anti-communities (stronger inter-community links than expected), and positive values signify partitions stronger than random, with higher values reflecting more robust community divisions.[1] In practice, well-structured networks often yield values between 0.3 and 0.7, establishing a benchmark for effective community detection.[5] The core objective of the Louvain method is to maximize through a greedy heuristic that iteratively refines community assignments, moving each node to the adjacent community yielding the greatest positive gain in modularity, thereby enhancing the overall partition quality without exhaustive search.[1] This optimization prioritizes local improvements that accumulate to global enhancements in community structure.[1]Algorithm Mechanics
Phase 1: Local Optimization
The first phase of the Louvain method initiates community detection by assigning each node in the network to its own singleton community, resulting in an initial partition where no edges exist within communities.[1] This setup provides a baseline modularity of zero, as there are no intra-community connections.[1] The process then proceeds iteratively: nodes are visited in a random order to mitigate the risk of converging to suboptimal local maxima.[3] For each node , the algorithm evaluates the potential gain in modularity if were to move from its current community to the community of one of its neighbors.[1] The modularity gain is computed using the formula: where is the sum of the weights of the links inside 's current community, is the sum of the weights of the links from to that community, is the sum of the weights of all links incident to the community, is the total degree of node , and is half the total sum of all link weights in the network.[1] This formula captures the change in modularity attributable solely to the reassignment of node , isolating the effect of intra-community and degree contributions.[1] In a greedy manner, node is reassigned to the neighboring community that yields the highest positive ; if no such positive gain exists, remains in its current community.[1] The iteration over all nodes repeats sequentially until no further reassignments produce a positive for any node, indicating a local maximum in modularity has been achieved.[1] Upon completion of this phase, the output is a partition of the network into communities that locally optimize modularity, serving as the foundation for subsequent hierarchical refinement.[1] This node-level optimization is computationally efficient, with each pass over the nodes requiring time proportional to the sum of the degrees of nodes in small communities.[3]Phase 2: Hierarchical Aggregation
In the second phase of the Louvain method, the communities identified during the local optimization phase are aggregated to form a condensed representation of the network, creating a hierarchical structure. Each community is treated as a supernode in a new graph, reducing the number of nodes from the original network size to the number of communities found previously. This aggregation preserves the overall modularity structure by ensuring that the partition's quality metric remains equivalent in the coarser graph. The process enables the algorithm to explore multi-resolution views of the network, where higher levels in the hierarchy reveal larger-scale communities.[7] The aggregation constructs edges between supernodes based on the connections in the original graph. Specifically, the weight of the edge between supernodes and (where ) is the sum of the weights of all links connecting nodes in community to nodes in community , formally . For intra-community connections, links between nodes within the same community form self-loops on the corresponding supernode, with the self-loop weight equal to the sum of all internal link weights, . This weighting scheme maintains the total sum of all link weights in the new graph (sum of all entries in the adjacency matrix) at , where is half the total sum of link weights in the original undirected network, as the sums of inter-supernode edges and self-loops account for all original connections without loss.[7] By condensing the graph in this manner, the second phase prepares the network for subsequent iterations of the algorithm, allowing the local optimization phase to be reapplied on the smaller supernode graph. This hierarchical aggregation iteratively coarsens the network, producing a dendrogram-like structure that captures communities at multiple scales, from fine-grained local clusters to broad global partitions. The approach ensures computational efficiency for large networks while optimizing modularity across resolutions.[7]Iterative Process and Convergence
The Louvain method operates through an iterative loop that alternates between the local optimization phase and the hierarchical aggregation phase until no further improvement in modularity can be achieved across a complete iteration. Specifically, the algorithm performs repeated passes, where each pass consists of executing Phase 1 to refine communities within the current network representation, followed by Phase 2 to aggregate those communities into supernodes for the next level. This alternation continues as long as the modularity gain from a full pass exceeds zero; once , the process halts, yielding the final partition.[3] The iterative nature of the algorithm naturally produces a hierarchical structure, represented as a dendrogram, where each iteration level corresponds to progressively coarser communities. At the base level, fine-grained communities are identified; subsequent aggregations merge these into larger supernodes, forming higher levels of the hierarchy that capture multi-scale community organization in the network. This dendrogram allows users to select partitions at any desired resolution by truncating the hierarchy at a specific level.[3] Convergence is guaranteed because each full pass monotonically increases the modularity score, as both phases are designed to only accept changes that improve . Given the discrete nature of node assignments and the bounded range of modularity (between -1 and 1), the algorithm terminates in a finite number of steps, reaching a local maximum of modularity. While the solution may not be globally optimal due to the greedy approach, the monotonic progression ensures reliable termination without cycles.[3] In practice, the number of iterations required is typically small, often 2 to 3 passes for large networks. The overall process can be outlined in pseudocode as follows:function Louvain(Graph G):
current_G = G
dendrogram = []
while true:
partition = LocalOptimization(current_G) // Phase 1
delta_Q = compute_modularity_gain(partition)
if delta_Q <= 0:
break
aggregated_G = AggregateCommunities(current_G, partition) // Phase 2
[dendrogram](/page/Dendrogram).append(partition)
current_G = aggregated_G
return [dendrogram](/page/Dendrogram)
function Louvain(Graph G):
    current_G = G
    dendrogram = []
    while true:
        partition = LocalOptimization(current_G)  // Phase 1
        delta_Q = compute_modularity_gain(partition)
        if delta_Q <= 0:
            break
        aggregated_G = AggregateCommunities(current_G, partition)  // Phase 2
        [dendrogram](/page/Dendrogram).append(partition)
        current_G = aggregated_G
    return [dendrogram](/page/Dendrogram)
Performance Analysis
Time Complexity
The Louvain algorithm demonstrates a practical time complexity of for sparse graphs, where denotes the number of nodes, with the majority of computational effort concentrated in the initial stages; the exact theoretical complexity is not fully proven, but worst-case scenarios approach in dense graphs, though this is seldom observed in real-world applications.[2][7] Phase 1, focused on local optimization, requires time per pass, where is the number of edges, as the process greedily evaluates modularity gains by iterating over each node and its neighbors—typically per node, with as the average degree yielding overall.[8] The greedy nature limits passes to approximately , driven by rapid community formation and hierarchical collapse.[8][2] Phase 2, involving hierarchical aggregation, incurs time to build the coarsened graph by summing intra- and inter-community edge weights, with the edge processing dominating for sparse structures.[8] Runtime is influenced by graph density, as higher amplifies per-pass costs, and initial node ordering, which can alter iteration counts in Phase 1; empirical tests show execution on graphs with up to 118 million nodes completing in 152 minutes on 2008-era hardware, while typical million-node networks process in seconds to minutes on modern systems.[7][2]Space Complexity and Scalability
The Louvain method employs an adjacency list representation for the graph, resulting in a space complexity of O(n + m), where n is the number of nodes and m is the number of edges.[7][9] This efficient storage allows the algorithm to handle sparse networks without excessive memory demands, as the representation only allocates space proportional to the actual connections. During the local moving phase, temporary arrays for computing modularity gain (ΔQ) values require additional O(n) space, which is released after each iteration.[9] In the hierarchical aggregation phase, the algorithm reuses memory by constructing a new coarsened graph in place of the previous one, maintaining the overall O(n + m) footprint per level without accumulating storage across iterations. However, if the full hierarchical dendrogram is desired for post-analysis, storing all levels explicitly can increase memory usage to O(n log n) in the worst case, due to the cumulative representation of nodes and edges across the hierarchy.[7][10] The method's scalability stems from its in-memory processing capability, enabling analysis of graphs with billions of edges on standard hardware; for instance, a network with 118 million nodes and 1 billion edges was processed using 24 GB of RAM.[7] Phase 1's local optimization is inherently parallelizable, as node moves can be computed independently across threads or processes, facilitating multicore or distributed execution to manage even larger scales.[11][12] For dense graphs where m approaches O(n²), the space complexity effectively becomes O(n²), posing challenges for very large n on single machines. To address this, distributed implementations, such as those in Apache Spark's GraphX framework, partition the graph across clusters, allowing scalability to graphs with tens of billions of edges while mitigating memory bottlenecks.[13][10]Applications and Uses
Real-World Implementations
The Louvain method has been implemented in several key software libraries, enabling practical community detection in various programming environments. One prominent Python library is python-louvain, first released in 2009, which provides a straightforward implementation of the algorithm for modularity optimization.[14] This library, imported ascommunity, integrates seamlessly with NetworkX graphs and supports core features of the original method.[4] NetworkX itself incorporates Louvain functionality through its louvain_communities and louvain_partitions functions, relying on python-louvain as a backend for computation.[15]
Another foundational implementation is in igraph, a C-based library from the 2000s with bindings for multiple languages including Python, R, and C++, allowing broad accessibility across ecosystems. igraph's community_multilevel function executes the Louvain algorithm, handling hierarchical partitioning efficiently.
For large-scale and high-performance scenarios, parallel and distributed versions extend the method's applicability. A popular distributed implementation for Apache Spark's GraphX framework, developed in the 2010s, parallelizes the Louvain process across clusters to process massive graphs.[13] In the 2020s, NVIDIA's RAPIDS cuGraph offers GPU-accelerated Louvain via its cugraph.louvain function, leveraging CUDA for speedups on NVIDIA hardware and supporting distributed multi-GPU setups through Dask integration.
These libraries commonly accept input in formats such as adjacency matrices or edge lists, with igraph and cuGraph providing constructors for both dense matrices and sparse coordinate formats (COO). Support for weighted graphs is standard across implementations, where edge weights influence modularity calculations; directed graphs are handled through adaptations like symmetrization in igraph and cuGraph, though the core method assumes undirected structures.[14][16]
Usage typically involves APIs for programmatic integration, such as best_partition(G) in python-louvain for single-graph analysis or Spark's RDD-based pipelines in the GraphX implementation for distributed execution.[17][13] Command-line tools are available in python-louvain for binary graph files, facilitating batch processing of datasets via scripts that load and analyze multiple networks sequentially.[14] cuGraph and igraph emphasize Python APIs for batch workflows, often combined with tools like Pandas or Dask for handling large inputs in memory-constrained environments.