
Community hub
Recent from talks
Contribute something
Nothing was collected or created yet.
Nephelometer
View on Wikipedia
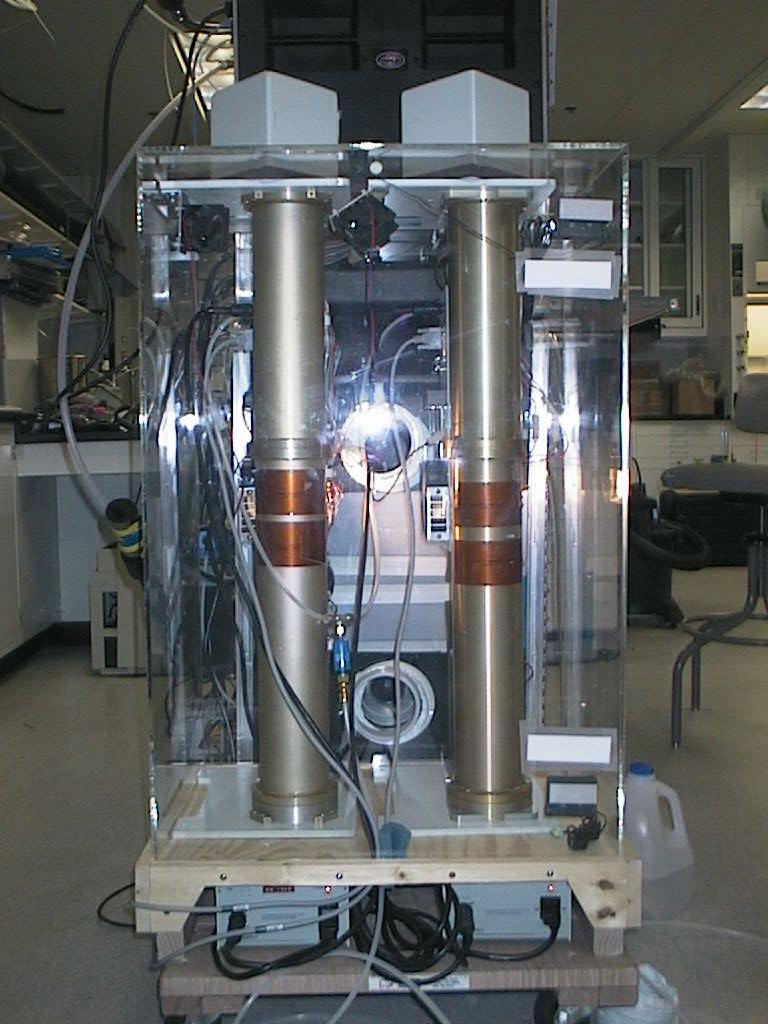
A nephelometer[1] or aerosol photometer[2] is an instrument for measuring the concentration of suspended particulates in a liquid or gas colloid. A nephelometer measures suspended particulates by employing a light beam (source beam) and a light detector set to one side (often 90°) of the source beam. Particle density is then a function of the light reflected into the detector from the particles. To some extent, how much light reflects for a given density of particles is dependent upon properties of the particles such as their shape, color, and reflectivity. Nephelometers are calibrated to a known particulate, then use environmental factors (k-factors) to compensate lighter or darker colored dusts accordingly. K-factor is determined by the user by running the nephelometer next to an air sampling pump and comparing results.[clarification needed] There are a wide variety of research-grade nephelometers on the market as well as open source varieties.[3]
Nephelometer uses
[edit]This section needs additional citations for verification. (January 2022) |
| External videos | |
|---|---|
 | |

The main uses of nephelometers relate to air quality measurement for pollution monitoring, climate monitoring, and visibility. Airborne particles are commonly either biological contaminants, particulate contaminants, gaseous contaminants, or dust.[citation needed]
The accompanying chart shows the types and sizes of various particulate contaminants. This information helps understand the character of particulate pollution inside a building or in the ambient air, as well as the cleanliness level in a controlled environment.[citation needed]
Biological contaminants include mold, fungus, bacteria, viruses, animal dander, dust mites, pollen, human skin cells, cockroach parts, or anything alive or living at one time. They are the biggest enemy of indoor air quality specialists because they are contaminants that cause health problems. Levels of biological contamination depend on humidity and temperature that supports the livelihood of micro-organisms. The presence of pets, plants, rodents, and insects will raise the level of biological contamination.[4]
Sheath air
[edit]Sheath air is clean filtered air that surrounds the aerosol stream to prevent particulates from circulating or depositing within the optic chamber. Sheath air prevents contamination caused by build-up and deposits, improves response time by containing the sample, and improves maintenance by keeping the optic chamber clean. The nephelometer creates the sheath air by passing air through a zero filter before beginning the sample.[citation needed]
Global radiation balance
[edit]
Nephelometers are also used in global warming studies, specifically measuring the global radiation balance. Three wavelength nephelometers fitted with a backscatter shutter can determine the amount of solar radiation that is reflected back into space by dust and particulate matter. This reflected light influences the amount of radiation reaching the earth's lower atmosphere and warming the planet.[citation needed]
Visibility
[edit]Nephelometers are also used for measurement of visibility with simple one-wavelength nephelometers used throughout the world by many EPAs. Nephelometers, through the measurement of light scattering, can determine visibility in distance through the application of a conversion factor called Koschmieder's formula.[citation needed]
Medicine
[edit]In medicine, nephelometry is used to measure immune function. It is also used in clinical microbiology, for preparation of a standardized inoculum (McFarland suspension) for antimicrobial susceptibility testing.[5][6]
Fire detection
[edit]Gas-phase nephelometers are also used in the detection of smoke and other particles of combustion. In such use, the apparatus is referred to as an aspirated smoke detector. These have the capability to detect extremely low particle concentrations (to 0.005%) and are therefore highly suitable to protecting sensitive or valuable electronic equipment, such as mainframe computers and telephone switches.[citation needed]
Turbidity units
[edit]

- Because optical properties depend on suspended particle size, a stable synthetic material called "Formazin" with uniform particle size is often used as a standard for calibration and reproducibility.[7] The unit is called Formazin Turbidity Unit (FTU).
- Nephelometric Turbidity Units (NTU) specified by United States Environmental Protection Agency is a special case of FTU, where a white light source and certain geometrical properties of the measurement apparatus are specified. (Sometimes the alternate form "nephelos turbidity units" is used[8][9])
- Formazin Nephelometric Units (FNU), prescribed for 9 measurements of turbidity in water treatment by ISO 7027, another special case of FTU with near infrared light (NIR) and 90° scatter.
- Formazin Attenuation Units (FAU) specified by ISO 7027 for water treatment standards for turbidity measurements at 0°, also a special case of FTU.
- Formazin Backscatter Units (FBU), not part of a standard, is the unit of optical backscatter detectors (OBS), measured at c. 180°, also a special case of FTU.
- European Brewery Convention (EBC) turbidity units
- Concentration Units (C.U.)
- Optical Density (O.D.)
- Jackson "Candle" Turbidity Units (JTU; an early measure)
- Helms Units
- American Society of Brewing Chemists (ASBC-FTU) turbidity units
- Brantner Haze Scale (BHS) and Brantner Haze Units (BHU) for purposefully hazy beer
- Parts Per Million of standard substance, such as PPM/DE (Kieselguhr)
- "Trübungseinheit/Formazin" (TE/F) a German standard, now replaced by the FNU unit.
- diatomaceous earth ("ppm SiO2") an older standard, now obsolete
A more popular term for this instrument in water quality testing is a turbidimeter. However, there can be differences between models of turbidimeters, depending upon the arrangement (geometry) of the source beam and the detector. A nephelometric turbidimeter always monitors light reflected off the particles and not attenuation due to cloudiness. In the United States environmental monitoring the turbidity standard unit is called Nephelometric Turbidity Units (NTU), while the international standard unit is called Formazin Nephelometric Unit (FNU). The most generally applicable unit is Formazin Turbidity Unit (FTU), although different measurement methods can give quite different values as reported in FTU (see below).
Gas-phase nephelometers are also used to study the atmosphere. These can provide information on visibility and atmospheric albedo.
See also
[edit]References
[edit]- ^ "Nephelometer" comes from the Greek word for "cloud", nephos, cf. "nepheloid layer".
- ^ Baron, Paul A. (1998-01-15). "Aerosol photometers for respirable dust measurements" (PDF). NIOSH Manual of Analytical Methods. Retrieved 2021-04-06.
- ^ Bas Wijnen, G. C. Anzalone and Joshua M. Pearce, Open-source mobile water quality testing platform. Journal of Water, Sanitation and Hygiene for Development, 4(3) pp. 532–537 (2014). doi:10.2166/washdev.2014.137 open access
- ^ US EPA, OAR (2014-08-14). "Biological Pollutants' Impact on Indoor Air Quality". United States Environmental Protection Agency. Retrieved 2025-04-24.
- ^ "Sensititre™ Nephelometer".
- ^ Guinet, Roland M. F.; Mazoyer, Marie-Andrée (1983). "Laser nephelometric semi-automated system for rapid bacterial susceptibility testing". Journal of Antimicrobial Chemotherapy. 12 (3): 257–263. doi:10.1093/jac/12.3.257. ISSN 0305-7453. PMID 6630109.
- ^ Formazin was first used for standardizing turbidity measurements in 1926.
- ^ Reducing turbidity in chromic acid solutions, Zeller, III, Robert L.; Morgan, Russell J.; Rabbe, Gilbert D.; Fiscus, Donna R.; Wilkes, Jr., Richard L.; United States Patent 5034211, Filing date 1990-10-29, Publication date 1991-07-23
- ^ Florida Department of Agriculture and Consumer Services 2006 Codebook Chapter 5L-1: The Comprehensive Shellfish Control code
Nephelometer
View on GrokipediaA nephelometer is an optical instrument designed to measure the concentration and size distribution of suspended particulate matter in gases or liquids by quantifying the intensity of light scattered by those particles.[1][2]
It employs a light source, such as a laser or LED, to illuminate the sample, with detectors positioned to capture scattered light at angles typically near 90 degrees or integrated over a hemispherical field to determine scattering coefficients.[3][4]
In atmospheric science, nephelometers provide critical data on aerosol optical properties, informing assessments of visibility reduction, radiative forcing in climate models, and pollutant dispersion.[5][6]
The technique, rooted in nephelometry, distinguishes itself from turbidimetry by focusing on scattered rather than transmitted light, enabling sensitive detection of low particle concentrations without significant attenuation of the primary beam.[7][8]
Principle of Operation
Light Scattering Fundamentals
Light scattering arises from the interaction of electromagnetic waves with particles suspended in a medium, where photons are deflected without energy loss in elastic scattering processes dominant for non-absorbing materials. This deflection, governed by Maxwell's equations, depends critically on particle size relative to the incident wavelength λ, refractive index contrast, and particle shape, enabling inference of concentration from scattered light intensity rather than direct absorption. In nephelometry, scattered light quantifies particulate matter, with turbidity τ defined as the negative logarithm of transmittance, causally linked to scattering cross-sections that scale with particle number density.[9] The Rayleigh regime applies when particle diameter d satisfies d ≪ λ (typically d < λ/10), treating particles as point dipoles that oscillate under the electric field, inducing reradiated waves. Scattered intensity follows I_s ∝ (1 + cos²θ)/ (1 + cos²θ) for polarization-averaged cases, with strong wavelength dependence I_s ∝ 1/λ⁴ due to the dipole moment's volume scaling (d³) and field gradient effects, favoring blue light scattering as empirically observed in clear atmospheres. The scattering cross-section σ_s = (8π/3) k⁴ |α|², where k = 2π/λ and α is polarizability (α ∝ d³ (m²-1)/(m²+2) for spheres with index m), directly ties attenuation to concentration N via τ ≈ N σ_s L for path length L, assuming dilute conditions.[10] For d ≈ λ to several λ, as in many aerosols, Mie theory provides the exact solution for spherical particles, expanding scattered fields in vector spherical harmonics with coefficients from boundary conditions on electromagnetic fields. Unlike Rayleigh's near-isotropic pattern, Mie scattering exhibits angular asymmetry, peaking forward for large size parameters x = 2π r /λ (r radius), with efficiency Q_s = σ_s / (π r²) oscillating between 1 and 2+ before geometric optics limits. Wavelength dependence weakens (approaching λ⁰ for x ≫ 1), and turbidity integrates over size distributions, complicating concentration proxies without spectral or angular resolution.[11][10] Turbidity causally reflects deflection-induced beam attenuation, distinct from absorption where energy is dissipated as heat; for non-absorbing particles (imaginary m ≈ 0), nearly all "lost" transmission light appears scattered, validated empirically via the Tyndall effect—visible beam paths in colloids with particles 1–1000 nm, where Rayleigh-Mie transitions manifest as intensified scattering cones. This effect, first systematically observed in dilute suspensions, confirms scattering's dominance over other attenuation mechanisms in low-absorbance media.[12][9]Instrument Components and Detection
A nephelometer typically comprises a monochromatic light source, such as a laser diode or light-emitting diode (LED), which illuminates the sample within an enclosed chamber.[6] The sample chamber contains the aerosol or particulate suspension, designed to minimize wall losses and ensure uniform particle sampling.[3] Scattered light is captured by photodetectors positioned at specific angles relative to the incident beam, often employing photomultiplier tubes (PMTs) for high sensitivity in photon counting mode.[13] Detection relies on measuring the intensity of scattered photons, with signals processed through analog-to-digital conversion to yield scattering coefficients.[14] Background subtraction is achieved via periodic dark measurements, where the light beam is blocked, isolating instrumental noise from particle-scattered light; this enhances signal-to-noise ratios, particularly in low-concentration environments.[15] Empirical data from field deployments indicate that effective background correction can reduce noise floors to below 1 Mm⁻¹ for scattering coefficients.[16] Classical single-angle designs position detectors at 90° to the beam, maximizing sensitivity to mid-sized particles around 1 μm diameter.[17] In contrast, integrating nephelometers use wide-angle collection optics for total scatter (typically 7°–170°) or backscatter (90°–170°) geometries.[16] Forward-dominated detection emphasizes larger particles due to their preferential forward scattering, while backscatter modes increase relative sensitivity to finer aerosols under 0.5 μm, as smaller particles exhibit more isotropic scattering patterns.[5] These geometric differences causally influence measurement bias toward specific particle size distributions, with backscatter fractions typically lower for coarse-mode dominated samples.[18]Theoretical Models
The theoretical foundation of nephelometry rests on electromagnetic scattering models that link measured scattered light intensity to aerosol properties such as particle size, shape, refractive index, and concentration, assuming dilute suspensions where single scattering predominates.[19] Lorenz-Mie theory, an exact solution to Maxwell's equations for homogeneous spherical particles, provides the scattering efficiency , where is the size parameter (with as particle radius and as wavelength), and , are complex Mie coefficients determined by spherical Bessel functions and boundary conditions involving the relative refractive index .[20] This yields the scattering cross-section , enabling prediction of total scattered power proportional to aerosol volume concentration for (Rayleigh regime, ) or oscillatory behavior for (Mie resonance).[20] [19] Extensions to irregular, non-spherical aerosols—prevalent in atmospheric applications—employ approximations like equivalent-volume spheres or numerical methods such as the T-matrix approach, which solve for orientation-averaged scattering matrices while relaxing sphericity assumptions; these maintain causal links between microstructure and bulk optical properties but introduce uncertainties up to 20% in for aspherical particles with aspect ratios >2.[5] Empirical corrections refine interpretations under non-ideal conditions, such as multiple scattering at optical depths , where forward-scattered light from one particle illuminates others, inflating apparent transmission and underestimating by factors derived from radiative transfer simulations (e.g., doubling-adding methods).[19] Variations in refractive index, often for ambient aerosols, modulate peaks, with real-part increases enhancing scattering for via stronger impedance mismatches at particle boundaries.[20] Nephelometry's emphasis on integrated scattered intensity distinguishes it from turbidimetry, which quantifies attenuation via transmitted light for small , yielding poor signal-to-noise for low-turbidity samples (e.g., <1 NTU) where fractional changes in transmission fall below detector limits (~0.1%).[21] In contrast, nephelometric signal scales linearly with through scattered flux ( as number density), achieving sensitivities down to 0.001 NTU by avoiding the near-unity baseline of transmission measurements, though both derive from Mie-predicted phase functions.[21] [22]Historical Development
Origins in Early 20th Century
The nephelometer originated as an analytical instrument for measuring turbidity in chemical solutions through light scattering, with foundational work by American chemist Theodore W. Richards at Harvard University. In 1894, Richards devised the first nephelometer to detect minute traces of suspended precipitates by observing the intensity of scattered light, addressing limitations in gravimetric methods for precise quantification in atomic weight determinations.[23] This innovation stemmed from empirical needs in analytical chemistry to assess low concentrations of solutes forming colloidal suspensions, such as silver halides or other precipitates, where direct weighing proved insufficient due to occlusion errors and moisture interference.[24] Richards' design compared light scattered by an unknown sample against standards, establishing scattered light intensity as a proportional proxy for particle density and thus turbidity. Collaborating with F. R. Wells, he applied it to refine measurements like chloride content via nephelometric endpoint detection in silver nitrate titrations, enhancing accuracy in trace analysis.[25] The instrument's principle relied on the elastic scattering of incident light by suspended particles, calibrated visually against known turbidities, which proved vital for early 20th-century laboratory work in solution chemistry before photoelectric advancements.[26] By 1915, Philip A. Kober and Sara S. Graves advanced nephelometry through a comprehensive review and instrument refinement, designing a hybrid colorimeter-nephelometer akin to the Duboscq model for broader photometric analysis. Their work synthesized prior developments, including Richards', and emphasized applications in quantifying proteins and other macromolecules via turbidity in immunological and biochemical assays, driven by the need for sensitive, non-destructive particle density proxies. Key experiments in their publications demonstrated reproducibility across silica suspensions and varied depths, validating scattered light as a reliable metric despite angular dependencies.[26] These efforts laid the groundwork for nephelometry's expansion in empirical chemistry, prioritizing causal links between scatter and concentration over qualitative observations.World War II Innovations
During World War II, military aviation operations faced acute challenges from reduced visibility due to natural fog, battlefield smoke screens, and aerosol obscurants, necessitating reliable instruments to quantify light scattering by suspended particles for safe flight paths and tactical assessments.[27] These demands drove the practical engineering of nephelometers beyond theoretical prototypes, emphasizing field-deployable designs capable of real-time measurement of atmospheric turbidity.[28] British meteorological efforts, in particular, prioritized visibility metering to support Allied air campaigns, where poor sighting conditions contributed to numerous accidents and impaired reconnaissance.[29] A pivotal advancement was the integrating nephelometer, invented by R. G. S. Beuttell and A. W. Brewer amid wartime urgencies for aviation and defense visibility tools. Described in their 1949 publication detailing instruments for visual range measurement, the device used a diffused light source and integrating sphere to capture total forward-scattered light from aerosols, providing a direct proxy for the extinction coefficient via Koschmieder's law. This marked a shift from earlier single-angle photometers, which underestimated scattering in heterogeneous battlefield environments like smoke from Nebelwerfer deployments or naval fog curtains.[30] Field trials during the war validated the instrument's efficacy for aerosol evaluation, with empirical data showing it could resolve scattering coefficients in fog densities equivalent to visual ranges of 100–500 meters, aiding in the calibration of smoke efficacy for concealment operations.[28] The design's robustness—employing photoelectric detection stable under vibration and varying humidity—facilitated its transition to portable units, laying groundwork for post-war standardization while addressing causal gaps in prior methods that relied on subjective human observers.[27]Post-War Evolution and Standardization
Following World War II, the integrating nephelometer, initially developed during wartime for visibility assessment, underwent refinements in detector sensitivity and optical design to enhance reliability for environmental applications. Photomultiplier tubes replaced earlier detectors, enabling detection of lower scattering coefficients down to approximately 10^{-6} m^{-1}, which addressed limitations in measuring dilute aerosols amid post-industrial urbanization and emissions growth.[27] Automation emerged in the 1960s, with continuous sampling mechanisms allowing unattended operation, as seen in prototypes integrating real-time data logging for field deployments.[31] These empirical upgrades were motivated by the need for precise particulate monitoring, correlating scattered light intensity more accurately with mass concentrations in ambient air.[32] By the 1970s, commercial instruments proliferated, with manufacturers like MRI (Meteorology Research Inc.) introducing models such as the 1550 and 1560 series, which standardized hemispheric light integration over 7° to 170° angles to minimize truncation errors from large particles.[33] University-led innovations, including multi-wavelength prototypes at the University of Washington in 1971, extended measurements across visible and near-infrared spectra for better aerosol composition inference.[34] These advancements facilitated broader adoption in aerosol research, with instruments deployed in networks tracking visibility degradation linked to sulfate and carbon particulates.[31] Institutional standardization accelerated under regulatory pressures, particularly the U.S. Clean Air Act of 1970, which mandated ambient monitoring networks and indirectly boosted nephelometer use for real-time particulate data supporting National Ambient Air Quality Standards.[35] The EPA formalized protocols in Method 180.1 (initially outlined in the 1970s), specifying nephelometer geometry—90° detection at 45° above the light path—for turbidity assessment in water quality, calibrated against formazin standards to ensure inter-instrument consistency within 5% error.[36] For air, EPA-endorsed calibrations using gases like Freon-12 enabled traceable scattering measurements, leading to widespread deployment in over 100 U.S. sites by the late 1970s for compliance and research.[37] These standards emphasized empirical validation over theoretical assumptions, improving data comparability across deployments.[27]Types and Instrument Designs
Classical and Single-Angle Nephelometers
Classical single-angle nephelometers operate by directing a collimated light beam through a sample and measuring the intensity of light scattered at a fixed angle, most commonly 90 degrees, to the incident path, providing a direct proxy for particle concentration in suspensions like turbid liquids.[38][7] This configuration, standardized in protocols such as EPA Method 180.1, excels in detecting low-level turbidity in water samples, where scattered light from particulates correlates empirically with concentrations as low as 0-40 nephelometric turbidity units (NTU), though practical sensitivity in lab settings often targets changes below 1 NTU for treated effluents.[36][39] Core components encompass a stable light source, typically a tungsten-halogen lamp for broad-spectrum illumination, a sample cuvette to minimize wall scattering, and a sensitive detector such as a photomultiplier tube positioned orthogonally to capture faint scattered photons.[7][6] This arrangement prioritizes operational simplicity and rapid readout, facilitating routine use in water quality labs, but introduces causal trade-offs: the narrow angular acceptance reduces sensitivity to forward-scattered light from larger particles (>1 μm), yielding incomplete total scattering estimates and potential underestimation of polydispersity compared to multi-angle integration.[5][40] Historically, these instruments prevailed in biomedical assays for immunonephelometric quantification of serum proteins, where antigen-antibody complexes induce measurable scatter at 90 degrees or nearby angles like 30-70 degrees, achieving detection limits around 0.01 NTU equivalents in calibrated systems for analytes at microgram-per-milliliter levels.[41][42] Such precision supported early clinical diagnostics from the mid-20th century onward, though limitations in angle-specific response necessitated empirical corrections for particle size variability, underscoring their foundational yet constrained role before integrative advancements.[43][44]Integrating Nephelometers
Integrating nephelometers employ an integrating chamber, often spherical and lined with a highly reflective diffusing material, to collect and average light scattered by aerosol particles over a broad angular range, typically 7° to 170° for total scatter measurements.[5] This configuration approximates the total atmospheric light scattering relevant to visibility reduction, distinguishing it from narrower-angle designs by providing a volume-integrated signal proportional to the scattering coefficient.[5][45] The design traces to the 1940s, when Beuttell and Brewer developed early prototypes to quantify particle-induced scattering as a direct proxy for visibility impairment, with empirical validations showing strong correlations between integrated scattering values and observed visual ranges in field tests.[45] In operation, a collimated light beam illuminates the sample volume within the chamber, where scattered photons undergo multiple reflections off the walls before detection by a photomultiplier or photodiode, yielding a signal insensitive to precise particle position.[5] This approach excels in bulk aerosol assessment, as the wide-angle integration captures contributions from diverse particle sizes and refractive indices without resolving individual scatters.[46] A primary limitation arises from angular truncation: exclusion of forward scatter below ~7° and backward scatter above ~170° introduces systematic underestimation, especially for supermicron particles where diffraction peaks dominate near the forward direction.[47] Theoretical analyses using Mie scattering and geometric optics indicate errors ranging from 0% for fine-mode aerosols (Junge exponent ~3) to 22% for coarse-mode dominated distributions (Junge exponent ~2.5), with forward truncation accounting for most bias in polydisperse urban or desert aerosols.[47][48] Corrections often involve empirical factors derived from particle size distribution assumptions or auxiliary measurements, though residual uncertainties persist for non-spherical or absorbing particles.[49] Commercial implementations include the TSI Model 3563, a three-wavelength (450, 550, 700 nm) unit with selectable averaging times up to 1 hour, characterized in laboratory intercomparisons for scattering coefficients accurate to within 5-10% against reference standards after truncation adjustments.[46][50] The Ecotech Aurora 3000 similarly integrates over comparable angles using LED sources, demonstrating comparable performance to the TSI in side-by-side deployments, with enhanced stability for long-term monitoring via automated zeroing and flow control.[33][46] Both models prioritize low noise floors (<0.2 Mm⁻¹) for ambient-level detection, supporting applications in aerosol radiative forcing studies where total scatter informs single-scattering albedo estimates.[33][50]Specialized Variants
Polar nephelometers extend standard designs by measuring the full angular distribution of scattered light, typically from 10° to 170°, to derive the aerosol phase function, which informs particle size distributions, shapes, refractive indices, and aerosol typing through distinct scattering patterns for types like dust or biomass smoke. These instruments often use elliptical mirrors, lasers, and CCD cameras or scanning detectors to capture multi-angle data, enabling Mie theory inversions for property retrieval. A 2022 empirical analysis quantified the information content of polar nephelometer measurements, showing robust retrieval of aerosol microphysical parameters from angular scattering data under varied conditions.[51] Another 2022 optical closure study evaluated angular truncation effects, confirming that corrections for illumination non-uniformity improve phase function accuracy by up to 5% for submicron particles, with empirical validations against laboratory-generated aerosols.[52] Backscatter nephelometers specialize in quantifying light scattered near 180°, providing proxies for lidar backscatter coefficients essential in remote sensing of aerosol vertical profiles. This variant modifies integrating designs with backward-facing detectors, yielding the lidar ratio (extinction-to-backscatter, typically 20-70 sr for tropospheric aerosols), which causally links in situ scattering to lidar signal inversions for extinction retrieval. Co-deployment with elastic backscatter lidars, as in 2004 field campaigns, demonstrated calibration improvements, reducing retrieval uncertainties by integrating nephelometer-derived ratios to constrain aerosol optical depth assumptions in polluted boundary layers.[53][54] Low-detection-limit nephelometers, optimized for clean air with scattering coefficients below 10^{-5} m^{-1}, incorporate high-sensitivity photodetectors and low-noise electronics to resolve faint signals in remote or polar environments, where standard models suffer signal-to-noise degradation. These differ empirically in size selectivity from conventional types due to enhanced forward-scattering truncation sensitivity, overestimating fine-mode contributions by 10-20% without size-specific angular corrections, as validated in closure experiments with monodisperse particles.[45][55]Applications
Atmospheric and Aerosol Monitoring
Nephelometers measure the aerosol light scattering coefficient, denoted as , which quantifies the suspension of particulate matter in the atmosphere and serves as an indicator for visibility reduction and radiative effects.[3] In monitoring networks like the Interagency Monitoring of Protected Visual Environments (IMPROVE), these instruments provide hourly scattering data to evaluate aerosol concentrations and visibility conditions in Class I federal areas, such as national parks.[56] [57] The scattering coefficient correlates with PM mass concentrations, allowing nephelometric data to estimate particulate levels through empirically derived relationships, though these require site-specific calibrations accounting for variations in aerosol hygroscopicity and composition.[58] [19] Aerosol-induced scattering diminishes atmospheric visibility by increasing light extinction, with empirical studies linking higher values to reduced meteorological range in urban and rural settings.[59] In radiative balance assessments, nephelometer-derived scattering contributes to calculations of aerosol direct effects, where forward scattering by submicron particles reduces incoming solar irradiance, a mechanism observed in field campaigns correlating with surface dimming.[53] Observational data from such deployments show associations between elevated scattering and health metrics like respiratory inflammation markers, but analyses highlight confounding influences including gaseous co-pollutants, particle chemistry, and exposure misclassification.[60] [61] Nephelometer reliance in aerosol models faces challenges from non-spherical particle geometries, which alter scattering phase functions beyond Mie theory assumptions for spheres, introducing systematic biases in extinction retrievals up to 2-10% depending on shape irregularity.[51] [62] Instrument truncation of forward (below ~7°) and backward (above ~170°) scattering angles further underestimates total by 10-20% for certain size distributions, necessitating corrections validated against reference methods.[63] These limitations underscore the need for complementary measurements to refine model inputs for accurate PM forecasting and climate forcing estimates.[64]Aquatic Turbidity and Water Quality
Nephelometers quantify aquatic turbidity by detecting light scattered at 90 degrees from suspended particles in water, providing an index of optical clarity that reflects concentrations of sediments, organic matter, and microorganisms.[65] In drinking water treatment, turbidity levels are regulated to ensure effective disinfection; the U.S. Environmental Protection Agency mandates that individual filters produce water with turbidity below 0.3 NTU in at least 95% of monthly measurements, with no value exceeding 1 NTU at any time.[66] The World Health Organization advises that turbidity should ideally remain under 1 NTU and not surpass 5 NTU to minimize health risks.[67] Elevated turbidity correlates empirically with pathogen presence, as particulate matter facilitates microbial aggregation and protects protozoa like Giardia and Cryptosporidium from chlorination; time-series epidemiological studies link spikes in source water turbidity to increased acute gastrointestinal illness rates in unfiltered or inadequately treated supplies.[68] [69] This proxy relationship underscores turbidity's role in surrogate monitoring for fecal contamination during treatment validation. Calibration employs formazin polymer suspensions as the international standard, with a stock solution of approximately 4000 NTU diluted daily for primary verification to achieve reproducible nephelometric turbidity units (NTU) across instruments.[36] [70] Laboratory nephelometers enable precise, controlled assessments of settled or filtered samples, while portable field units facilitate real-time in-situ profiling in rivers and lakes, though sedimentation poses unique challenges in liquids—unlike stable aerosols—necessitating protocols like minimal agitation to preserve particle flocs without inducing artificial settling or breakup.[38] [71] In industrial water treatment, nephelometers monitor filtration performance continuously, signaling particle breakthroughs to trigger timely backwashing and coagulant dosing adjustments, which enhance efficiency, cut chemical consumption by up to 20-30% in optimized plants, and avert costly downtime from filter clogging or product contamination.[72] [73] These applications highlight turbidity's utility in process control, where deviations above 0.1-0.5 NTU in effluent often indicate sedimentation basin inefficiencies or media fouling, driving proactive interventions.[39]Biomedical and Laboratory Analysis
Nephelometry enables the quantification of serum proteins in clinical settings by detecting light scattered from insoluble antigen-antibody complexes formed during immunoprecipitation reactions. This method quantifies proteins such as immunoglobulins (IgG, IgA, IgM, IgE) and complement components by measuring the intensity of scattered light at angles typically between 15° and 90° from the incident beam, providing results proportional to analyte concentration.[41] The technique's origins trace to early 20th-century photometric principles developed by Kober and Graves in 1915, initially for general turbid solutions, with adaptation to serum protein analysis emerging later through immunological applications that leveraged immune complex formation for specificity.[74] In laboratory immunology, nephelometry excels for low-concentration biomarkers where complex formation yields minimal turbidity, outperforming absorbance-based spectrophotometry (turbidimetry) due to its focus on scattered rather than transmitted light, which enhances sensitivity in scattering-dominant conditions—often detecting proteins at microgram-per-milliliter levels or below.[7] Automated laser nephelometers, such as those evaluating over 2,500 human fluid samples for IgG, demonstrate precision with coefficients of variation under 5% for concentrations above 1 g/L, supporting routine assays for conditions like multiple myeloma or immunodeficiency via monoclonal protein detection.[75] Empirical data from validated systems confirm its reliability for specific proteins, with inter-assay variability typically 3-7% across replicates.[76] High-throughput adaptations integrate microplate nephelometers for multiplexed biomarker screening, processing 96- or 384-well formats to quantify immune complexes like rheumatoid factors with concordance to traditional methods and detection limits in the nanogram range, facilitating efficient clinical workflows for inflammatory markers.[77] These systems maintain linearity over 2-3 orders of magnitude, with empirical sensitivity validated against reference standards, though they require precise reagent optimization to minimize non-specific scattering from sample matrices.[78]Industrial and Safety Uses
Nephelometers are integral to aspirating smoke detection systems, which actively sample air from protected areas via pipe networks and analyze it in a central detection chamber using light scattering principles to identify smoke particles at very low concentrations.[79] These systems, such as Very Early Smoke Detection Apparatus (VESDA), trigger alarms when scattered light exceeds predefined thresholds corresponding to obscuration levels as low as 0.001% per meter, enabling proactive fire suppression in environments like data centers, warehouses, and heritage buildings where traditional spot detectors may fail due to high ceilings or airflow.[80] This causal mechanism—particle-induced light deflection alerting to combustion byproducts before thermal or visible cues—has reduced response times by factors of 10 to 100 compared to conventional alarms in tested scenarios.[81] In industrial manufacturing, nephelometers provide real-time monitoring of airborne particulates for occupational safety, detecting dust, fumes, or aerosols that could pose inhalation risks or explosion hazards in sectors like mining, cement production, and metalworking.[82] For instance, portable or fixed units measure scattering coefficients to flag exceedances of permissible exposure limits, such as those set by OSHA at 5 mg/m³ for respirable dust, allowing immediate ventilation adjustments or worker evacuations.[39] In filter integrity testing, they predict breakthrough events by quantifying upstream particle loads, preventing contaminant release in processes like semiconductor fabrication or hydraulic fluid handling, where early detection has been shown to avert downtime costing thousands per hour.[39] Pharmaceutical and bioprocessing industries utilize nephelometers for in-line process control, measuring turbidity and aggregate formation in drug formulations to ensure sterility and efficacy during filling or lyophilization stages.[83] Devices detect subvisible particles down to 0.1 μm via 90-degree scattering, correlating readings to contamination risks and enabling rejection of batches with opacity exceeding 15 NTU, which studies link to a 20-30% reduction in microbial ingress incidents.[84] This application supports GMP compliance by providing verifiable data on solution clarity, distinct from endpoint quality checks, and has been validated in monoclonal antibody production to minimize immunogenicity from particulates.[42]Measurement Standards and Calibration
Turbidity Units and Scales
Nephelometric Turbidity Units (NTU) quantify turbidity by measuring the intensity of light scattered at a 90-degree angle from the incident beam, using a white light source as specified in U.S. Environmental Protection Agency (EPA) Method 180.1.[36] This unit emerged as a standardized replacement for earlier visual methods, providing empirical consistency through calibration against formazin polymer suspensions, where a specific concentration is defined as 40 NTU to ensure reproducibility across instruments.[85] Formazin, derived from the reaction of hydrazine sulfate and hexamethylenetetramine, serves as the primary reference standard due to its stable, uniform particle size distribution that mimics natural suspended matter.[17] Historically, Jackson Turbidity Units (JTU) represented an earlier metric based on the Jackson Candle Turbidimeter, which assessed turbidity via the depth at which a candle flame's silhouette becomes obscured in a water column, calibrated against silica suspensions.[86] Developed in the late 19th century, JTU relied on transmission principles akin to absorbance rather than scattering, limiting direct comparability to modern nephelometric scales; conversions are approximate and context-dependent, with 1 JTU often roughly equating to 1-2 NTU only under specific conditions. The shift to NTU and related units aligned with international standards, including World Health Organization guidelines favoring nephelometric methods for water quality assessment, though legacy JTU persists in some archival data.[87] Formazin Turbidity Units (FTU) denote measurements calibrated directly against formazin standards without specifying the optical geometry, often numerically equivalent to NTU (1 FTU ≈ 1 NTU) for formazin-based references but diverging in natural samples due to variable particle optics.[88] In contrast, Formazin Nephelometric Units (FNU) adhere to ISO 7027, employing an 860 nm infrared light source for reduced color interference, maintaining the 90-degree scatter detection but yielding readings comparable to NTU only within formazin equivalence limits—typically up to 40 NTU for low-turbidity waters, beyond which particle size effects introduce discrepancies of 10-20% in heterogeneous suspensions.[89] Absorbance-based units, such as Formazin Attenuation Units (FAU), measure transmitted light at 180 degrees, emphasizing total light loss from both scattering and absorption; these lack direct causal equivalence to scatter units, as equivalence ratios vary nonlinearly with turbidity levels, often requiring sample-specific factors rather than universal conversion.[90]| Turbidity Unit | Measurement Basis | Light Source/Wavelength | Detector Angle | Reference Standard |
|---|---|---|---|---|
| JTU | Visual transmission (candle obscuration) | Visible (candle) / N/A | Axial (depth-based) | Silica suspensions [86] |
| NTU | Nephelometric scatter | White / Broad spectrum | 90° [36] | Formazin (EPA Method 180.1) [85] |
| FTU | Formazin-calibrated (geometry unspecified) | Varies | Varies [88] | Formazin |
| FNU | Nephelometric scatter (ISO) | Infrared / 860 nm | 90° [87] | Formazin (ISO 7027) [91] |
| FAU | Attenuation/absorbance | Varies | 180° (transmission) [88] | Formazin |