Community hub
Recent from talks
Contribute something
Nothing was collected or created yet.
Turbidity
View on Wikipedia
| Part of a series on |
| Pollution |
|---|
 |
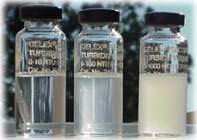
Turbidity is the cloudiness or haziness of a fluid caused by large numbers of individual particles that are generally invisible to the naked eye, similar to smoke in air. The measurement of turbidity is a key test of both water clarity and water quality.
Fluids can contain suspended solid matter consisting of particles of many different sizes. While some suspended material will be large enough and heavy enough to settle rapidly to the bottom of the container if a liquid sample is left to stand (the settable solids), very small particles will settle only very slowly or not at all if the sample is regularly agitated or the particles are colloidal. These small solid particles cause the liquid to appear turbid.
Turbidity (or haze) is also applied to transparent solids such as glass or plastic. In plastic production, haze is defined as the percentage of light that is deflected more than 2.5° from the incoming light direction.[1]
Causes and effects
[edit]Turbidity in open water may be caused by growth of phytoplankton. Human activities that disturb land, such as construction, mining and agriculture, can lead to high sediment levels entering water bodies during rain storms due to storm water runoff. Areas prone to high bank erosion rates as well as urbanized areas also contribute large amounts of turbidity to nearby waters, through stormwater pollution from paved surfaces such as roads, bridges, parking lots and airports.[2] Some industries such as quarrying, mining, and coal recovery can generate very high levels of turbidity from colloidal rock particles.
In drinking water, the higher the turbidity level, the higher the risk that people may develop gastrointestinal diseases.[3] This is especially problematic for immunocompromised people, because contaminants like viruses or bacteria can become attached to the suspended solids. The suspended solids interfere with water disinfection with chlorine[4] because the particles act as shields for viruses and bacteria. Similarly, suspended solids can protect bacteria from ultraviolet (UV) sterilization of water.[5]
In water bodies such as lakes, rivers and reservoirs, high turbidity levels can reduce the amount of light reaching lower depths, which can inhibit growth of submerged aquatic plants and consequently affect species which are dependent on them, such as fish and shellfish. High turbidity levels can also affect the ability of fish gills to absorb dissolved oxygen. This phenomenon has been regularly observed throughout the Chesapeake Bay in the eastern United States.[6][7]
For many mangrove areas, high turbidity is needed in order to support certain species, such as to protect juvenile fish from predators. For most mangroves along the eastern coast of Australia, in particular Moreton Bay, turbidity levels as high as 600 Nephelometric Turbidity Units (NTU) are needed for proper ecosystem health.[citation needed]
Measurement
[edit]
The measurement of turbidity is a key test of both water clarity and water quality.[citation needed] There are two standard units for reporting turbidity: Formazin Nephelometric Units (FNU) from ISO 7027 and Nephelometric Turbidity Units (NTU) from USEPA Method 180.1. ISO 7027 and FNU is mostly widely used in Europe, whereas NTU is mostly widely used in the U.S. ISO 7027 provides the method in water quality for the determination of turbidity. It is used to determine the concentration of suspended particles in a sample of water by measuring the incident light scattered at right angles from the sample. The scattered light is captured by a photodiode, which produces an electronic signal that is converted to a turbidity. Open source hardware has been developed following the ISO 7027 method to measure turbidity reliably using an Arduino microcontroller and inexpensive LEDs.[8]
There are several practical ways of checking water quality, the most direct being some measure of attenuation (that is, reduction in strength) of light as it passes through a sample column of water.[9] The alternatively used Jackson Candle method (units: Jackson Turbidity Unit or JTU) is essentially the inverse measure of the length of a column of water needed to completely obscure a candle flame viewed through it. The more water needed (the longer the water column), the clearer the water. Of course water alone produces some attenuation, and any substances dissolved in the water that produce color can attenuate some wavelengths. Modern instruments do not use candles, but this approach of attenuation of a light beam through a column of water should be calibrated and reported in JTUs.[9]
The propensity of particles to scatter a light beam focused on them is now considered a more meaningful measure of turbidity in water. Turbidity measured this way uses an instrument called a nephelometer with the detector set up to the side of the light beam. More light reaches the detector if there are many small particles scattering the source beam than if there are few. The units of turbidity from a calibrated nephelometer can be either NTU or FTU, depending on the standard method used. To some extent, how much light reflects for a given amount of particulates is dependent upon properties of the particles like their shape, color, and reflectivity. For this reason (and the reason that heavier particles settle quickly and do not contribute to a turbidity reading), a correlation between turbidity and total suspended solids (TSS) is somewhat unusual for each location or situation.[9]
Turbidity in lakes, reservoirs, channels, and the ocean can be measured using a Secchi disk. This black and white disk is lowered into the water until it can no longer be seen; the depth (Secchi depth) is then recorded as a measure of the transparency of the water (inversely related to turbidity). The Secchi disk has the advantages of integrating turbidity over depth (where variable turbidity layers are present), being quick and easy to use, and inexpensive. It can provide a rough indication of the depth of the euphotic zone with a 3-fold division of the Secchi depth, however this cannot be used in shallow waters where the disk can still be seen on the bottom.[10]
Cameras and computer vision have also been used to measured turbidity.[11] Such monitoring can make use of machine learning to identify problems in sewage.[12]
An additional device, which may help measuring turbidity in shallow waters is the turbidity tube.[13][10] The turbidity tube condenses water in a graded tube which allows determination of turbidity based on a contrast disk in its bottom, being analogous to the Secchi disk.
Turbidity in air, which causes solar attenuation, is used as a measure of pollution. To model the attenuation of beam irradiance, several turbidity parameters have been introduced, including the Linke turbidity factor (TL).[14][15]
Standards and test methods
[edit]
Drinking water standards
[edit]Governments have set standards on the allowable turbidity in drinking water. In the United States, public water systems that use conventional or direct filtration methods must not have a turbidity higher than 1.0 NTU at the plant outlet and all samples for turbidity must be less than or equal to 0.3 NTU for at least 95 percent of the samples in any month. Systems that use filtration other than the conventional or direct filtration must follow state limits, which must include turbidity at no time exceeding 5 NTU. Many drinking water utilities strive to achieve levels as low as 0.1 NTU.[16] The European turbidity standard is 4 NTU.[17]
Ambient water standards
[edit]United States
[edit]The US Environmental Protection Agency (EPA) has published water quality criteria for turbidity.[18] These criteria are scientific assessments of the effects of turbidity, which are used by states to develop water quality standards for water bodies. (States may also publish their own criteria.) Some states have promulgated water quality standards for turbidity, including:
- Louisiana: 25, 50 or 150 NTU, or background plus 10 percent, depending on the water body.[19]
- Vermont: 10 NTU or 25 NTU, depending on water body classification.[20]
- Washington: 5 NTU over background (when background is 50 NTU or less), or 10 percent increase when background is over 50 NTU.[21]
Analytical methods
[edit]Published analytical test methods for turbidity include:
Treatment
[edit]Turbidity is commonly treated using a settling or filtration process, or both settling and filtration. Depending on the application, flocculants may be dosed into the water stream to increase the effectiveness of the settling or filtration process.[25][26] Potable water treatment and municipal wastewater plants often remove turbidity with a combination of settling tanks, granular media filtration, and clarifiers.
In-situ water treatment or direct dosing for the treatment of turbidity is common when the affected water bodies are dispersed (i.e. there are numerous water bodies spread out over a geographical area, such as small drinking water reservoirs), when the problem is not consistent (i.e. when there is turbidity in a water body only during and after the wet season) or when a low cost solution is required. In-situ treatment of turbidity involves the addition of a reagent, generally a flocculant, evenly dispensed over the surface of the body of water. The flocs then settle at the bottom of the water body where they remain or are removed when the water body is drained. This method is commonly used at coal mines and coal loading facilities where stormwater collection ponds have seasonal issues with turbidity. A number of companies offer portable treatment systems for in-situ water treatment or direct dosing of reagents.
Reagents
[edit]There are a number of chemical reagents that are available for treating turbidity, including aluminium sulfate or alum (Al2(SO4)3·nH2O), ferric chloride (FeCl3), gypsum (CaSO4·2H2O), poly-aluminum chloride, long chain acrylamide-based polymers and numerous proprietary reagents.[27] The water chemistry must be carefully considered when chemical dosing as some reagents, such as alum, will alter the pH of the water.
The dosing process must also be considered when using reagents as the flocs may be broken apart by excessive mixing.
See also
[edit]- McFarland standards – Scale for turbidity measurement - reference for microbiological analysis
- Ocean optics
- Transparency and translucency – Property of an object or substance to transmit light with minimal scattering
References
[edit]- ^ Thermallaminatingfilms.com. Haze technical definition Archived August 22, 2015, at the Wayback Machine
- ^ National Management Measures to Control Nonpoint Source Pollution from Urban Areas (Report). Washington, D.C.: U.S. Environmental Protection Agency (EPA). November 2005. EPA 841-B-05-004. Chapters 7-8.
- ^ Mann, A.G.; Tam, C.C.; Higgins, C.D.; Lodrigues, L.L. (2007-09-21). "The association between drinking water turbidity and gastrointestinal illness: a systematic review". BMC Public Health. 7 (256). Springer Nature: 256. doi:10.1186/1471-2458-7-256. PMC 2174477. PMID 17888154.
- ^ LeChevallier, M W; Evans, T M; Seidler, R J (July 1981). "Effect of turbidity on chlorination efficiency and bacterial persistence in drinking water". Applied and Environmental Microbiology. 42 (1): 159–167. Bibcode:1981ApEnM..42..159L. doi:10.1128/aem.42.1.159-167.1981. PMC 243978. PMID 7259162.
- ^ Guidelines for Ultraviolet Disinfection of Drinking Water (PDF) (Report). Victoria, BC: British Columbia Ministry of Health. January 2022. pp. 6–7.
- ^ Stevenson, J. Court; Piper, Catherine B.; Confer, Nedra (1979). "Decline of Submerged Plants in Chesapeake Bay". Annapolis, MD: U.S. Fish and Wildlife Service. Archived from the original on 2019-04-28.
- ^ "Sediments". Annapolis, MD: Chesapeake Bay Program. 2009-08-06. Archived from the original on 2011-09-27.
- ^ Wijnen, Bas; Anzalone, G.C.; Pearce, Joshua M. (2014-05-09). "Open-source mobile water quality testing platform". Journal of Water, Sanitation and Hygiene for Development. 4 (3). London: IWA Publishing: 532–537. Bibcode:2014JWSHD...4..532W. doi:10.2166/washdev.2014.137. S2CID 111183462.
- ^ a b c "Measuring Turbidity, TSS, and Water Clarity". Fairborn, OH: Fondriest Environmental, Inc. Retrieved 1 February 2021.
- ^ a b Myre, E, Shaw, R. The Turbidity Tube: Simple and Accurate Measurement of Turbidity in the Field. "The Turbidity Tube" Archived 2015-10-17 at the Wayback Machine
- ^ Antonini, Giorgio; Pearce, Joshua M.; Berruti, Franco; Santoro, Domenico (2024-08-16). "A novel camera-based sensor for real-time wastewater quality monitoring". Water Practice and Technology. 19 (9): 3778–3793. Bibcode:2024WatPT..19.3778A. doi:10.2166/wpt.2024.211. ISSN 1751-231X.
- ^ Ji, Hyon; Yoo, Sung; Lee, Bong-Jae; Koo, Dan; Kang, Jeong-Hee (2020-06-22). "Measurement of Wastewater Discharge in Sewer Pipes Using Image Analysis". Water. 12 (6): 1771. Bibcode:2020Water..12.1771J. doi:10.3390/w12061771. hdl:1805/27691. ISSN 2073-4441.
- ^ Waterwatch Australia, Module 4 - physical and chemical parameters "Methods Turbidity"
- ^ HelioClim (Center for Energy and Processes). Paris, France. "Linke Turbidity Factor." Archived 2011-07-23 at the Wayback Machine
- ^ Kasten, F. (March 1996). "The linke turbidity factor based on improved values of the integral Rayleigh optical thickness". Solar Energy. 56 (3). Elsevier: 239–244. Bibcode:1996SoEn...56..239K. doi:10.1016/0038-092X(95)00114-7..
- ^ "National Primary Drinking Water Regulations". EPA. 2022-01-26.
- ^ "What are the drinking water standards?" (PDF). London: Drinking Water Inspectorate (UK). June 2017. Archived from the original (PDF) on 2020-11-11.
- ^ Quality Criteria for Water (PDF) (Report). EPA. 1986. EPA 440/5-86-001. (Commonly known as the "Gold Book.").
- ^ Louisiana Department of Environmental Quality. Baton Rouge, Louisiana."Surface Water Quality Standards." Louisiana Administrative Code (LAC). Title 33, Part IX, Chapter 11. August 6, 2007.
- ^ Vermont Water Resources Board. Montpelier, Vermont. "Vermont Water Quality Standards." Archived 2013-12-31 at the Wayback Machine January 25, 2006.
- ^ Washington Department of Ecology. Olympia, Washington."Water Quality Standards for Surface Waters of the State of Washington." Washington Administrative Code (WAC). Chapter 173-201A. November 18, 1997.
- ^ International Organization for Standardization. Geneva, Switzerland. "ISO 7027-1:2016 Water quality – Determination of turbidity – Part 1: Quantitative Methods." 2016 and "ISO 7027-2:2019 Water quality – Determination of turbidity – Part 2: Semi-quantitative methods for the assessment of transparency of waters." 2019.
- ^ EPA. Environmental Monitoring Systems Laboratory. Cincinnati, Ohio. "Method 180.1: Determination of Turbidity by Nephelometry; Revision 2.0." August 1993.
- ^ Eaton, Andrew D.; Greenberg, Arnold E.; Rice, Eugene W.; Clesceri, Lenore S.; Franson, Mary Ann H., eds. (2005). Standard Methods For the Examination of Water and Wastewater (21 ed.). American Public Health Association. ISBN 978-0-87553-047-5. Also available on CD-ROM and online by subscription.
- ^ Water Treatment, Grade 1. Denver, CO, USA: American Water Works Association. 2016.
- ^ Darshan Singh Sarai (2006). Water Treatment Made Simple For Operators. John Wiley.
- ^ Earth Systems, Clear Solutions newsletter - Focus on Turbidity [1] 2003.
External links
[edit]- Water on the Web: "Turbidity" (University of Minnesota, Duluth and Lake Superior College)
- "Turbidity and Water" United States Geological Survey (USGS)
- USGS field manual on measuring turbidity
- Water Quality - Stormwater, Washington State
- Tubidy - Stormwater, Washington State
| International | |
|---|---|
| National | |
| Other | |
Turbidity
View on GrokipediaDefinition and Physical Principles
Core Concepts
Turbidity is an optical phenomenon in water characterized by reduced clarity resulting from the scattering and absorption of light by suspended particulate matter. These particles, which do not settle rapidly under gravitational forces, interact with incident light primarily through processes governed by their size relative to the light wavelength, refractive index differences with the surrounding medium, and concentration. Unlike settleable solids, which precipitate out within short periods (typically defined as particles greater than approximately 0.1 mm that settle at rates exceeding 0.1 m/h), turbidity arises from finer suspended material that remains dispersed due to Brownian motion, turbulence, or low settling velocities.[1][6][7] The suspended particles contributing to turbidity encompass a range of diameters generally from about 0.004 mm (4 μm) to 1 mm, including inorganic components such as clay minerals and silt, as well as organic matter like phytoplankton, bacteria, and detritus. Inorganic particles often originate from eroded sediments with densities around 2.65 g/cm³, while organic ones exhibit lower densities (typically 1.0–1.2 g/cm³) and higher water content, affecting their buoyancy and persistence in suspension. This distinction from settleable solids underscores turbidity as a proxy for non-settling dynamics rather than total sediment load, as larger particles (>1 mm) contribute minimally to optical effects once settled.[8][9][10] From physical principles, turbidity emerges as a consequence of particle-light interactions, where scattering dominates for particles comparable to or smaller than the light wavelength (around 0.4–0.7 μm for visible light), following Mie theory for larger sizes and Rayleigh approximations for sub-wavelength particles. Empirical observations confirm an imperfect correlation between turbidity and total suspended solids (TSS), with regression coefficients (R²) ranging from 0.7 to 0.95 across studies, attributable to variations in particle size distribution, shape, and refractive index; for instance, flocculated organics scatter differently than compact silts. Smaller particles exert disproportionately greater scattering per unit mass than larger ones because their higher surface-area-to-volume ratio enhances multiple scattering events and forward scatter efficiency in the Mie regime, leading to amplified opacity for equivalent TSS concentrations—e.g., 1 mg/L of fine clay can produce turbidity levels 10–100 times higher than the same mass of coarse sand. Turbidity thus serves as an indicator of underlying particle dynamics and colloidal stability, not a direct causal agent of pollution.[11][12][7]Optical Properties and Units
Turbidity manifests as an optical phenomenon where suspended particles in a liquid medium scatter and absorb incident light, thereby diminishing the straight-line transmission of light rays and reducing sample clarity. This interaction follows principles of Mie scattering for particles comparable in size to the light wavelength and Rayleigh scattering for smaller particles, with absorption contributing variably based on particle composition. Nephelometric techniques quantify turbidity primarily through the detection of light scattered at a 90-degree angle to the illumination source, isolating scattering effects while minimizing direct transmission and backscattering influences.[13][10][14] The Nephelometric Turbidity Unit (NTU) serves as the contemporary standard, formalized in ISO 7027-1:2016, which mandates formazin polymer suspensions for calibration, near-infrared illumination at 860 nm to reduce chromatic interferences, and precise angular constraints for the detector. This contrasts with the historical Jackson Turbidity Unit (JTU), introduced around 1900 via the Jackson Candle method, a visual attenuation technique using a candle flame observed through a graduated tube filled with sample until obscured, originally scaled against silica suspensions in parts per million. Formazin Turbidity Units (FTU) align numerically with NTU and FNU (Formazin Nephelometric Units) when employing formazin standards, ensuring traceability despite methodological variations in light source or angle.[15][16][17] Direct equivalence between NTU and mass-based metrics like mg/L is untenable, as optical response depends on particle morphology, size distribution, and refractive index; while legacy JTU approximated 1 JTU ≈ 1 mg/L silica under controlled conditions, modern nephelometric readings exhibit no universal conversion, with ratios fluctuating by particle type—e.g., clay minerals scatter differently from organic detritus. In highly turbid regimes (>1000 NTU), prevalent in sediment-laden rivers, nephelometry falters due to multiple scattering events overwhelming the 90-degree signal, prompting shifts to forward-scatter geometries (e.g., 11-30 degrees) or turbidimetry, which assesses attenuated transmitted light incorporating both absorption and forward scattering for broader dynamic range.[18][19][10][20]Sources of Turbidity
Natural Origins
Turbidity in natural water bodies arises primarily from geophysical processes such as soil erosion during storms and floods, which mobilize clay, silt, and organic particles into streams and rivers. In undisturbed watersheds, baseflow turbidity typically remains below 10 NTU, but rainstorms can elevate levels by eroding streambanks and stirring bottom sediments, often exceeding 50 NTU temporarily. Glacial melt contributes significantly in polar and mountainous regions; for instance, deglaciation in Arctic rivers has led to a sharp increase in extreme turbidity events since the early 2010s, with peaks correlating positively with ice melt volumes rather than snowmelt.[1][21] Biological sources include algal blooms and plankton proliferation in nutrient-rich lakes and coastal waters, where dense phytoplankton suspensions can raise turbidity above 10 NTU even in oligotrophic systems during peak growth. Episodic events like volcanic eruptions deposit ash that increases river turbidity through suspended particulates, as observed in ashfall-affected streams where levels spike due to fine inorganic matter. Wildfires similarly enhance sediment mobilization, leading to post-fire turbidity surges in streams from eroded, hydrophobic soils.[8][22][23] Seasonal variability amplifies natural turbidity, particularly in monsoon-driven systems like the Ganges River, where sediment loads from Himalayan erosion peak during heavy rains, yielding averages around 100 NTU and maxima exceeding 300 NTU from silt resuspension alone. In many undisturbed systems, such as forested or glacial watersheds, natural turbidity baselines—ranging from medians under 5 NTU in wet seasons to event-driven highs—often surpass chronic anthropogenic inputs, facilitating nutrient transport and cycling that sustain aquatic food webs without external disturbance.[24][25][26]Anthropogenic Contributors
Agricultural practices, particularly tillage and erosion from croplands, represent a primary anthropogenic source of turbidity through sediment-laden runoff. In the Chesapeake Bay watershed, agriculture contributes approximately 60% of sediment loads entering the bay, driven by soil disturbance and precipitation events that mobilize fine particles into streams.[27] United States Department of Agriculture data indicate that cropland erosion accounts for a substantial portion of nonpoint source sediments nationwide, with annual soil losses from farms often exceeding natural background rates by factors of 10 to 100 in vulnerable areas.[28] Urban development and construction activities exacerbate turbidity via stormwater runoff carrying disturbed soils. Construction site discharges frequently exceed regulatory benchmarks, with untreated stormwater turbidity levels reaching hundreds of NTU during rain events; for instance, the U.S. Environmental Protection Agency sets a 50 NTU monitoring threshold for dewatering operations under the Construction General Permit, reflecting common spikes well above ambient conditions.[29] In developing regions, post-rain spikes often surpass 200 NTU due to inadequate sediment controls, contributing localized pulses of suspended solids to receiving waters.[30] Industrial effluents and activities such as mining tailings discharge or dredging introduce targeted turbidity, though their overall contribution remains minor relative to diffuse sources. Empirical assessments by the EPA reveal that point-source industrial wastewater typically accounts for less than 10% of total sediment loads in mixed-use watersheds, overshadowed by nonpoint runoff; for example, in nutrient and sediment modeling, industrial inputs constitute under 2% of annual bay-wide totals in some systems.[31] Dredging operations can generate acute plumes with elevated turbidity persisting for days, but chronic loading is limited by permits and localized impacts.[32] Despite emphases in certain environmental narratives on anthropogenic dominance, comparative studies grounded in satellite observations and field data demonstrate that natural episodic events often eclipse human-induced inputs. Landsat-derived analyses and hydrodynamic models show hurricanes resuspending volumes of coastal sediments orders of magnitude greater than annual chronic anthropogenic discharges, with single storms mobilizing tens of millions of tons across affected zones.[33] In mixed watersheds, anthropogenic sources may amplify baseline turbidity by 20-50% under steady conditions, but first-principles accounting of erosion mechanics and event-scale hydrology reveals natural forcings like cyclones as the principal drivers of peak loads, tempering attributions of systemic degradation solely to human activity.[34][35]Impacts of Turbidity
Ecological Consequences
Elevated turbidity reduces light penetration in water columns, limiting photosynthesis in phytoplankton and periphyton, which form the base of aquatic food webs. Empirical studies indicate that Secchi disk depths, a proxy for light availability, become unreliable above 20 NTU, correlating with diminished primary production as suspended particles scatter and absorb photosynthetically active radiation.[36] [37] This reduction can lead to lower dissolved oxygen levels through decreased oxygenic photosynthesis, exacerbating hypoxia in stratified waters, particularly during periods of high organic loading.[38] Chronic exposure to high total suspended solids (TSS), often exceeding 50 mg/L and corresponding to turbidity levels above 25 NTU, causes abrasive damage to fish gills, thickening epithelial tissues and impairing ionoregulation and gas exchange.[39] [40] Such effects manifest as reduced growth rates and increased susceptibility to pathogens in species unadapted to sediment-laden environments, as documented in laboratory exposures of salmonids and other rheophilic fishes.[41] However, certain species exhibit adaptations to high turbidity, thriving in naturally sediment-rich systems without the harms observed in clear-water natives. Common carp (Cyprinus carpio), for instance, maintain filter-feeding efficiency and population viability in ponds with turbidity up to 120 NTU, leveraging chemosensory foraging over vision.[42] Meta-analyses of fish community structure reveal that tolerant taxa, including cyprinids and catostomids, dominate in unaltered turbid rivers, supporting diverse assemblages where turbidity stabilizes habitats against excessive algal blooms absent anthropogenic eutrophication.[43] High natural turbidity imposes trade-offs in biodiversity dynamics, often buffering against invasive species reliant on visual predation. By impairing sight-feeders' detection ranges, turbidity levels above 10 NTU reduce encounter rates and capture success for visually oriented predators, conferring refuge to prey and favoring chemosensory or tactile specialists.[44] [45] This dynamic counters narratives equating all turbidity elevations with degradation, as empirical data from estuarine and riverine systems show sustained macroinvertebrate and benthic diversity in turbid regimes, provided sediment sources remain geogenic rather than pollution-driven.[46] Overemphasis on low-turbidity benchmarks, derived primarily from oligotrophic lake models, overlooks these adaptive equilibria in lotic and floodplain ecosystems where historical turbidity exceeds 100 NTU seasonally.[47]Health and Human Use Effects
Turbidity in water does not pose direct toxicological risks to human health, as suspended particles such as clays or minerals are generally inert and non-pathogenic.[48] [2] Instead, its primary health concern arises indirectly by harboring microorganisms, including bacteria, viruses, and parasites like Cryptosporidium, which can evade detection and treatment.[1] High turbidity levels shield pathogens from disinfectants such as chlorine or ultraviolet light by scattering radiation and providing physical attachment sites, thereby reducing disinfection efficacy; for instance, chlorination efficiency decreases with increasing turbidity due to particulate interference.[49] [50] Epidemiological studies have observed associations between elevated drinking water turbidity (e.g., above 1 NTU) and increased incidence of gastrointestinal illnesses, attributed to correlated pathogen loads rather than turbidity per se.[51] However, rigorous reviews indicate no causal direct link between turbidity and disease in the absence of contaminants, emphasizing its role as a quality indicator rather than a pathogen itself.[52] In potable water systems, turbidity exceeding 5 NTU often signals filtration or treatment inadequacies, prompting regulatory alerts as a precautionary proxy for microbial breakthroughs, though empirical data confirm that naturally occurring mineral turbidity—such as from silts or sediments—carries no verified health hazards when free of biological agents.[53] World Health Organization assessments reinforce that turbidity alone does not equate to health endangerment, debunking unsubstantiated alarmism by highlighting the need for pathogen-specific testing over turbidity metrics in isolation.[48] For human recreational and utilitarian uses, elevated turbidity impairs underwater visibility, complicating activities like fishing and swimming; anglers report reduced success in waters above 10-20 NTU, as suspended particles obscure lures and prey detection for both humans and fish, potentially elevating accident risks in opaque conditions.[54] [55] This aesthetic and functional detriment contrasts with negligible direct physiological impacts on users, underscoring turbidity's role as an environmental hindrance rather than a bodily threat.[1]Economic Ramifications
In the United States, public water utilities allocate substantial resources to filtration infrastructure for achieving low turbidity levels mandated by regulations like the Surface Water Treatment Rule, which requires 95% of monthly samples to measure below 0.3 NTU for individual filters serving surface water sources.[56] These systems, including rapid sand filters and membrane technologies, address turbidity primarily as an aesthetic and indirect pathogen indicator rather than a direct health hazard, with compliance costs embedded in broader capital expenditures projected to surpass $515 billion for water and wastewater treatment by 2035.[57] In regions with naturally elevated turbidity from geological erosion, such as arid Southwest river basins, these uniform standards can amplify operational burdens by necessitating treatment of baseline sediment loads unrelated to human activity, potentially diverting funds from other infrastructure priorities.[58] Agricultural sectors face direct economic losses from turbidity-related sediment accumulation, which clogs irrigation systems and diminishes soil productivity; estimates place annual on-farm costs from such erosion and deposition at $500 million to $1.2 billion nationwide.[59] These impacts manifest in reduced water flow efficiency and increased maintenance for drip and sprinkler systems, particularly in sediment-prone watersheds, though natural sediment inputs can offset some long-term fertility declines by replenishing topsoil. In fisheries-dependent economies, analogous sediment burdens contribute to gear damage and habitat alterations that indirectly elevate operational costs, though quantification remains tied to broader erosion economics. The food and beverage industries, including winemaking, incur rejection and rework expenses from turbid batches exceeding quality thresholds, often prompting additional filtration to achieve clarity below 1 NTU for sterile bottling and market acceptance.[60] Inline turbidity monitoring mitigates these by enabling precise process control, avoiding product loss and extending equipment life, with poor management linked to higher capital outlays for redundant filtering.[61] Overall, while turbidity management yields benefits in product consistency and regulatory adherence, the emphasis on stringent removal in naturally variable systems may impose net costs exceeding marginal gains, especially where empirical health linkages are weak compared to aesthetic or perceptual drivers.Measurement Techniques
Historical Approaches
The Jackson candle turbidimeter, developed around 1900 by George E. Waring and refined by Whipple and Jackson, represented the first standardized method for quantifying water turbidity through visual assessment.[62] This device consisted of a vertical glass tube mounted above a standard candle flame, into which a water sample was poured until the flame's silhouette became indistinct due to light extinction by suspended particles; the depth of the sample at this extinction point was read against a graduated scale calibrated in parts per million of silica equivalent, yielding Jackson Turbidity Units (JTU).[63][64] The method relied on empirical observation of light transmission, providing a qualitative-to-quantitative bridge for assessing clarity in natural waters.[65] JTU measurements via the Jackson candle were widely applied in environmental monitoring of rivers and lakes through the mid-20th century, often correlating roughly with silica-based suspensions but varying with particle type and size due to differences in light scattering.[66] Usage persisted into the 1960s and early 1970s for routine field assessments, as seen in U.S. Geological Survey protocols, before being phased out in favor of more precise optical techniques amid evolving water quality standards.[67][62] Parallel early efforts linked turbidity to gravimetric analysis of suspended matter, distinguishing optical haze from mass-based settleables; the Imhoff cone, introduced in the early 20th century for wastewater evaluation, measured settleable solids by allowing a sample to stand in a conical vessel for 1-2 hours and recording the volume of settled material in milliliters per liter.[68] However, practitioners recognized inherent causal disparities, as turbidity reflects dynamic light attenuation by all particulates—colloidal to coarse—while settleables and total suspended solids (TSS) quantify mass via filtration and drying, yielding no fixed equivalence (e.g., 1 JTU ≈ 1-3 mg/L TSS variably).[16][69] Pre-digital methods like these suffered from labor-intensive fieldwork, operator subjectivity in visual endpoints, and limited precision often below 10-20% reproducibility across samples or observers, constrained by lack of standardization for diverse particle compositions and absence of automated detection.[70] These shortcomings underscored the need for instrumental shifts toward consistent optical principles, though early approaches established foundational empirical baselines for turbidity as a proxy for water quality impairment.[63]Current Methodologies
Current methodologies for turbidity measurement primarily rely on nephelometric principles, where instruments detect light scattered by suspended particles at specified angles to quantify turbidity in nephelometric turbidity units (NTU). The U.S. Environmental Protection Agency (EPA) approves nephelometers compliant with Method 180.1, which employs a tungsten filament lamp and 90-degree scattered light detection for samples ranging from 0 to 40 NTU, with dilution required for higher values.[71] These designs, such as those from Hach's 2100 series, incorporate dual-detector systems to perform ratio measurements that compensate for sample color interference, lamp fluctuations, and stray light, thereby improving accuracy in colored waters.[72] Verification protocols involve calibration using formazin or stabilized formazin standards, ensuring traceability and minimizing systematic errors, though inherent uncertainties arise from particle size distribution and refractive index variations affecting scatter efficiency.[73] In field applications, submersible turbidity sensors integrated into multiparameter sondes, such as those deployed by the U.S. Geological Survey (USGS), enable real-time NTU logging in aquatic environments. These probes often adhere to EPA or ISO standards and feature mechanical wipers or anti-fouling mechanisms to mitigate biofouling and sediment accumulation on optics, which can otherwise introduce measurement drift over extended deployments.[74] USGS guidelines emphasize routine sensor inspection, field calibration against laboratory standards, and data validation through surrogate checks to account for environmental interferences like air bubbles or temperature effects, with typical uncertainties in continuous monitoring ranging from 5-15% depending on site conditions.[75] Turbidity measurements frequently serve as proxies for total suspended solids (TSS) via site-specific linear regression models, yielding correlation coefficients (r²) typically between 0.7 and 0.9 in empirical datasets from rivers and lakes. However, these regressions exhibit particle-specific caveats, as correlations weaken with varying sediment composition, organic content, or flocculated aggregates that alter light scattering independently of mass concentration, necessitating validation against direct gravimetric TSS analysis for each deployment context.[14][76]Emerging Innovations
IoT-integrated turbidity sensors have advanced post-2020 monitoring by enabling wireless, real-time data collection from rivers and water bodies via cloud analytics platforms. A 2025 systematic review highlights that these systems detect turbidity fluctuations instantaneously, replacing periodic manual sampling with continuous streams of data that can reduce fieldwork demands by enabling automated alerts and predictive modeling.[77] For instance, deployments in aquaculture and wastewater contexts have achieved turbidity measurement accuracies exceeding 96%, integrating with broader water quality parameters for scalable deployment.[78] Image-based analysis represents a 2025 innovation for remote turbidity assessment, employing fixed camera traps and processing algorithms to extract proxies from river visuals without direct immersion sensors. Full-scale tests documented in Hydrology and Earth System Sciences validate this approach across varied camera systems, yielding reliable turbidity estimates in inaccessible areas where traditional probes falter due to biofouling or deployment costs.[79] Complementing this, satellite-derived methods for coastal turbidity, refined through Landsat-8 algorithms, apply regional corrections for chlorophyll-a absorption interference, improving accuracy in optically complex waters by isolating suspended particle signals from biological confounders.[80] Optical innovations like laser diffraction and multi-angle scattering enhance turbidity sensors by quantifying particle size distributions, which facilitate causal attribution to sources such as erosion versus organic matter through distinct scattering patterns at small angles.[20] These techniques, advanced in recent photometry studies, support field-portable units that differentiate fine clays (indicative of runoff) from coarser sediments, outperforming single-angle nephelometry in resolving multi-scattering effects for precise source inference.[81]Regulatory Frameworks
Potable Water Standards
The United States Environmental Protection Agency (EPA), through the Surface Water Treatment Rule (SWTR) established in 1989 and refined by the Long Term 1 Enhanced Surface Water Treatment Rule (LT1ESWTR) effective from 2002 for larger systems and 2005 for smaller ones, requires that turbidity in filtered surface water supplies not exceed 0.3 nephelometric turbidity units (NTU) in 95% of monthly measurements, with no value surpassing 1 NTU at any time.[82] [83] These thresholds function as performance indicators for filtration systems, empirically linked to achieving at least 3-log (99.9%) removal of Giardia lamblia cysts, based on bench-scale and full-scale studies showing that turbidity levels below 0.3 NTU correlate with effective capture of protozoan-sized particles during conventional treatment processes like coagulation, sedimentation, and filtration.[84] [85] The World Health Organization (WHO) advises maintaining drinking water turbidity below 1 NTU to facilitate optimal disinfection and filtration outcomes, as higher levels can impede ultraviolet and chemical disinfectant penetration, potentially allowing residual pathogens to survive despite treatment.[86] While no strict health-based maximum exists, WHO notes that turbidity up to 5 NTU post-filtration poses minimal direct risk from inert mineral particles but may indicate incomplete particle removal and trigger aesthetic objections; this recommendation stems from field data demonstrating that sub-1 NTU levels ensure log reductions in microbial contaminants without overemphasizing cosmetic clarity over microbial barrier efficacy.[48] Under the European Union's Drinking Water Directive 2020/2184, effective from 2021 with transposition by member states by 2023, treated water must exhibit turbidity not exceeding 1 NTU in any sample, with at least 95% below 0.3 NTU for surface-derived supplies, mirroring EPA criteria to verify treatment trains capable of 3-log Giardia removal through particle aggregation and depth filtration.[88] [89] These parametric values rely on validated correlations from pilot studies and operational data, where consistent low turbidity post-filtration predicts robust protozoan cyst interception, though standards account for process variability by prioritizing ongoing monitoring over source-specific adjustments.[90]Ambient and Surface Water Criteria
Under the U.S. Clean Water Act, states establish ambient water quality criteria for turbidity in surface waters to protect designated uses such as aquatic life propagation and recreation, typically expressed as numeric limits or excursions above natural background levels. For instance, criteria often range from 10 to 50 nephelometric turbidity units (NTU) for streams, with examples including no more than 10 NTU above natural conditions for cold-water fisheries in some states or absolute caps of 50 NTU in non-exceptional waters.[30] These thresholds aim to maintain sufficient light penetration for photosynthesis and minimize habitat disruption from suspended particles, though attainment proves difficult in geologically predisposed areas where baseline turbidity naturally surpasses set limits due to erosion or algal dynamics.[91] Internationally, criteria adapt to regional baselines; Australia's ANZECC guidelines employ narrative standards that permit higher turbidity in naturally opaque systems, such as coastal or sediment-laden inland waters, by referencing local reference conditions rather than uniform numeric caps to avoid penalizing inherent ecosystem traits.[92] In contrast, rivers traversing China's Loess Plateau routinely register turbidity exceeding 100 NTU—often 183 to 199 NTU in peak erosion zones—driven by wind-blown silts and seasonal runoff, underscoring how aridity and soil fragility necessitate criteria attuned to dominant erosional processes over arbitrary low thresholds.[93] Surface water monitoring frequently correlates turbidity with total suspended solids (TSS) concentrations, where turbidity serves as an optical proxy for particle loads that impair benthic habitats via burial and reduced visibility for visual predators.[8] Empirical relations show turbidity explaining up to 98% of TSS variance in calibrated datasets, facilitating rapid field assessments, yet causal attribution to ecological stressors remains incomplete without particle composition analysis, as turbidity alone does not quantify sorbed toxicants or distinguish biogenic from inorganic contributors.[94][95]Debates and Limitations in Regulation
Turbidity measurements are frequently employed as a surrogate for total suspended solids (TSS) in water quality assessments, yet this proxy exhibits limitations in reliably indicating pathogen loads or toxic contaminants. While elevated turbidity often correlates with increased microbial risks by providing attachment sites for bacteria and shielding them from disinfection, clear waters in eutrophic systems can still pose hazards through nutrient-driven algal toxins, whereas naturally turbid glacial meltwaters—rich in fine glacial flour—typically lack elevated pathogen levels despite high readings.[96] Regulatory frameworks often impose uniform low turbidity thresholds without adequately distinguishing natural baselines from anthropogenic influences, potentially penalizing systems with inherent high variability such as glacial or arid rivers. For example, assessments of rivers like the Poplar River have identified dominant natural sediment sources contributing to turbidity exceedances, challenging assumptions that all elevated levels stem from human activity. A 2021 analysis of stream segments in the West Fork of the White River found that downstream violations of water quality standards for turbidity were influenced by both natural geomorphic processes and human factors, underscoring the need to quantify relative contributions before attributing failures solely to pollution.[97][98][99] Critiques of turbidity-based policies highlight risks of overreach, as standards may overlook site-specific variability models and enforce blanket reductions that disrupt ecosystems adapted to periodic high-turbidity events. In sedimentology, a 2002 review debunked common misconceptions about turbidites—undersea deposits long misinterpreted as products of uniform turbidity currents—revealing how oversimplified causal models can lead to erroneous interpretations of depositional processes, paralleling regulatory tendencies to treat all turbidity as inherently degradative without empirical validation of anthropogenic causation.[100][101] Such approaches advocate for regulations incorporating dynamic baselines and causal attribution, rather than static targets that disadvantage naturally variable or pristine systems.[102]Mitigation Strategies
Traditional Treatment Methods
Coagulation and flocculation constitute the initial stages of traditional turbidity removal in water treatment, where aluminum sulfate (alum) is commonly dosed at 10-50 mg/L to destabilize colloidal particles through charge neutralization and sweep flocculation mechanisms.[103] This process is optimized via empirical jar testing, which simulates full-scale conditions by varying coagulant doses, rapid mixing for dispersion, slow mixing for floc formation, and settling to evaluate turbidity reduction, ensuring site-specific efficacy for raw waters with varying particle loads.[104] For waters exceeding 50 NTU, subsequent sedimentation in basins allows larger flocs to settle by gravity, typically achieving partial clarification before filtration.[105] Rapid sand filtration follows coagulation-sedimentation, employing graded sand media to capture remaining flocs via mechanical straining, adsorption, and biological activity, routinely reducing effluent turbidity from 2-10 NTU to below 0.1-1.0 NTU under conventional operation.[106] Filter runs last 24-72 hours until head loss increases, prompting backwashing with chlorinated water to dislodge accumulated solids, which generates sludge comprising 0.5-2% of treated volume.[106] Sludge from sedimentation and backwash is managed through thickening, dewatering, and disposal or limited recycling to the plant headworks to avoid reintroducing contaminants, with studies indicating overall process efficiencies of 90-99% turbidity removal in municipal settings when optimized.[107] Recycling backwash water enhances coagulation for low-turbidity sources but requires controls to prevent breakthrough of organics or pathogens, maintaining filtrate quality per regulatory turbidity limits.[108]Advanced Remediation Techniques
Ultrafiltration (UF) and microfiltration (MF) membranes represent post-2010 advancements in physical separation for turbidity removal, achieving particulate matter rejection rates exceeding 99% and effluent turbidities below 0.1 NTU without chemical coagulants. These pressure-driven processes employ porous barriers with pore sizes of 0.001–0.1 μm for UF and 0.1–10 μm for MF, effectively capturing suspended solids, colloids, and microorganisms from surface or wastewater sources. Scalability has been demonstrated in pilot-scale implementations, with energy costs ranging from 0.2–0.5 kWh/m³ for low-pressure variants, offering long-term savings over chemical-intensive methods despite higher upfront capital. However, membrane fouling accelerates in feeds with initial turbidities above 50 NTU, necessitating periodic backwashing or pretreatment, which can increase operational complexity in high-sediment environments like monsoon-affected rivers. Electrocoagulation (EC) employs sacrificial electrodes, typically aluminum or iron, to generate in-situ metal hydroxides that destabilize and flocculate turbid particles, yielding turbidity reductions of 90–99% in batch and continuous-flow systems.[111] Validated by U.S. Environmental Protection Agency evaluations, EC minimizes sludge volume by 50–70% relative to traditional chemical coagulation due to compact floc formation and electrochemical dissolution control, with electrode consumption rates of 0.1–0.3 kg/m³ treated. Post-2015 innovations, including alternating current configurations, enhance electrode longevity and reduce passivation, enabling deployment in decentralized units for industrial effluents or remote water supplies at costs of $0.5–1.5 per m³. Empirical data from field trials indicate optimal performance at pH 6–8 and current densities of 10–50 mA/cm², though scaling requires addressing power demands in off-grid settings.[112] Constructed wetlands and detention basins integrate natural filtration for stormwater runoff turbidity control, achieving empirical reductions of 40–70% through sedimentation, plant uptake, and microbial processes in subsurface or surface-flow designs.[113] These systems, refined since 2010 for urban applications, feature hydraulic retention times of 1–7 days and vegetated zones that enhance particle settling while minimizing anthropogenic inputs via source-control integration, such as permeable pavements. Cost-benefits include low operational expenses ($0.1–0.3/m³) and multi-pollutant removal, with scalability evidenced in highway and agricultural runoff pilots covering hectares. Limitations arise in cold climates or high-velocity flows, where supplemental baffles or hybrid media improve efficiency without compromising ecological co-benefits like biodiversity enhancement.[114]References
- https://www.coastalwiki.org/wiki/Turbidity_sensors
- https://iris.who.int/bitstream/[handle](/page/Handle)/10665/44584/9789241548151_eng.pdf
- https://link.springer.[com](/page/.com)/article/10.1007/s13201-024-02226-y
- https://www.[sciencedirect](/page/ScienceDirect).com/science/article/abs/pii/S1383586610003102