Hubbry Logo
search
logo
1035076

Phonocardiogram

logo
Community Hub0 Subscribers
Read side by side
from Wikipedia
Phonocardiogram
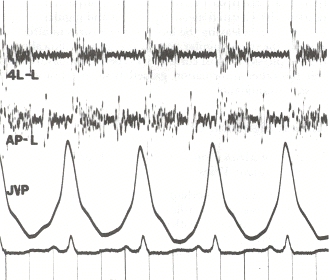
Phonocardiogram and jugular venous pulse tracing from a middle-aged man with pulmonary hypertension (pulmonary artery pressure 70 mm Hg) caused by cardiomyopathy. The jugular venous pulse tracing demonstrates a prominent a wave without a c or v wave being observed. The phonocardiograms (fourth left interspace and cardiac apex) show a murmur of tricuspid insufficiency and ventricular and atrial gallops.[1]
SynonymsPCG
ICD-9-CM89.55
Phonocardiograms of common murmurs.

A phonocardiogram (or PCG) is a plot of high-fidelity recording of the sounds and murmurs made by the heart with the help of the machine called the phonocardiograph; thus, phonocardiography is the recording of all the sounds made by the heart during a cardiac cycle.[2][3]

Medical use

[edit]
Wiggers diagram of various events of a cardiac cycle, including a phonocardiogram at bottom.

Heart sounds result from vibrations created by the closure of the heart valves. There are at least two; the first (S1) is produced when the atrioventricular valves (tricuspid and mitral) close at the beginning of systole and the second (S2) when the aortic valve and pulmonary valve (semilunar valves) close at the end of systole.[4] Phonocardiography allows the detection of subaudible sounds and murmurs and makes a permanent record of these events.[5] In contrast, the stethoscope cannot always detect all such sounds or murmurs and provides no record of their occurrence. The ability to quantitate the sounds made by the heart provides information not readily available from more sophisticated tests and provides vital information about the effects of certain drugs on the heart. It is also an effective method for tracking the progress of a patient's disease.[medical citation needed]

Discrete and the packet wavelet transform

[edit]

According to a review by Cherif et al., discrete wavelet transform (DWT) is better at not affecting S1 or S2 while filtering heart murmurs. Packet wavelet transform affects internal components structure much more than DWT does.[6]

History

[edit]
William Birnbaum with a Phonocardiogram System for use in Project Gemini, 1965

Awareness of the sounds made by the heart dates to ancient times. The idea of developing an instrument to record it may date back to Robert Hooke (1635–1703), who wrote: "There may also be a possibility of discovering the internal motions and actions of bodies - whether animal, vegetable, or mineral, by the sound they make". The earliest known examples of phonocardiography date to the 1800s.[7]

Monitoring and recording equipment for phonocardiography was developed through the 1930s and 1940s. Standardization began by 1950, when the first international conference was held in Paris.[7]

A phonocardiogram system manufactured by Beckman Instruments was used on at least one of the Project Gemini crewed spaceflights (1965–1966) to monitor the heartbeat of astronauts on the flight. It was one of many Beckman Instruments specialized for and used by NASA.[8]

John Keefer filed a patent for a phonocardiogram simulator in 1970 while he was an employee of the U.S. government. The original patent description indicates that it is a device which via electrical voltage mimics the human heart's sounds.[9]

Fetal Phonocardiogram

[edit]

A fetal phonocardiogram (or fPCG) is a specialized application of phonocardiography designed to be a non-invasive diagnostic technique to capture the sounds of the fetal heart in utero. These fetal phonocardiograms can be analyzed to detect any abnormalities in the fetal heart. Fetal phonocardiography has become an important tool in prenatal care, as it allows clinicians to detect and monitor potential heart problems in the fetus before birth.[10]

The use of phonocardiography to study the fetal heart dates back to the 1960s, when researchers first began to explore the feasibility of detecting fetal heart sounds using external microphones.[10] Early studies focused on using phonocardiography to measure fetal heart rate and rhythm. Over time, advances in technology and techniques have enabled researchers to use fetal phonocardiography to detect a wider range of fetal heart abnormalities.[11][12] Fetal phonocardiography is typically performed during routine prenatal visits, starting around 18–20 weeks of gestation. The procedure involves placing a small microphone on the mother's abdomen over the fetal heart. The microphone captures the sounds of the fetal heart, which are then amplified and recorded for analysis. Khandoker et al. developed a multi-channel fetal phonocardiogram (fPCG) with four sound transducers applied in a simple and consistent pattern across the maternal abdomen.[13][14] The intellectual property (IP) technology license was given to the home-based monitoring device, the Emirati startup, that helps pregnant mothers monitor fetal heartbeat and the baby's cardiac activity.[15]

See also

[edit]

References

[edit]

Further reading

[edit]
Revisions and contributorsEdit on WikipediaRead on Wikipedia
from Grokipedia
A phonocardiogram (PCG) is a graphical representation of the acoustic signals produced by the heart, including normal sounds (such as the first and second heart sounds, S1 and S2) and any murmurs or abnormal noises, captured noninvasively via a microphone or transducer placed on the chest surface and converted into a visual waveform for analysis.[1][2] Developed in the late 19th century, phonocardiography emerged as an objective extension of cardiac auscultation, with the first recordings resembling modern PCGs created by Willem Einthoven and Jean Geluc in 1894 using early electromechanical devices to time heart sounds relative to the cardiac cycle.[3] Over the subsequent decades, the technique evolved from analog capillary electrometers to amplified graphic recorders in the early 20th century, enabling qualitative and quantitative assessment of cardiac acoustics beyond subjective stethoscope listening.[3] By the mid-20th century, phonocardiography had become a standard diagnostic tool in cardiology, often synchronized with electrocardiography (ECG) for precise timing of mechanical events.[3][4] In contemporary clinical practice, PCGs provide valuable insights into structural and functional heart disorders, such as valvular diseases, congenital anomalies, left ventricular dysfunction, and ischemia, by identifying specific sound components like third (S3) or fourth (S4) heart sounds and classifying murmur characteristics through signal processing techniques including wavelet decomposition and machine learning algorithms.[5] Modern digital phonocardiography, including acoustic cardiography systems like AUDICOR, enhances diagnostic accuracy— for instance, detecting S3 with up to 88.5% specificity in heart failure screening—and offers advantages over traditional auscultation by reducing operator dependency and enabling ambulatory monitoring.[5] These advancements have integrated PCG into broader cardiovascular assessments, correlating strongly with echocardiography (e.g., 88% sensitivity for reduced ejection fraction) and supporting applications in emergency triage, chemotherapy cardiotoxicity surveillance, and cardiac resynchronization therapy optimization.[5]

Fundamentals

Definition and Purpose

A phonocardiogram (PCG) is a graphic recording of the acoustic vibrations generated by the heart and its associated structures, such as the valves and blood vessels, captured through a microphone or electronic stethoscope that converts these sounds into electrical signals for visualization as a waveform.[6] Typically plotted with amplitude on the vertical axis and time on the horizontal axis, the PCG provides a time-domain representation of cardiac acoustic events, allowing for the identification of key components like the first heart sound (S1) and second heart sound (S2).[7] The primary purpose of a phonocardiogram is to detect, characterize, and quantify auscultatory findings, including heart sounds, murmurs, clicks, and rubs, thereby aiding in the diagnosis of valvular diseases, structural abnormalities, and functional cardiac issues.[6] By offering a non-invasive method to assess cardiac acoustics, PCG supports early identification of conditions such as mitral regurgitation or aortic stenosis through objective analysis of sound intensity, duration, and timing relative to the cardiac cycle.[8] Compared to traditional auscultation with a stethoscope, phonocardiography provides several advantages, including objective and reproducible visual documentation that reduces inter-observer variability and enhances diagnostic accuracy, particularly for novice clinicians.[9] It enables repeated playback, storage for archival review, and quantitative evaluation of acoustic features, which can be challenging with subjective listening alone.[8] PCG signals are commonly represented in units of millivolts (mV) for electrical output or equivalent acoustic pressure, spanning time scales of seconds to capture multiple cardiac cycles, with frequency content typically ranging from 5 to 700 Hz to encompass the full spectrum of heart sounds.[6] This format facilitates overlay of frequency-domain analyses, such as spectrograms, for deeper insight into sound characteristics without altering the core time-based plot.[7]

Physiological Basis of Heart Sounds

The first heart sound, denoted as S1, arises from the closure of the atrioventricular valves (mitral and tricuspid) at the onset of ventricular systole, when ventricular pressures exceed atrial pressures, leading to rapid valve closure and associated vibrations in the cardiac structures.[10] This sound marks the beginning of mechanical systole and is typically of short duration, approximately 0.10 to 0.15 seconds, with frequency components ranging from 20 to 150 Hz, reflecting the higher-frequency mitral component (M1) preceding the lower-frequency tricuspid component (T1).[11] The intensity and timing of S1 can vary with factors such as the position of the bellies of the papillary muscles relative to the valve leaflets during closure.[10] The second heart sound, S2, results from the closure of the semilunar valves (aortic and pulmonic) at the onset of diastole, as ventricular pressures fall below arterial pressures, causing the valve cusps to snap shut and generate vibrations transmitted through the blood and vessel walls.[10] S2 has a shorter duration than S1, typically around 0.08 to 0.12 seconds, and exhibits a broader frequency range of 30 to 200 Hz, with the aortic component (A2) being higher pitched and louder than the pulmonic component (P2) due to greater systemic vascular resistance.[12] A common physiological variation is the splitting of S2 during inspiration, where increased venous return to the right heart delays pulmonic valve closure, resulting in a brief temporal separation of A2 and P2 components, which narrows or disappears during expiration.[10] Intensity of S2 may also decrease with expiration or changes in body position, influenced by alterations in intrathoracic pressure affecting venous return.[13] Secondary heart sounds include S3 and S4, which originate from ventricular filling dynamics in diastole. S3 occurs during early diastole from the abrupt deceleration of rapid ventricular filling into a compliant ventricle, often linked to tautening of the chordae tendineae or papillary muscle vibrations, and is a low-frequency sound (typically below 50 Hz) lasting about 0.10 seconds; it is physiological in young individuals or athletes but may indicate pathology in adults.[10] S4, by contrast, is generated in late diastole by atrial contraction forcing blood against a stiff or hypertrophied ventricle, producing low-frequency vibrations (20 to 30 Hz) of brief duration (around 0.05 seconds), reflecting reduced ventricular compliance.[14] Extracardiac contributions to recorded heart sounds can include pericardial friction rubs, which are high-frequency (up to 1,000 Hz), scratchy noises from inflamed pericardial layers rubbing together, often triphasic and unrelated to the cardiac cycle timing.[10] Other extracardiac sounds encompass pleural friction rubs from lung surface inflammation or vascular bruits from turbulent flow in nearby arteries, which may superimpose on phonocardiographic tracings but lack the rhythmic association with valve closures.[10] These sounds arise from non-cardiac thoracic structures and can vary with respiration or patient movement.[13]

Recording Techniques

Instrumentation and Equipment

The core components of phonocardiogram (PCG) instrumentation are sensors that capture acoustic vibrations generated by cardiac activity. These include contact microphones such as piezoelectric sensors, which convert mechanical vibrations into electrical signals through the piezoelectric effect, and condenser microphones (including electret types), which use a diaphragm and capacitor to detect pressure changes from sound waves. Accelerometers serve as alternative contact transducers, measuring absolute accelerations of the chest wall induced by heart sounds. These sensors are positioned on the chest at standard auscultation points: the aortic area (second right intercostal space at the sternal border), pulmonic area (second left intercostal space at the sternal border), tricuspid area (fourth left intercostal space at the sternal border), and mitral area (fifth left intercostal space in the midclavicular line).[15][16][17][18] Amplifiers and filters are essential for signal conditioning in PCG systems, addressing the inherently low-amplitude outputs from sensors, typically in the range of 0.1-50 mV. High-gain operational amplifiers, such as low-noise types with gains exceeding 100 V/mV, boost these weak signals while preserving fidelity across the relevant frequency spectrum. Bandpass filters, often configured with a high-pass cutoff around 20 Hz to eliminate baseline wander and respiratory artifacts, and a low-pass cutoff between 500-2000 Hz to focus on cardiac frequencies while rejecting high-frequency noise, ensure clean isolation of heart sounds.[16][19][20][17] Recording devices for PCG have evolved from analog to digital formats. Early analog phonocardiographs, common in the mid-20th century, used ink-on-paper galvanometers to produce graphical traces of heart sounds on moving chart paper, allowing visual representation synchronized with time. Contemporary digital systems incorporate analog-to-digital converters integrated into personal computers, smartphones, or portable recorders, with sampling rates of 2000-8000 Hz to capture the broadband content of cardiac acoustics without aliasing.[17][21] Accessories augment PCG instrumentation for enhanced usability and accuracy. Stethoscope integrations, such as electronic attachments to conventional models, combine acoustic listening with digital recording capabilities. Multi-channel configurations enable simultaneous ECG acquisition for temporal synchronization between electrical and phonocardiographic signals. Noise-canceling technologies, including active filtering in sensors and amplifiers, mitigate environmental interference to improve signal-to-noise ratios in clinical settings.[22][23][22]

Acquisition Procedures

Patient preparation for phonocardiogram (PCG) acquisition begins with ensuring a quiet environment to minimize external noise interference, as ambient sounds can obscure cardiac vibrations.[24] The patient is positioned supine or in the left lateral decubitus to optimize sound transmission from the chest wall, with the chest exposed for direct sensor contact; sitting upright may also be used if needed for specific assessments.[25] To avoid alterations in heart rate or sound characteristics, patients should refrain from consuming stimulants such as caffeine that could affect cardiac activity prior to recording. Sensor placement occurs at standard auscultatory sites corresponding to valve locations: the aortic area (right second intercostal space), pulmonic area (left second intercostal space), tricuspid area (left lower sternal border), and mitral area (left fifth intercostal space near the apex).[26] Recordings are typically obtained simultaneously with electrocardiogram (ECG) to provide timing references for heart sound components relative to electrical events.[27] Each site is recorded for 20-60 seconds to capture multiple cardiac cycles (usually 10-20 beats at resting heart rates), ensuring sufficient data for analysis while minimizing patient discomfort.[27] Standardization protocols emphasize calibration of the recording system for consistent amplitude and frequency response across the 20-2000 Hz range relevant to heart sounds. Consistent lead placement follows established auscultatory conventions to enable comparable results across sessions or clinicians, though specific guidelines from major cardiology societies focus more on auscultation principles than digital PCG.[28] Common challenges include motion artifacts from patient movement or breathing, which introduce low-frequency noise mimicking or masking heart sounds, and respiratory interference that modulates signal amplitude.[19] In obese patients, increased subcutaneous fat leads to signal attenuation, reducing the intensity of recorded sounds and complicating detection.[29] These issues are addressed by conducting multiple recordings per site, encouraging steady breathing or breath-holding during capture, and selecting optimal patient positions to enhance signal-to-noise ratio without advanced processing.[19]

Analysis and Interpretation

Signal Processing Methods

Signal processing methods for phonocardiogram (PCG) signals begin with pre-processing to enhance signal quality and mitigate artifacts from environmental noise, respiratory sounds, or patient movement. Common techniques include bandpass filtering to isolate relevant frequency components, typically between 20 Hz and 2000 Hz, with high-pass filters applied to emphasize murmurs above 100 Hz while attenuating low-frequency interference like muscle noise or breathing. For instance, a 10th-order Butterworth high-pass filter at 200 Hz has been employed to prepare signals for envelope computation. Envelope detection, often using the Shannon energy or Hilbert transform, accentuates the amplitude modulation of heart sounds, facilitating subsequent segmentation. Normalization, such as z-score or min-max scaling, addresses amplitude variations due to recording conditions or sensor placement, ensuring consistent analysis across signals. These steps improve signal-to-noise ratio (SNR) and are foundational for accurate feature extraction. Time-frequency analysis techniques provide insights into the non-stationary nature of PCG signals, revealing temporal evolution of frequency content essential for distinguishing heart sound components. The short-time Fourier transform (STFT) generates spectrograms by applying a sliding window to the signal, capturing localized frequency information; for example, it has been used in denoising by thresholding low-energy regions in the time-frequency plane to suppress noise while preserving S1 and S2 peaks. Wavelet transforms offer superior multi-resolution analysis: the discrete wavelet transform (DWT) decomposes the signal into approximation and detail coefficients across scales, enabling isolation of low-frequency heart sounds from high-frequency murmurs via thresholding or reconstruction. For more adaptive partitioning, the wavelet packet transform (WPT) extends DWT by further subdividing both low- and high-frequency bands, allowing customized frequency resolution to separate S1/S2 from overlapping noise or murmurs; studies demonstrate its efficacy in enhancing segmentation accuracy in noisy environments. These methods outperform traditional Fourier analysis for transient events in PCG. Feature extraction from processed PCG signals focuses on identifying key temporal and spectral characteristics for clinical interpretation. Onset detection algorithms locate S1 and S2 boundaries, often adapting electrocardiogram techniques like the Pan-Tompkins method, which involves bandpass filtering, differentiation, squaring, and moving-window integration to detect peaks in the envelope; this adaptation has achieved high sensitivity for fetal and adult heart sound segmentation. Heart rate calculation employs autocorrelation to identify periodicities in the signal, computing the lag at which the autocorrelation function peaks to estimate beat intervals, providing robust estimates even in irregular rhythms. Murmur quantification measures duration (time from onset to offset relative to the cardiac cycle) and intensity (peak amplitude or energy within the murmur band), using threshold-based segmentation post-enveloping; these metrics correlate with severity grading, such as Levine's scale, aiding in valvular disease assessment. Recent advancements include deep learning models, such as attention-based transformers, for automated feature extraction and classification of heart sounds and murmurs, achieving high accuracy even in noisy conditions as of 2025.[30] Such features form the basis for automated classification systems. Software tools facilitate implementation of these methods, with open-source libraries enabling reproducible research. The Python-based Librosa library supports audio signal processing tasks like STFT computation, envelope extraction, and feature computation (e.g., zero-crossing rate), commonly integrated into PCG pipelines for its efficient handling of time-frequency transforms. Specialized toolboxes like pyPCG extend this by providing dedicated functions for heart sound segmentation, denoising via wavelets, and onset annotation, promoting standardization in phonocardiography analysis. Custom implementations in MATLAB, leveraging toolboxes such as Wavelet Toolbox for DWT/WPT and Signal Processing Toolbox for filtering, remain prevalent for prototyping and validation in academic settings. These resources lower barriers to digital PCG analysis.[31]

Normal and Abnormal Patterns

In a normal phonocardiogram (PCG), the first heart sound (S1) appears as a biphasic waveform consisting of the mitral (M1) and tricuspid (T1) components, reflecting the closure of the atrioventricular valves at the onset of ventricular systole.[32] The second heart sound (S2) follows as a sharp, high-frequency deflection, often with physiological splitting into aortic (A2) and pulmonic (P2) components during inspiration, marking semilunar valve closure at the end of systole.[10] In healthy adults, third (S3) and fourth (S4) heart sounds are typically absent, as their presence indicates ventricular dysfunction or atrial contraction abnormalities.[10] Temporally, S1 occurs shortly after the QRS complex on a simultaneous electrocardiogram (ECG), while S2 aligns post-T-wave, delineating systole and diastole.[33] Abnormal PCG patterns deviate from these norms through the addition of extraneous sounds or distortions. Systolic murmurs, such as the ejection-type murmur in aortic stenosis, manifest as high-frequency vibrations exceeding 200 Hz between S1 and S2, often with a crescendo-decrescendo contour due to turbulent flow across the stenotic valve.[34] Diastolic murmurs, indicative of conditions such as aortic regurgitation, appear as high-pitched signals following S2, characterized by a decrescendo pattern from regurgitant blood flow.[35] Clicks, like the mid-systolic click in mitral valve prolapse, present as sharp, high-frequency transients midway through systole, resulting from sudden tensing of chordae tendineae.[36] Gallop rhythms arise from prominent S3 (early diastolic, low-frequency rumble in ventricular filling overload) or S4 (presystolic, in atrial contraction against stiff ventricle), altering the normal S1-S2 cadence.[10] Quantitative criteria aid in distinguishing pathological features. Murmurs are graded on the Levine scale from 1/6 (faint, barely audible) to 6/6 (audible without stethoscope, with thrill), based on intensity, where grades 3/6 or higher suggest significant pathology.[35] Frequency spectra differentiate murmurs: harsh systolic murmurs (e.g., aortic stenosis) peak at 200-410 Hz, contrasting with musical or innocent murmurs below 200 Hz and more harmonic structure.[37] Timing metrics, such as S1 duration (70-150 ms) and S2 (60-120 ms), help quantify deviations, with prolonged intervals signaling conduction delays.[38] Interpretation of PCG patterns faces limitations, including overlap with non-cardiac sounds (e.g., respiratory artifacts mimicking low-frequency rumbles) that can obscure cardiac signals.[39] Additionally, accurate diagnosis requires expert correlation with clinical context and complementary tests, as subjective variability in waveform identification persists despite digital enhancements like wavelet processing for pattern delineation.[1]

Clinical Applications

Use in Adult Cardiology

In adult cardiology, phonocardiography (PCG) plays a key role in diagnosing and monitoring valvular heart diseases by graphically recording heart sounds and murmurs, allowing precise characterization of abnormalities that may be subtle on auscultation alone. For valvular stenosis, such as aortic stenosis, PCG reveals a characteristic diamond-shaped systolic murmur that begins shortly after the first heart sound (S1), peaks in mid-systole, and diminishes before the second heart sound (S2), reflecting turbulent flow across the narrowed valve. In regurgitation, like mitral regurgitation, PCG captures a holosystolic murmur extending from S1 to S2, often high-pitched and indicative of backflow; for aortic regurgitation, it shows a high-pitched, decrescendo diastolic murmur starting immediately after S2. These patterns enable non-invasive assessment of valve function, supporting early intervention in acquired conditions prevalent in adults.[40] PCG also aids in identifying congenital and structural heart issues that persist or manifest in adulthood, such as atrial septal defects (ASD) through wide, fixed splitting of S2 due to delayed pulmonic valve closure from right ventricular volume overload, which remains unchanged with respiration.[41] In hypertrophic cardiomyopathy (HCM), PCG frequently detects an S4 gallop, arising from forceful atrial contraction against a stiff ventricle, present in most sinus rhythm cases and correlating with disease severity.[42] These findings help differentiate structural pathologies from other causes of similar symptoms, enhancing diagnostic specificity in adult patients.[40] For monitoring, PCG is valuable post-surgery, such as after valve replacement, where it evaluates residual murmurs, opening snaps, or prosthetic function to confirm successful intervention and detect complications like paravalvular leaks. In heart failure, persistent S3 on PCG signals ventricular dysfunction and poor prognosis, associating with increased hospitalization risk and mortality in coronary artery disease patients.[43] PCG complements echocardiography by providing temporal and frequency details of sounds that imaging may overlook, particularly in inconclusive cases, with strong correlations such as 88% sensitivity for detecting reduced ejection fraction.[5][44] Recent advancements as of 2025 integrate artificial intelligence and machine learning with PCG for automated classification of heart sounds and murmurs, improving diagnostic accuracy in point-of-care settings and enabling ambulatory monitoring via wearable devices.[30][45] Beyond structural assessments, PCG supports surveillance for chemotherapy-induced cardiotoxicity, particularly in breast cancer patients receiving anthracyclines, by detecting early changes in heart sounds indicative of left ventricular dysfunction.[46] It also aids in optimizing cardiac resynchronization therapy (CRT) by guiding atrioventricular delay programming based on phonocardiographic timing of valve closure and systolic intervals.[47] In emergency triage, ultra-sensitive PCG facilitates rapid evaluation of acute chest pain or suspected heart failure in the emergency department, offering a non-invasive tool for initial risk stratification.[48]

Fetal and Pediatric Applications

Fetal phonocardiography (PCG) enables non-invasive assessment of fetal cardiac activity by recording heart sounds through acoustic sensors placed on the maternal abdomen, typically feasible from around 20 weeks of gestation.[21] This technique captures the fetal heart rate, which normally ranges from 120 to 160 beats per minute, and can identify deviations such as arrhythmias or signs of fetal distress, including reduced heart rate variability associated with hypoxia.[49][50][51] Key techniques in fetal PCG involve integrating recordings with Doppler ultrasound for enhanced accuracy in heart rate estimation and applying signal processing methods, such as adaptive filtering or wavelet transforms, to mitigate noise from maternal heart sounds, respiration, and digestive activity.[50][52] In high-risk pregnancies, such as those involving suspected congenital anomalies, fetal PCG facilitates early detection of issues like valvular defects through identification of abnormal murmurs or turbulent flow sounds in the phonocardiographic signal. In pediatric applications, PCG is particularly valuable for evaluating newborns and infants with suspected congenital heart defects, where it detects characteristic murmurs, such as the continuous machinery-like murmur of patent ductus arteriosus (PDA).[53] This approach offers advantages in young infants, where echocardiography may be technically challenging due to small size and mobility, providing a bedside, non-invasive alternative for initial screening.[54] Overall, fetal and pediatric PCG contributes to improved antenatal and postnatal care by enabling continuous, passive monitoring that reduces reliance on more invasive procedures like fetal scalp electrodes.[55] However, limitations persist, including signal attenuation by maternal tissues, which lowers the signal-to-noise ratio and can complicate recordings in obese patients or late gestation.

History and Advancements

Early Development

The origins of phonocardiography trace back to the mid-19th century, building on the invention of the stethoscope by René Laennec in 1816, which first allowed physicians to auscultate heart sounds systematically. Early efforts to record these acoustic phenomena mechanically emerged in the 1860s and 1870s, with physiologists like Étienne-Jules Marey developing tambour-based systems to capture cardiac vibrations alongside pulse tracings, though these were rudimentary and primarily focused on timing heart events relative to mechanical activity. However, true graphical representation of heart sounds awaited technological advances in the late 19th century.[1] A pivotal milestone occurred in 1894 when Dutch physiologist Willem Einthoven, along with his assistant M.A.J. Geluc, pioneered the first electrical graphical recordings of heart sounds using a modified string galvanometer originally designed for electrocardiography. These tracings provided objective visualization of cardiac acoustics, marking the birth of phonocardiography as a distinct diagnostic tool. Einthoven's work emphasized correlating heart sounds with electrical and mechanical cardiac events, laying the foundation for quantitative analysis. Early 20th-century refinements followed, notably Otto Frank's 1904 introduction of optical amplification methods for direct precordial vibration recordings, enhancing fidelity and enabling broader physiological studies.[56][57][3] By the 1920s, commercial phonocardiographs began appearing in Europe, with devices from firms like those influenced by Einthoven's designs facilitating laboratory use. Significant progress in the 1940s came from American researchers M.B. Rappaport and H.B. Sprague, who integrated electronic amplifiers to reduce noise and improve signal clarity; their 1942 publication on recording normal heart sounds established protocols for standardized multi-channel setups, often synchronized with electrocardiograms for precise timing of sounds. These innovations transformed phonocardiography from an experimental curiosity into a viable clinical adjunct.[58] Despite these advances, early analog phonocardiographs suffered from inherent limitations, including susceptibility to acoustic distortion from microphone placement, environmental noise, and mechanical vibrations, which often compromised reproducibility. Confined largely to research until the post-World War II era, adoption in routine clinical practice accelerated in the 1950s as amplifier technology matured and devices like Sanborn's twin-beam models became accessible, bridging the gap to widespread cardiological evaluation.[1][59]

Modern Digital Innovations

The transition to digital phonocardiography in the 1980s marked a significant shift from analog recording to computer-based systems, enabling advanced spectral analysis through techniques like the fast Fourier transform (FFT). These systems allowed for detailed frequency domain processing of heart sounds, improving the identification of murmurs and valve dysfunctions by quantifying spectral distributions in normal and pathological phonocardiograms (PCGs). For instance, early digital implementations facilitated non-invasive assessment of prosthetic heart valve integrity via FFT-based spectral features, enhancing diagnostic precision over traditional auscultation.[60] Portable digital PCG devices emerged prominently in the 2010s, integrating with smartphones to democratize access to high-fidelity heart sound recording. Devices like the Eko digital stethoscopes pair with mobile apps to capture and visualize PCG waveforms alongside electrocardiograms (ECGs), supporting real-time auscultation and data sharing during clinical exams. These innovations, validated in studies showing reliable simultaneous PCG and ECG acquisition, have streamlined workflow in primary care by reducing the need for bulky equipment.[61][62] Advancements in artificial intelligence (AI) and machine learning have revolutionized PCG analysis, particularly through automated classification of heart murmurs using neural networks. Deep learning models, such as convolutional and recurrent architectures, achieve accuracies exceeding 90% in distinguishing innocent from pathological murmurs, often matching or surpassing expert cardiologists in sensitivity and specificity. For example, a recurrent-convolutional neural network applied to PCG signals reported 94.01% overall accuracy across murmur types, while integration with telecardiology platforms enables remote expert review and triage in distributed healthcare networks.[63][64][65] Recent developments up to 2025 include wearable PCG sensors embedded in flexible devices for continuous heart sound monitoring, extending beyond episodic recordings to ambulatory settings. These systems, often combining PCG with ECG and accelerometry, facilitate long-term detection of arrhythmias and structural anomalies through bioelectronic patches or vests, with signal quality comparable to clinical-grade tools. Hybrid AI-driven platforms have also advanced real-time fetal heart rate detection via wearable phonocardiography belts, employing algorithms to filter maternal noise and classify fetal rhythms with high fidelity in remote or home-based monitoring.[66][67][68] These innovations have notably increased PCG adoption in low-resource settings, where echocardiography remains inaccessible due to cost and infrastructure barriers. AI-assisted PCG screening tools offer a low-cost alternative for early congenital heart disease detection in pediatric populations, with meta-analyses confirming pooled sensitivities above 85% for pathological murmurs. Ongoing research into 3D PCG mapping further enhances precise localization of heart sound sources, using microphone arrays and subspace methods to generate spatial acoustic images for valve-specific diagnostics.[69][70][71]

References

User Avatar
No comments yet.