Hubbry Logo
Water distribution systemWater distribution systemMain
Open search
Water distribution system
Community hub
Water distribution system
logo
8 pages, 0 posts
0 subscribers
Be the first to start a discussion here.
Water distribution system
from Wikipedia
An example of a water distribution system: a pumping station, a water tower, water mains, fire hydrants, and service lines[1][2]

A water distribution system is a part of water supply network with components that carry potable water from a centralized treatment plant or wells to consumers to satisfy residential, commercial, industrial and fire fighting requirements.[3][4]

Definitions

[edit]

Water distribution network is the term for the portion of a water distribution system up to the service points of bulk water consumers or demand nodes where many consumers are lumped together.[5] The World Health Organization (WHO) uses the term water transmission system for a network of pipes, generally in a tree-like structure, that is used to convey water from water treatment plants to service reservoirs, and uses the term water distribution system for a network of pipes that generally has a loop structure to supply water from the service reservoirs and balancing reservoirs to consumers.[6]

Components

[edit]
Water main tap

A water distribution system consists of pipelines, storage facilities, pumps, and other accessories.[7]

Pipelines laid within public right of way called water mains are used to transport water within a distribution system. Large diameter water mains called primary feeders are used to connect between water treatment plants and service areas. Secondary feeders are connected between primary feeders and distributors. Distributors are water mains that are located near the water users, which also supply water to individual fire hydrants.[8] A service line is a small diameter pipe used to connect from a water main through a small tap to a water meter at user's location. There is a service valve (also known as curb stop) on the service line located near street curb to shut off water to the user's location.[9]

Storage facilities, or distribution reservoirs, provide clean drinking water storage (after required water treatment process) to ensure the system has enough water to service in response to fluctuating demands (service reservoirs), or to equalize the operating pressure (balancing reservoirs). They can also be temporarily used to serve fire fighting demands during a power outage. The following are types of distribution reservoirs:

  • Underground storage reservoir or covered finished water reservoir: An underground storage facility or large ground-excavated reservoir that is fully covered. The walls and the bottom of these reservoirs may be lined with impermeable materials to prevent ground water intrusion.[10]
  • uncovered finished water reservoir: A large ground-excavated reservoir that has adequate measures or lining to prevent surface water runoff and ground water intrusion but does not have a top cover. This type of reservoir is less desirable as the water will not be further treated before distribution and is susceptible to contaminants such as bird waste, animal and human activities, algal bloom, and airborne deposition.[10]
  • Surface reservoir (also known as ground storage tank and ground storage reservoir): A storage facility built on the ground with the wall lined with concrete, shotcrete, asphalt, or membrane. A surface reservoir is usually covered to prevent contamination. They are typically located in high elevation areas that have enough hydraulic head for distribution. When a surface reservoir at ground level cannot provide a sufficient hydraulic head to the distribution system, booster pumps will be required.[4][11]
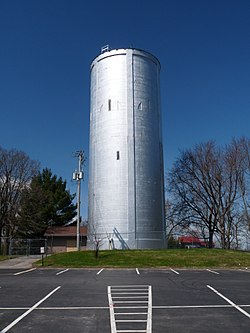
  • Water tower (also known as elevated surface reservoir): An elevated water tank. A few common types are spheroid elevated storage tank, a steel spheroid tank on top of a small-diameter steel column; composite elevated storage tank, a steel tank on a large-diameter concrete column; and hydropillar elevated storage tanks, a steel tank on a large-diameter steel column. The space within the large column below the water tank can be used for other purposes such as multi-story office space and storage space. A main concern for using water towers in the water distribution system is the aesthetic of the area.[11][12]
  • Standpipe: A water tank that is a combination of ground storage tank and water tower. It is slightly different from an elevated water tower in that the standpipe allows water storage from the ground level to the top of the tank. The bottom storage area is called supporting storage, and the upper part which would be at the similar height of an elevated water tower is called useful storage.[4]
  • Sump: This is a contingency water storage facility that is not used to distribute water directly. It is typically built underground in a circular shape with a dome top above ground. The water from a sump will be pumped to a service reservoir when it is needed.[12]

Storage facilities are typically located at the center of the service locations. Being at the central location reduces the length of the water mains to the services locations. This reduces the friction loss when water is transported over a water main.[4]

Topologies

[edit]

In general, a water distribution system can be classified as having a grid, ring, radial or dead end layout.[13]

A grid system follows the general layout of the road grid with water mains and branches connected in rectangles. With this topology, water can be supplied from several directions, allowing water circulation and redundancy if a section of the network has broken down. Drawbacks of this topology include difficulty sizing the system.[13]

A ring system has a water main for each road, and there is a sub-main branched off the main to provide circulation to customers. This topology has some of the advantages of a grid system, but it is easier to determine sizing.[13]

A radial system delivers water into multiple zones. At the center of each zone, water is delivered radially to the customers.[13]

A dead end system has water mains along roads without a rectangular pattern. It is used for communities whose road networks are not regular. As there are no cross-connections between the mains, water can have less circulation and therefore stagnation may be a problem.[13]

System Integrity

[edit]

The integrity of the systems are broken down into physical, hydraulic, and water quality.[3]

Physical integrity includes concerns regarding the ability of the barriers to prevent contamination from external sources into the water distribution system. The deterioration can be caused by physical or chemical factors.[3]

Hydraulic integrity is an ability to maintain adequate water pressure inside the pipes throughout the distribution system. It also includes the circulation and length of time that the water travels within a distribution system, which impacts the effectiveness of disinfectants.[3]

Water quality integrity is the control of degradation as the water travels through a distribution system. The impact of water quality can be caused by physical or hydraulic factors. Water quality degradation can also take place within the distribution system, such as microorganism growth, nitrification, and internal corrosion of the pipes.[3]

Network analysis and optimization

[edit]

Analyses are performed to assist in design, operation, maintenance and optimization of water distribution systems. There are two main types of analyses: hydraulic and water quality behavior as it flows through a water distribution system.[14] Optimizing the design of water distribution networks is a complex task. However, a large number of methods have already been proposed, mainly based on metaheuristics.[15] Employing mathematical optimization techniques can lead to substantial construction savings in these kinds of infrastructures.[16]

Hazards

[edit]

Hazards in water distribution systems can be in the forms of microbial, chemical and physical.[6]

Most microorganisms are harmless within water distribution systems. However, when infectious microorganisms enter the systems, they form biofilms and create microbial hazards to the users. Biofilms are usually formed near the end of the distribution where the water circulation is low. This supports their growth and makes disinfection agents less effective. Common microbial hazards in distribution systems come from contamination of human faecal pathogens and parasites which enter the systems through cross-connections, breaks, water main works, and open storage tanks.[6]

Chemical hazards are those of disinfection by-products, leaching of piping materials and fittings, and water treatment chemicals.[6]

Physical hazards include turbidity of water, odors, colors, scales which are buildups of materials inside the pipes from corrosions, and sediment resuspension.[6]

There are several bodies around the world that create standards to limit hazards in the distribution systems: NSF International in North America; European Committee for Standardization, British Standards Institution and Umweltbundesamt in Europe; Japanese Standards Association in Asia; Standards Australia in Australia; and Brazilian National Standards Organization in Brazil.[6]

Lead service lines

[edit]

Lead contamination in drinking water can be from leaching of lead that was used in old water mains, service lines, pipe joints, plumbing fittings and fixtures. According to WHO, the most significant contributor of lead in water in many countries is the lead service line.[6]

Maintenance

[edit]

Internal corrosion control

[edit]

Water quality can deteriorate due to corrosion of metal pipe surfaces and connections in distribution systems. Pipe corrosion shows in water as color, taste and odor, any of which may cause health concerns.[17]

Health issues relate to releases of trace metals such as lead, copper or cadmium into the water. Lead exposure can cause delays in physical and mental development in children. Long term exposure to copper may cause liver and kidney damage. High or long term exposure of cadmium may cause damage to various organs. Corrosion of iron pipes causes rusty or red water. Corrosion of zinc and iron pipes can cause metallic taste.[17]

Various techniques can be used to control internal corrosion, for example, pH level adjustment, adjustment of carbonate and calcium to create calcium carbonate as a pipe surface coating, and applying a corrosion inhibitor. For example, phosphate products that form films over pipe surfaces is a type of corrosion inhibitor. This reduces the chance of leaching of trace metals from the pipe materials into the water.[18]

Hydrant flushing

[edit]
Fire hydrant flushing rusty water

Hydrant flushing is the scheduled release of water from fire hydrants or special flushing hydrants to purge iron and other mineral deposits from a water main. Another benefit of using fire hydrants for water main flushing is to test whether water is supplied to fire hydrants at adequate pressure for fire fighting. During hydrant flushing, consumers may notice rust color in their water as iron and mineral deposits are stirred up in the process.[19]

Water main renewals

[edit]

After water mains are in service for a long time, there will be deterioration in structural, water quality, and hydraulic performance. Structural deterioration may be caused by many factors. Metal-based pipes develop internal and external corrosion, causing the pipe walls to thin or degrade. They can eventually leak or burst. Cement-based pipes are subject to cement matrix and reinforced steel deterioration. All pipes are subject to joint failures. Water quality deterioration includes scaling, sedimentation, and biofilm formation. Scaling is the formation of hard deposits on the interior wall of pipes. This can be a by-product of pipe corrosion combined with calcium in the water, which is called tuberculation. Sedimentation is when solids settle within the pipes, usually at recesses between scaling build-ups. When there is a change in the velocity of water flow (such as sudden use of a fire hydrant), the settled solids will be stirred up, causing water to be discolored. Biofilms can develop in highly scaled and thus rough-surfaced pipes where bacteria are allowed to grow, as the higher the roughness of the interior wall, the harder it is for disinfectant to kill the bacteria on the surface of the pipe wall. Hydraulic deterioration that affects pressures and flows can be a result of other deterioration that obstructs the water flow.[20]

When it is time for water main renewal, there are many considerations in choosing the method of renewal. This can be open-trench replacement or one of the pipeline rehabilitation methods. A few pipeline rehabilitation methods are pipe bursting, sliplining, and pipe lining.[20]

When an in-situ rehabilitation method is used, one benefit is the lower cost, as there is no need to excavate along the entire water main pipeline. Only small pits are excavated to access the existing water main. The unavailability of the water main during the rehabilitation, however, requires building a temporary water bypass system to serve as the water main in the affected area.[21] A temporary water bypass system (known as temporary bypass piping[22]) should be carefully designed to ensure an adequate water supply to the customers in the project area. Water is taken from a feed hydrant into a temporary pipe. When the pipe crosses a driveway or a road, a cover or a cold patch should be put in place to allow cars to cross the temporary pipe. Temporary service connections to homes can be made to the temporary pipe. Among many ways to make a temporary connection, a common one is to connect the temporary service connection to a garden hose. The temporary pipe should also add temporary fire hydrants for fire protection.[23]

As water main work can disturb lead service lines, which can result in elevated lead levels in drinking water, it is recommended that when a water utility plans a water main renewal project, it should work with property owners to replace lead service lines as part of the project.[24]

See also

[edit]

References

[edit]
Revisions and contributorsEdit on WikipediaRead on Wikipedia
from Grokipedia
A water distribution system consists of a network of , pumps, valves, storage tanks, reservoirs, meters, and hydrants that transports treated potable from purification facilities or raw sources to consumers, maintaining required , flow rates, and for domestic, industrial, and purposes. These systems represent the bulk of in water utilities, connecting treatment plants to end-users while providing against disruptions and enabling flow capacities often exceeding normal demand by factors of 10 or more. Essential for urban development since ancient aqueducts, modern iterations evolved with pressurized piping in the to support high-density populations, though they face persistent challenges from , leaks averaging 10-20% unaccounted-for water in many U.S. systems, and vulnerabilities to microbial regrowth or chemical leaching from legacy materials like lead service lines.

Definitions and Fundamentals

Core Definitions

A water distribution system consists of the and appurtenances that convey treated potable from production facilities, such as treatment plants or wells, to consumers while maintaining adequate pressure, flow rates, and quality for domestic, commercial, industrial, and firefighting uses. These systems typically include a network of pipelines, storage facilities, pumps, valves, meters, hydrants, and service connections designed to minimize losses and ensure reliability. Transmission mains are large-diameter pipes, often 12 inches or greater, that transport bulk water volumes over long distances from sources or treatment plants to intermediate storage or primary distribution points, operating under higher pressures to overcome elevation changes and friction losses. Distribution mains, smaller than transmission lines but still sizable (typically 6 to 12 inches), form the branching network within urban or suburban areas to deliver water to neighborhoods or zones, balancing supply demands with hydraulic efficiency. Service lines, or laterals, connect mains to individual customer meters or buildings, usually ranging from 3/4 to 2 inches in diameter, and include corporation stops, curb valves, and meter installations to isolate user connections. Storage reservoirs and tanks maintain system , equalize peak demands against average supply rates, and provide reserves for emergencies or fire flow, categorized as elevated tanks for feed, ground-level covered reservoirs, or standpipes depending on and capacity needs. Pumps, often centrifugal types stationed at booster or lift facilities, compensate for head losses and elevate to higher elevations, ensuring minimum pressures of 20 to 40 psi at service connections under normal conditions. Valves, including gate, check, and pressure-reducing types, control flow direction, isolate sections for maintenance, and regulate pressures to prevent surges or leaks. Fire hydrants serve as outlets for high-volume flows during emergencies, typically spaced 300 to 500 feet apart in grids to achieve response times under 5 minutes.

Scale and Global Importance

Water distribution systems form one of the most extensive engineered infrastructures globally, delivering potable to urban and rural populations through networks of , storage facilities, and treatment connections. As of , approximately 73% of the world's , or about 5.8 billion people out of an estimated 8 billion, had access to safely managed services, which predominantly rely on piped systems located on premises and protected from . These systems vary widely in scale, with developed nations maintaining networks often exceeding millions of kilometers per country—for instance, individual large cities or regions feature tens of thousands of kilometers of piping—while global totals remain unaggregated but underpin daily water needs for billions. The global importance of these systems lies in their role as a foundational safeguard, preventing widespread waterborne diseases such as , , , , and typhoid, which are transmitted through contaminated supplies lacking reliable distribution. Effective distribution mitigates intrusion risks from deteriorating , which can elevate entry and gastrointestinal illness rates estimated at 15-50% attributable to distribution issues in vulnerable networks. Economically, robust systems support , , industry, and overall growth by enabling reliable supply; underinvestment contributes to productivity losses, with global needs projected at up to $7 trillion by 2030 to meet and avert crises affecting 2 billion without safe access. Challenges persist due to aging prone to breaks and , particularly in low-income regions where only partial coverage exacerbates inequities, yet expansions from to added access for 961 million, raising safely managed coverage to 74%. Prioritizing and expansion is causal to reducing burdens and unlocking economic potential, as reliable distribution directly correlates with lower disease incidence and higher societal productivity.

Historical Evolution

Ancient Origins to Pre-Industrial Systems

The earliest known urban water distribution systems emerged in the Indus Valley Civilization around 2500 BCE, where cities like featured a network of approximately 700 wells supplying fresh water to both private households and public facilities such as the , a large public pool measuring 12 meters by 7 meters. These systems relied on deep, brick-lined wells and covered drains to convey water and , demonstrating centralized planning for potable supply and in a population of tens of thousands, though primarily gravity-based without pressurized pipes. In the on during the (circa 2000–1450 BCE), water distribution advanced with terracotta pipes, cisterns for , and spring-fed channels delivering to palaces like , where drainage systems included sloped conduits and settling tanks to manage flow and sediment. These technologies supported multi-story buildings with running for bathing and flushing, using gravity to transport from sources up to several kilometers away, marking an early integration of collection, storage, and conveyance in arid Mediterranean conditions. Ancient Persian engineers developed qanats by around 700 BCE, subterranean tunnels tapping aquifers and channeling via gravity over distances up to 70 kilometers with minimal evaporation, supplying oases and cities during the and later refined in the (8th–13th centuries CE). This passive system, featuring vertical shafts for maintenance, enabled sustainable distribution in hyper-arid regions, influencing water management from to and , where it supported urban growth without surface aqueducts. The Romans achieved the most extensive pre-industrial networks, constructing 11 aqueducts between 312 BCE and 226 CE to supply with up to 1 million cubic meters of water daily, serving over 1 million inhabitants through a combination of open channels, covered conduits, and lead pipes distributing to public fountains, , and private villas. The Aqua Appia (312 BCE), Rome's first, spanned 16 kilometers mostly underground, while later systems like the (completed 52 CE) reached 69 kilometers with elevated arcades crossing valleys, prioritizing gravity flow at gradients as low as 1:5000 to maintain pressure and quality. In ancient , systems like the irrigation project (initiated 256 BCE) diverted rivers via weirs and channels to distribute water across 5,300 square kilometers, while urban examples in Pingliangtai (circa 2000 BCE) used interconnected ceramic pipes for drainage and supply, though urban potable distribution remained localized via wells and canals until (206 BCE–220 CE) enhancements in integrated river intakes with conduits for imperial and residential use. These gravity-reliant setups focused on flood control and agriculture but laid foundations for later urban conveyance. Following the fall of , European distribution regressed to wells, rivers, and rudimentary conduits, with medieval cities like sourcing water from distant springs via wooden pipes (e.g., Tyburn system supplying by the 13th century), limited to elite or public fountains due to contamination risks and maintenance challenges. In contrast, Islamic engineers during the expanded qanats and built surface aqueducts, such as those in (10th century), combining Persian subsurface tech with Roman-inspired arches to convey spring water to reservoirs and mosques, sustaining populations in arid zones through precise and anti-siltation designs. Pre-industrial systems globally thus emphasized gravity conveyance from natural sources, with pipes and channels scaling to urban demands only where and permitted, often prioritizing public over private access to mitigate and disease.

Industrial Era Advancements

The , spanning roughly from the mid-18th to late , drove transformative changes in water distribution due to explosive urban growth and factory demands, shifting systems from localized, gravity-reliant setups to pressurized, centralized networks serving millions. In Britain, where industrialization began earliest, cities like saw population surges from under 1 million in 1800 to over 6.5 million by 1900, overwhelming traditional sources and necessitating robust infrastructure to deliver potable water amid rising contamination from and industry. Engineers prioritized scalable materials and mechanical pumping to maintain flow under pressure, enabling distribution over distances exceeding prior limits of wooden or lead pipes, which often leaked or burst under load. This era marked the transition to engineered mains capable of withstanding 50-100 psi, far beyond ancient aqueducts' reliance on . Cast-iron pipes emerged as a cornerstone advancement, offering superior tensile strength and resistance compared to wooden logs or lead, which degraded rapidly in acidic or pressurized conditions. Though prototyped as early as 1455 in for sporadic use, systematic adoption accelerated post-1664 with the Versailles installation—the first full-scale cast-iron system—paving the way for industrial scalability. By 1746, London's Chelsea Water Works laid extensive cast-iron mains from the Thames, spanning miles and reducing breakage rates that plagued earlier materials; production scaled via sand-molding techniques, yielding pipes up to 48 inches in diameter by the 1820s. In the United States, installed cast-iron replacements for deteriorated spruce logs in the 1810s, while New York followed in 1799, with networks expanding to 100 miles of mains by mid-century. These pipes' longevity—often exceeding 100 years—facilitated branching topologies, though joints remained a vulnerability until flanged designs improved sealing. Steam-powered pumping revolutionized elevation and volume constraints, supplanting water wheels and manual lifts with reliable, high-capacity engines. Thomas Newcomen's 1712 atmospheric engine, initially for mine dewatering, adapted for urban supply by condensing to create vacuum-driven pistons lifting 10-20 gallons per stroke; James Watt's 1769 refinements boosted efficiency to 5-10 times, consuming less coal while delivering 1,000-2,000 gallons per minute. London's private water companies, such as the Grand Junction Waterworks established in 1815, deployed multiple Watt engines to pump 20-30 million gallons daily from Thames intakes to service reservoirs, distributing via cast-iron grids to households and industries. By the 1830s, over a dozen such firms operated in the metropolis, with steam stations like those of the Southwark Company achieving heads of 100-150 feet, enabling multi-story building supplies previously unfeasible. This , though fuel-intensive, causal enabled industrial output by ensuring consistent pressure, though early systems suffered intermittent supply until storage tanks buffered demand.

20th Century Standardization and Expansion

In the early 20th century, standardization of water distribution systems advanced through the establishment of uniform specifications for materials and construction practices, addressing inconsistencies in prior ad hoc designs. The American Water Works Association (AWWA) played a central role, adopting its inaugural standard in 1908 for cast-iron pipe and special castings, which specified dimensions, testing, and quality for bell-and-spigot pit-cast pipes used in mains. Cast iron became the predominant material for its longevity—often exceeding 100 years—and corrosion resistance when coated, while reinforced concrete and steel emerged for larger transmission mains to handle higher pressures and spans. These standards facilitated interoperability and reliability, reducing failure rates in expanding urban grids. Complementary guidelines for disinfection, such as those formalized later under AWWA C651, ensured pathogen control during installation and maintenance. Expansion accelerated amid rapid and crises, with over 3,000 public water systems operational by 1900, primarily serving cities through local gravity-fed or pumped networks. advancements, including rapid sand filters with from the 1910s, and widespread chlorination starting in 1915, drastically cut waterborne diseases like typhoid—reducing incidence nearly 100-fold by the 1940s compared to 1910 levels—enabling safer, broader distribution without frequent boil advisories. Urban coverage neared universality by the , with typhoid death rates dropping from 40 per 100,000 in large cities around 1900 to about 2 per 100,000 by 1920, attributable to extended piping and treatment integration. Federal oversight began with the U.S. Service's 1914 bacteriological standards, promoting consistent quality across systems. Mid-century shifts introduced in the 1940s, a magnesium-treated variant of offering superior flexibility and impact resistance for seismic-prone or trenched installations, with AWWA standard C151 issued in 1965 to codify manufacturing requirements like minimum wall thicknesses for pressure classes. Post-World War II suburbanization drove massive infrastructure growth, extending mains to new developments and incorporating elevated storage tanks for pressure regulation; community water systems proliferated to serve dispersed , reflecting a transition from dense urban cores to regional networks. By 1950, these expansions had integrated pumping and larger reservoirs, supporting industrial and residential demands amid booms, though aging cast-iron legacies from early builds began surfacing challenges.

Core Components

Pipes, Materials, and Fittings

Pipes in water distribution systems transport treated water from sources to consumers, typically buried underground to protect against damage and . Common diameters for urban water mains range from 6 to 16 inches, while service lines to individual properties are usually ¾ to 1 inch in diameter. Materials selection prioritizes durability, corrosion resistance, hydraulic efficiency, and compliance with standards such as those from the (AWWA). Ductile iron pipes, often cement-lined for protection, dominate large-diameter mains due to their high strength and ability to withstand external loads and internal pressures up to 350 psi. (HDPE) pipes, standardized under AWWA C901 for service lines with PE4710 material, offer flexibility, joint integrity, and resistance to , making them suitable for trenchless installation and areas prone to ground movement. Polyvinyl chloride (PVC) pipes provide lightweight construction and low friction for smoother flow, but their rigidity limits use in high-load or seismic zones. pipes, reinforced and coated, serve high-pressure transmission lines, while cylinder pipes handle diameters over 24 inches in stable soils.
MaterialAdvantagesDisadvantagesCommon Applications
Ductile IronHigh tensile strength, impact resistance, longevity over 100 years with proper liningSusceptible to without coatings, heavier weight increases installation costsPrimary mains in urban areas
HDPE-proof, flexible for earthquake-prone areas, fusion-welded joints prevent leaksLower requires support, potential for by organicsService lines, repairs, flexible networks
PVCLow cost, smooth interior reduces pumping energy, easy handlingBrittle under impact or freeze-thaw cycles, limited pressure ratingsSecondary distribution in low-risk soils
Weldable for custom lengths, capacityProne to external unless protected, higher Transmission mains, industrial feeds
Fittings connect, branch, or transition pipes, ensuring leak-free assembly under . Common types include elbows for direction changes, tees and wyes for branching, reducers for diameter shifts, couplings for jointing, and flanges for bolted connections. Materials match pipe types—ductile iron or for mains, PVC or HDPE for plastics—with NSF/ANSI 61 certification required for potable contact to limit leaching. Joints employ mechanical sleeves, rubber , or welds to accommodate expansion and settlement. Saddle taps, used for service connections on mains, minimize disruption by clamping onto existing pipes without full excavation.

Pumps, Storage, and Valves

Centrifugal pumps predominate in water distribution systems for their ability to handle high flow rates at moderate pressures, imparting to water via rotation to overcome pipe and elevation differences. Positive displacement pumps, such as or gear types, serve niche roles like low-flow, high-pressure applications in booster stations or where precise metering is required, though they are less common due to higher maintenance needs compared to centrifugal designs. Booster pumps specifically address pressure deficiencies in extended networks, operating in parallel or series to maintain minimum service pressures typically between 20 and 80 psi, as dictated by hydraulic modeling to prevent supply disruptions. Storage facilities in distribution systems accumulate treated water to mitigate diurnal variations, which can fluctuate by factors of 2 to 3 times average rates during peak hours, ensuring steady supply from treatment plants operating at constant capacity. Elevated tanks and standpipes convert stored volume into gravitational head, providing passive augmentation—often 30 to 100 feet of head equivalent—reducing reliance on continuous pumping and enabling gravity-fed delivery in flat terrains. Ground-level reservoirs, frequently covered to minimize , support fire flow reserves equivalent to 1,000 to 5,000 gallons per minute for durations of 2 to 4 hours, while also buffering against power outages by decoupling supply from immediate . Valves manage hydraulic flow dynamics by isolating pipeline segments for repairs, throttling rates to balance pressures, and averting reverse flows that could compromise . Gate valves, with their mechanisms, enable full-open or shutoff isolation in mains up to 48 inches in diameter, minimizing head loss when fully retracted, whereas butterfly valves offer quarter-turn operation for quicker control in smaller lines under AWWA C504 standards. Check valves enforce unidirectional flow to protect pumps from backspin damage, and air release valves expel accumulated gases to sustain pipe efficiency and prevent water hammer surges exceeding 1.5 times operating pressure. Strategic valve placement, often at 500- to 1,000-foot intervals in grids, limits outage zones during maintenance to under 10% of serviced area.

Meters, Hydrants, and Service Connections

Service connections link the water distribution main to individual customer premises, typically comprising a corporation cock tapped into the main, a service line pipe, and a curb or shutoff at the property boundary. These connections are sized based on anticipated demand, with minimum diameters of 3/4 inch (19.1 mm) for residential services to ensure adequate flow. Materials commonly include Type K soft copper tubing for lines up to 2 inches, (HDPE), or other lead-free options compliant with standards, as galvanized steel or lead-containing lines pose corrosion and risks. Under the EPA's Lead and Copper Rule Revisions (LCRR) finalized in 2021, public water systems must inventory all service line materials by October 16, 2024, categorizing them as lead, galvanized requiring replacement, non-lead, or unknown, with mandatory replacement of lead lines by 2037 to mitigate leaching into potable water. Installation requires separation from sewers (typically 10 feet horizontal) and backflow prevention to avoid . Water meters, positioned downstream of the curb at the property line or in pits for accessibility, quantify volumetric flow for accurate billing, , and . Positive displacement meters, dominant in residential applications (e.g., 5/8-inch sizes for most installations), function by trapping and displacing fixed volumes of via oscillating pistons or nutating discs, achieving accuracies of ±1.5% over a wide flow range. Velocity-based types, such as single- or multi-jet impellers for moderate flows or /ultrasonic for large commercial lines (2 inches and above), infer volume from flow speed, suiting high-volume distribution needs but requiring periodic to counter wear. Compound meters combine displacement and velocity mechanisms for variable flows, while advanced metering (AMI) enables remote reading and for operational efficiency. AWWA Manual M6 outlines selection criteria, emphasizing meter sizing to avoid excessive velocities (e.g., under 10 ft/s) that accelerate . Fire hydrants serve as valved outlets on mains for emergency flows (typically 500–1,500 gpm at 20 psi residual), routine flushing to control , and maintenance access. Dry-barrel designs, prevalent in freeze-prone areas, isolate the upper barrel from supply via a post-indicator and drain to prevent damage, conforming to AWWA C502 standards for 250 psi working and traffic-rated bonnets. Wet-barrel variants, used in milder climates, maintain in all outlets for instant flow but risk freezing. Installation per AWWA M17 requires 6-inch minimum bury depth for the connection, auxiliary drains, and spacing of 300–500 feet in urban grids to meet NFPA fire flow demands, with annual flow testing to verify performance (e.g., pitot gauge measurements). Hydrants facilitate dead-end flushing at 2.5 ft/s minimum to scour sediments, though improper operation can dislodge particulates, temporarily degrading downstream quality.

Design and Topologies

Network Topology Types

Water distribution network topologies refer to the structural arrangements of , junctions, and connections that determine flow paths, , and hydraulic performance. These topologies are designed to balance factors such as water quality maintenance, pressure uniformity, reliability against failures, and construction costs. Common classifications include dead-end, grid iron, ring, and radial systems, each suited to specific urban patterns and demands./01:_Chapters/1.04:_System_Design) The dead-end system, also known as a or branched layout, features a single main supply line from the source that branches into smaller pipes without forming loops, terminating at dead ends. This topology is simplest and least expensive to install, often used in irregularly shaped or older towns with low demand variability. However, it leads to stagnation at endpoints, increasing risks of degradation from buildup and , and causes pressure drops at extremities during peak use, potentially failing fire flow requirements. In contrast, the grid iron system employs interconnected mains forming a rectangular with multiple parallel and pipes, allowing alternative flow paths. This looped structure enhances reliability by providing ; a pipe failure or maintenance shutdown minimally impacts supply, as water reroutes through the network. It maintains more uniform pressure and reduces stagnation, making it ideal for modern, rectangularly planned cities with high-density demand and needs, though it incurs higher initial costs due to extensive piping. Systems like those in many U.S. urban areas exemplify this, where grid layouts support pressures of 20-80 psi across zones./01:_Chapters/1.04:_System_Design) The encircles a with a closed loop main fed from multiple points, distributing via radial branches inward. It offers good pressure equalization and within the loop, minimizing dead ends and stagnation while being cost-effective for compact, irregularly shaped areas. Suitable for towns or zones around a central source, it performs well under balanced loads but can experience uneven flows if inflows are imbalanced. The radial system radiates pipes outward from a central elevated or to peripheral mains, mimicking spokes on a . This gravity-assisted layout excels in circular or radial urban expansions, delivering high initial pressures with minimal head loss in straight paths and low pipe volumes. It suits areas with a dominant central source but lacks redundancy, similar to dead-end systems, making it vulnerable to source failures or peripheral low pressures. Examples include early 20th-century designs in planned communities. Hybrid topologies combining elements of these types are increasingly common in large to optimize for specific constraints, such as terrain or growth projections, often analyzed via for connectivity and resilience metrics like or clustering coefficients. Grid iron remains predominant in developed regions for its superior hydraulic equity and , as evidenced by resilience studies showing looped withstand up to 20% more link failures than tree-like ones.

Hydraulic Design Principles

Hydraulic design principles govern the sizing, layout, and operation of water distribution networks to ensure reliable delivery of at adequate pressures and volumes while minimizing dissipation and infrastructure costs. These principles derive from fundamental , including () and ( adapted for ), which dictate that flows must balance demands without excessive pressure drops. processes prioritize peak demands, such as maximum hourly usage or flows, often requiring residual pressures of at least 20 psi (138 kPa) at the most remote or elevated service connections to maintain functionality. Pipe sizing relies on constraining velocities to prevent hydraulic inefficiencies: maximum velocities are typically limited to 5 ft/s (1.5 m/s) during average or peak flows to avoid , , and accelerated from erosion-corrosion, while minimum velocities of 1-2 ft/s (0.3-0.6 m/s) promote self-cleaning by suspending sediments. Head losses, primarily frictional, are quantified using the Hazen-Williams equation for pressurized water flows in full pipes: V=0.85ChR0.63S0.54V = 0.85 C_h R^{0.63} S^{0.54}, where VV is in ft/s, ChC_h is the (e.g., 130 for new , decreasing with age), RR is the hydraulic radius in ft, and SS is the energy slope (head loss per unit length). This , validated for Reynolds numbers typical of municipal systems (turbulent, Re > 10^5), allows iterative sizing to meet constraints, with pressure drops computed as hf=10.67LQ1.852Ch1.852D4.87h_f = \frac{10.67 L Q^{1.852}}{C_h^{1.852} D^{4.87}} in ft, where LL is length, QQ is flow in gpm, and DD is diameter in inches. Network incorporate looped topologies to equalize pressures and provide , analyzed via steady-state or extended-period models that simulate diurnal demand variations (e.g., peaking factors of 1.5-3.0 times average daily demand). Minor losses from fittings and valves are added using equivalent methods or loss coefficients, ensuring supports pump curves without (NPSH > ). Fire flow requirements, per standards like those from the , demand instantaneous flows of 500-2500 gpm at 20 psi residual, influencing trunk main capacities in high-value districts. Optimization balances against operational energy, often yielding C-values of 100-120 for conservative 50-year designs accounting for and tuberculation.

Optimization Techniques

Optimization techniques in water distribution systems seek to minimize construction, operational, and maintenance costs while ensuring hydraulic reliability, adequate , and minimal losses. These methods typically involve mathematical modeling of network , often using software like for simulation, combined with algorithms to solve multi-objective problems such as pipe sizing, pump operation, and rehabilitation planning. Empirical studies demonstrate that optimization can reduce energy costs by 10-30% through refined pump schedules and management, though real-world implementation requires accounting for uncertainties like demand variability and pipe degradation. Design optimization focuses on selecting pipe diameters, materials, and topologies to meet demand at minimal capital cost under hydraulic constraints. Genetic algorithms (GAs) and (DE) are widely applied, evolving solutions from initial populations to converge on near-optimal configurations; for instance, DE with scale factor 0.6 and crossover rate 0.5 has optimized benchmark networks like , reducing costs by up to 20% compared to traditional trial-and-error methods. (NLP) complements these for smooth objective functions, as in minimizing total network cost subject to head loss equations derived from Darcy-Weisbach principles. Multi-objective formulations balance cost against resilience, using Pareto fronts to evaluate trade-offs under scenarios like pipe failures. Operational optimization, particularly pump scheduling, addresses energy efficiency by determining on/off cycles or speeds to match diurnal demand patterns while minimizing electricity tariffs. Linear programming (LP) models discretize time horizons into intervals, optimizing flows and heads to cut costs by shifting loads to off-peak periods, with reported savings of 15-25% in urban networks. Advanced approaches employ metaheuristics like simulated annealing-variable neighborhood search (SA-VNS) hybrids or (e.g., proximal policy optimization), which handle nonlinear pump curves and real-time uncertainties, achieving up to 18% energy reductions in simulated systems. Pressure-reducing valve placement optimization uses similar algorithms to minimize leaks, targeting minimum night flows. Leak detection and reduction optimization involves placement and model calibration to localize anomalies. Graph-based and multilayer network analysis detect multiple leaks by analyzing transients, improving localization accuracy to within 10-20 meters in field tests. Genetic algorithms optimize locations for coverage, as in GA-Sense frameworks that enhance detection probability while minimizing hardware costs. Adjustable under uncertainty quantifies risks from leaks or demand errors, yielding strategies that maintain service levels with 5-15% lower operational variance. These techniques integrate with systems for real-time adjustments, though efficacy depends on and model fidelity.

Operations and Governance

Public versus Private Management Models

Public management models for water distribution systems typically involve municipally owned utilities operated by local governments or public authorities, emphasizing universal access, subsidized pricing, and oversight through political processes rather than profit motives. These systems predominate in the United States, where approximately 85% of water utilities are publicly owned, often resulting in lower average residential water rates but potential inefficiencies from bureaucratic inertia and underinvestment due to reliance on tax revenues or bonds constrained by voter approval. Empirical analyses indicate that public utilities exhibit comparable operational efficiency to private ones in metrics like energy use per unit of water delivered, challenging assumptions of inherent public sector waste. Private management encompasses full , concessions, or public-private partnerships (PPPs), where for-profit entities handle operations, maintenance, and sometimes infrastructure investment under regulatory contracts. In , private concessions cover over 70% of the population and have demonstrated higher productivity in water companies compared to fully public or private models elsewhere, attributed to competitive and performance-based incentives. The United Kingdom's 1989 privatization of 10 regional water companies facilitated £130 billion in investments by 2020, achieving full compliance with drinking water standards and reducing serious incidents by 99% from pre-privatization levels, though household bills rose 40% above inflation-adjusted baselines amid shareholder dividends exceeding £70 billion. Comparisons reveal no systematic superiority of private over in overall or across global datasets; meta-reviews of 100+ studies find private utilities neither consistently outperform nor underperform publics in leakage reduction, coverage expansion, or recovery, with outcomes hinging on regulatory stringency rather than per se. Private models often correlate with 10-20% higher water prices in the U.S., exacerbating affordability issues for low-income households, as regression analyses control for size and density. World Bank evaluations of PPPs in developing regions highlight gains in billing collection rates (up to 20-30% improvements in ) and infrastructure upgrades but note failures where weak regulation led to service disruptions or hikes without proportional quality gains. Recent econometric evidence from U.S. privatizations suggests quality enhancements, such as reduced contamination violations, but at the expense of for vulnerable populations. Causal factors include private operators' access to lower-cost capital markets, enabling rapid capex scaling, versus public utilities' higher funding costs from political risk premiums; however, transaction costs in contracting and monitoring private entities can offset these advantages if oversight lapses. In contexts of , private incentives align with efficiency only under robust price caps and penalties, as evidenced by France's delegated yielding sustained absent in less-regulated full privatizations. Public models mitigate equity risks through cross-subsidies but face principal-agent distortions, where managers prioritize short-term political goals over long-term asset renewal, contributing to deferred maintenance in aging U.S. systems averaging 50+ years old. Hybrid PPPs emerge as pragmatic compromises, balancing private expertise with public accountability, though empirical success varies by institutional capacity.

Daily Operational Protocols

Daily operational protocols for water distribution systems focus on maintaining water quality, hydraulic integrity, and infrastructure reliability through systematic monitoring and minor interventions. These activities prevent contamination, pressure deficiencies, and service disruptions, with frequencies adjusted based on system size, source classification, and regulatory requirements such as those under the . Water quality monitoring constitutes a core daily task, particularly tracking disinfectant residuals like chlorine at the treatment discharge and multiple distribution points to sustain levels between 0.2–4.0 mg/L and reach system extremities. For smaller or groundwater-sourced systems (e.g., Class D or E), residuals are recorded 2–5 days per week at discharge with periodic distribution verification, escalating to continuous logging for surface water systems (Class A). Operators also log fluoride concentrations (0.7–1.2 mg/L standard) at up to six sites and address any deviations prompting immediate corrective actions, such as boosting disinfection. Continuous or automated sampling at reservoir outlets and critical zones detects turbidity spikes or microbial risks early. Hydraulic parameters receive daily scrutiny to uphold pressures between 24–90 meters head at critical nodes, including , zones, and high-elevation endpoints, avoiding surges or negatives that could draw in contaminants. This involves recording levels (up to four tanks), run times, and flow rates at sources or district meter areas via or manual gauges, with valve settings verified to prevent imbalances. Production volumes and chemical usage (e.g., dosing) are tallied against metered output to flag inefficiencies. Routine inspections encompass visual checks of accessible infrastructure, including pipelines, standpipes, pumps, pipework, and reservoir exteriors for leaks, , or tampering, alongside patrols of fences, locks, and alarms. Booster pumps and chemical feed equipment are examined for functionality, with prompt lubrication or adjustments. Isolation valves may be slowly operated (over 10 minutes) for minor adjustments, logged to track usage and avert water hammer. Consumer complaints trigger targeted verifications, integrating into via sounding or minimum night flow analysis during low-demand periods. Flushing protocols, while often scheduled weekly or monthly, incorporate daily opportunistic hydrant or dead-end main rinses to scour sediments and biofilms, especially in low-velocity zones, maintaining velocities above 0.3 m/s where feasible. All actions feed into logged records, enabling trend analysis for and reporting.

Economic and Pricing Considerations

Capital expenditures (CAPEX) in water distribution systems primarily cover the construction and installation of pipelines, pumps, valves, storage reservoirs, and associated , often accounting for the bulk of initial investments in new or expanded networks. Operational expenditures (OPEX), which include for pumping, labor, , and chemical treatments, typically represent around 58% of total costs for water utilities over multi-year horizons, driven by ongoing demands for reliable service delivery. These costs are influenced by factors such as network scale, material choices, and geographic conditions, with pumping stations offering key opportunities for OPEX reduction through efficiency improvements. Pricing mechanisms for water services seek to recover full costs—including CAPEX depreciation, OPEX, and debt servicing—while incentivizing conservation and equitable access. Full cost ensures coverage of operational, , and capital needs, often implemented via rate structures that avoid subsidization shortfalls leading to deferred investments. Two-part tariffs, featuring a fixed connection fee alongside volumetric charges, reflect the split between invariant costs and variable supply expenses, promoting without distorting usage signals. Increasing block rates, where marginal prices rise with consumption tiers, have been adopted by utilities to curb and align revenues with resource , though their effectiveness depends on accurate demand elasticity estimates. Non-revenue water (NRW), encompassing physical leaks, metering inaccuracies, and unauthorized consumption, erodes economic performance by diminishing billable volumes and inflating treatment, pumping, and repair outlays. Globally, NRW levels can exceed 20-40% in under-managed systems, translating to direct losses equivalent to billions in forgone annually and straining solvency through unrecovered variable costs. Mitigation strategies, such as advanced and pressure management, yield positive net present values by extending asset life and reducing energy demands, underscoring NRW as a primary target for enhancing overall system economics.

System Integrity and Monitoring

Pressure and Flow Management

Pressure management in water distribution systems entails regulating hydraulic pressures to ensure sufficient delivery to consumers and fire hydrants while minimizing leakage and pipe stress. Adequate minimum pressures, typically 20-40 psi at service connections depending on and local standards, prevent service interruptions, whereas maximum pressures are capped to avoid bursts, often below 100-150 psi to reduce losses. Excessive pressures accelerate pipe failures and background leakage, which can constitute 10-30% of total supply in unoptimized networks, whereas deficient pressures risk via or negative transients. Key techniques include the network into districts managed by booster pumps or pressure reducing valves (PRVs), which throttle flows to maintain setpoint pressures downstream. PRVs, often float- or pilot-operated, can reduce average zone pressures by 20-50%, yielding leakage reductions of up to 30% without compromising supply reliability, as demonstrated in field implementations. Booster stations employ variable-speed pumps to match diurnal demand peaks, typically rising 20-50% above base loads from 6-9 AM and evenings, ensuring hydraulic gradients align with . Surge protection via air valves or relief devices mitigates transients from pump startups or valve closures, which can drop pressures below zero and induce column separation. Flow management complements pressure control through throttling valves, flow meters, and district metering areas (DMAs) that isolate subnetworks for precise balancing. Butterfly or gate valves modulate flows during peak demands, while ultrasonic or electromagnetic meters quantify demands at nodes, enabling operators to detect anomalies like bursts exceeding 10-20% of average flows. Hydraulic modeling software simulates extended-period demands, optimizing valve settings and pump schedules to minimize energy use—often 1-3 kWh per cubic meter—and excess pressures, with real-time SCADA integration allowing adaptive control based on sensor data from strategic points. In practice, such optimizations have achieved 15-25% reductions in operational costs by aligning supply with measured consumption patterns.

Leak Detection and Non-Revenue Water Reduction

Non-revenue water (NRW) encompasses water volumes produced by a but not billed to customers, comprising real losses from physical leaks and bursts in pipes, reservoirs, and service connections, as well as apparent losses from metering inaccuracies, unauthorized consumption, and handling errors. Globally, NRW volumes reach approximately 346 million cubic meters per day, equivalent to 126 billion cubic meters annually, representing an average loss rate of about 40% in many systems, with economic costs exceeding $39 billion yearly based on conservative pricing. These losses strain , inflate operational costs, and reduce system efficiency, particularly in aging where pipe deterioration accelerates leakage due to and material . Leak detection relies on acoustic methods, which capture the sound of escaping water using sensors or correlators placed on pipes or hydrants to pinpoint leaks by analyzing noise propagation speeds and patterns. Static approaches deploy fixed sensors for continuous monitoring in district metered areas (DMAs), while dynamic methods involve mobile teams with ground microphones or listening rods for targeted surveys. Advanced techniques include pressure transient analysis, where sudden pressure changes from valve operations reveal anomalies indicative of leaks, and in-pipe sensors measuring gradients for precise localization even under variable flows. Emerging technologies leverage machine learning on vibration signals from pipe networks or multilayer graph analysis of flow data to detect and localize multiple leaks with reduced false positives. NRW reduction strategies emphasize proactive management, starting with DMA implementation to isolate network sections for easier isolation via flow balancing and minimum night flow monitoring, which identifies unreported s when demand drops. Pressure management through optimized pumping and valve adjustments can cut real losses by 20-40% by lowering excess head that exacerbates bursts, as demonstrated in utilities adopting real-time control systems. Active leakage control programs, combining rapid repair teams with leak noise correlators, have achieved reductions of up to 50% in high-loss areas, while advanced metering (AMI) addresses apparent losses by improving accuracy and detecting via consumption anomalies. Integrated hydraulic modeling calibrates networks to quantify s precisely, enabling targeted interventions over broad replacements. Long-term success requires investment in trained personnel and performance-based contracts, which have shown NRW drops from 40% to below 20% in developing regions through involvement.

Real-Time Analytics and Modeling

Real-time analytics in water distribution systems integrate data from distributed sensors, such as pressure transducers, flow meters, and water quality probes, with supervisory control and data acquisition (SCADA) systems to enable continuous monitoring and decision-making. These systems process live telemetry data to detect anomalies like pressure drops indicative of leaks or contamination events, allowing operators to respond proactively rather than reactively. Hydraulic modeling in real time extends static simulations by assimilating field measurements into dynamic models, often using software like EPANET-RTX, which performs extended-period simulations updated every few minutes to forecast system states such as nodal pressures and pipe flows. This approach, implemented by the U.S. Environmental Protection Agency since 2023, supports operational adjustments for energy efficiency and reliability, with case studies showing reduced pump energy use by up to 10% through optimized scheduling. In the Las Vegas Valley Water District, real-time modeling integrated with SCADA has enabled daily operational planning, minimizing water age and improving chlorine residual management across a network serving over 2 million people as of 2014. Advanced analytics leverage for predictive tasks, such as demand estimation and leak localization, where Bayesian methods decompose nodal demands in large-scale networks, achieving estimation errors below 5% in benchmark tests on systems with thousands of nodes. For instance, graph neural networks have been applied to predict parameters like levels in real time, outperforming traditional models by incorporating spatial dependencies in pipe networks. These techniques reduce losses, with utilities reporting detection of bursts within hours rather than days, potentially saving millions in annual repair and supply costs. Integration challenges include and , addressed through frameworks that update hydraulic parameters automatically using Kalman filtering or similar state estimation methods, ensuring model fidelity to observed transients. In Singapore's water system, real-time models calibrated against data have supported criticality assessments, identifying vulnerable nodes during high-demand periods. Overall, these tools enhance resilience against failures, with analyses indicating that utilities adopting digital twins—virtual replicas updated in real time—achieve 20-30% improvements in operational metrics like response times to incidents.

Hazards and Vulnerabilities

Biological and Chemical Contamination Risks

Biological contamination in water distribution systems primarily arises from microbial pathogens that enter post-treatment through mechanisms such as pipe leaks, pressure transients causing negative pressure events, and cross-connections with non-potable sources. Biofilms—complex communities of microorganisms adhering to pipe interiors—can harbor opportunistic pathogens like , which persist despite residual disinfectants, leading to amplification in low-flow or dead-end sections of the network. outbreaks have been frequently linked to potable water distribution components, including premise extensions of municipal systems, with over 322 million people in the U.S. potentially exposed via routes. Protozoan parasites such as and resist chlorination and can intrude during system depressurization, evading detection by standard coliform indicators, which primarily signal fecal contamination but miss these resilient organisms. Chemical contamination risks stem from leaching of metals from aging infrastructure and formation of disinfection byproducts (DBPs) during residual chlorine reactions with organic matter transported through the system. Lead leaching occurs via corrosion of lead service lines or solder in older pipes, exacerbated by low pH or stagnant water, with the EPA action level set at 15 parts per billion to mitigate neurodevelopmental risks in children. Rusted iron pipes can generate carcinogenic hexavalent chromium through reactions with disinfectants, introducing trace but hazardous levels into supply. DBPs, including trihalomethanes (THMs), form in distribution systems and are associated with elevated bladder cancer risk from long-term exposure, as evidenced by epidemiological studies linking chlorinated water consumption to increased incidence. Intrusion events from infrastructure failures can also introduce external chemicals like nitrates or pesticides, compounding risks in vulnerable rural or aging urban networks. Mitigation relies on maintaining positive pressure and disinfectant residuals, yet distribution system vulnerabilities persist due to infrastructure decay, with events like main breaks facilitating contaminant ingress under low-pressure conditions. While chlorination effectively curbs most bacterial threats, its byproducts necessitate trade-offs, as incomplete DBP regulation leaves potential for chronic health effects including liver and kidney damage. Real-time monitoring for specific pathogens like Legionella remains limited in public systems, underscoring ongoing public health challenges from these post-treatment exposures.

Infrastructure Material Failures

Water distribution systems experience material failures primarily through corrosion, mechanical stress, and degradation of pipe materials, leading to leaks, breaks, and bursts that compromise system integrity and water quality. Corrosion, accounting for nearly 50% of water pipeline failures in the United States, arises from electrochemical reactions between pipe materials and their environment, exacerbated by factors such as soil aggressiveness, water chemistry, and stray currents. Internal corrosion occurs when aggressive water parameters, like low pH or high chloride levels, degrade metallic pipes from within, while external corrosion stems from corrosive soils affecting 75% of utilities. These failures manifest as pinhole leaks, circumferential cracks, or longitudinal splits, often in aging infrastructure where cast iron pipes installed before 1930 predominate and exhibit graphitization—a weakening process converting iron to brittle graphite. Cast iron and ductile iron pipes, comprising a significant portion of legacy systems, are prone to external pits that reduce wall thickness and internal tuberculation that restricts flow and promotes further degradation. pipes suffer similar corrosive thinning but are less common in modern networks due to protective coatings; however, coating s expose metal to accelerated attack. Plastic materials like PVC and HDPE, favored for newer installations, resist but fail via brittle cracking under repeated surges, separations from settlement, or defects, with studies indicating higher rates in some regions for these materials. Asbestos cement pipes degrade through fiber release and structural weakening from attack or freeze-thaw cycles, contributing to circumferential breaks. Annually, the records approximately 240,000 water main breaks, with a of 11.1 breaks per 100 miles of pipe, reflecting deterioration compounded by operational stresses like hydraulic transients and ground movement. These incidents result in substantial loss—up to 58 million gallons daily—and repair costs exceeding $2.6 billion, underscoring the causal link between unaddressed vulnerabilities and systemic inefficiency. Empirical from surveys confirm that pipe age correlates strongly with break frequency, with pre-1920 installations failing at rates up to 2.5 times higher than newer ones, necessitating material-specific mitigation beyond generalized maintenance. While innovations in linings and mitigate risks, historical underinvestment in replacement perpetuates cycles of reactive repairs over proactive renewal based on failure forensics.

External Threats Including Cybersecurity

External threats to water distribution systems encompass deliberate acts by adversaries aimed at disrupting service, contaminating supplies, or causing widespread harm, including physical and cyberattacks on control systems. Physical involves targeting pipelines, reservoirs, or pumping stations to interrupt flow or introduce contaminants, as outlined in assessments of malevolent acts by the U.S. Environmental Protection Agency (EPA), which categorize threats such as intrusion, of equipment, or to components. While documented incidents remain infrequent, the potential for or state-sponsored is heightened due to the distributed and often unsecured nature of buried mains and above-ground facilities, with historical precedents in broader attacks demonstrating feasibility. Cybersecurity threats have escalated, exploiting supervisory control and data acquisition (SCADA) systems that manage pressure, flow, and chemical dosing in water distribution networks. Many utilities operate legacy SCADA setups with vulnerabilities like inadequate authentication, unencrypted proprietary protocols, and internet-exposed human-machine interfaces (HMIs), enabling remote unauthorized access. The 2021 Oldsmar, Florida incident exemplified this risk, where cybercriminals remotely accessed a water treatment facility's SCADA system using TeamViewer software with default credentials, attempting to elevate sodium hydroxide levels from 100 parts per million to 11,100, potentially endangering public health before detection. Similar disruptions include a 2024 cyberattack on American Water's billing systems, causing outages, and incidents forcing manual operations in Arkansas City and tank overflows in Texas, highlighting operational impacts from nation-state actors, hacktivists, and cybercriminals. These cyber intrusions often stem from poor segmentation between (OT) and (IT) networks, phishing-enabled credential theft, and failure to patch known exploits, as noted in EPA assessments of systems revealing widespread flaws like unmonitored remote access. State actors, including those linked to and , have probed water sectors, with attempts to manipulate processes for disruption or , underscoring the sector's appeal due to its societal reliance and relatively low cybersecurity maturity compared to other infrastructures. Combined physical-cyber tactics, such as using digital to inform sabotage, amplify risks, though most threats remain opportunistic rather than coordinated mass-casualty efforts.

Maintenance and Renewal

Corrosion Mitigation Strategies

Corrosion in water distribution systems primarily affects metallic pipes such as , , , and , leading to tuberculation, pitting, and leaks that compromise and integrity. High dissolved oxygen (DO) in water supplies can cause corrosion in water pipes and distribution systems, potentially leading to metal release (e.g., iron) and degraded water quality. Mitigation strategies focus on preventing electrochemical reactions driven by water chemistry, conditions, and microbial activity, with effectiveness verified through pipe loop studies and field monitoring. Internal corrosion control often involves adjusting water chemistry to minimize corrosivity. Raising to 7.5–8.5 and increasing promotes the formation of stable scales on pipe walls, passivating surfaces and reducing iron and release by up to 90% in optimized systems. inhibitors, such as orthophosphates or blended phosphates dosed at 1–3 mg/L as P, create thin protective films that inhibit anodic reactions; EPA evaluations confirm these reduce lead solubility below action levels in over 80% of treated distributions when combined with pH adjustment. Silicates offer an alternative for systems avoiding phosphates, forming silica gels that limit metal dissolution, though they require higher dosages (10–20 mg/L SiO2) and may increase risks if not monitored. Utilities must conduct bench-scale and pilot testing per EPA Lead and Copper Rule guidelines to select treatments, as inhibitor efficacy varies with source water and existing pipe scales. External corrosion of buried mains, exacerbated by aggressive soils with low resistivity (<2000 ohm-cm), is addressed via systems. Impressed current systems, using rectifier-powered anodes, shift pipe potentials to -850 mV versus copper-copper reference, extending service life by 20–50 years in case studies of gray mains; effectiveness is quantified by reduced break rates, with models showing 30–70% fewer failures post-installation. Sacrificial anodes, typically magnesium or , provide galvanic protection for isolated segments but require replacement every 10–15 years and are less suitable for extensive networks due to uneven current distribution. External coatings, such as polyethylene encasement for , prevent moisture ingress when applied during installation, reducing rates by 50–80% in soils with below 5. Pipe rehabilitation techniques rehabilitate existing infrastructure without full replacement. Cement mortar or epoxy linings applied via cured-in-place methods remove tubercles and seal interiors, restoring flow capacity by 20–30% while providing a barrier against further corrosion; AWWA standards recommend this for mains over 50 years old. Material upgrades to plastic-lined or non-metallic pipes (e.g., HDPE) during renewal eliminate corrosion risks in aggressive environments, though hybrid systems retain metallic components for pressure resistance. Ongoing monitoring with coupons, potential surveys, and water quality sampling ensures strategy optimization, as unaddressed galvanic couples between dissimilar metals can undermine protections.

Routine Inspection and Flushing

Routine inspections of water distribution systems involve systematic assessments to identify deterioration, leaks, and structural issues before they escalate into failures. Common methods include visual examinations of pipelines and components, (CCTV) surveys for internal pipe conditions, acoustic to pinpoint unreported losses, and of operational such as break histories, pressure fluctuations, and flow anomalies. These approaches enable early intervention, with data-driven audits revealing that proactive monitoring can reduce water losses by up to 20-30% in audited systems through targeted repairs. Flushing procedures complement inspections by clearing accumulated sediments, stagnant water, and biofilms from mains, thereby restoring residuals and minimizing microbial growth. Unidirectional flushing, which directs high-velocity flow (typically 2.5-3 feet per second) through isolated pipe segments via valve manipulation, proves more effective than conventional hydrant-only flushing for scouring deposits, as it achieves targeted velocities without relying on available system pressure. Empirical studies demonstrate that routine flushing lowers heterotrophic plate counts (HPC) by reducing water age and dislodging particulates, with one full-scale implementation showing sustained improvements in residuals and levels post-flushing cycles. Standards from organizations like the (AWWA) recommend flushing dead-end and low-flow mains at velocities sufficient to mobilize sediments, often annually or seasonally, while adhering to discharge regulations to prevent environmental impacts. For instance, AWWA guidelines specify maintaining flows until water clears visually and meets residual targets, with post-flush sampling confirming compliance with parameters. Utilities implementing structured programs report fewer customer complaints about discoloration and taste, alongside enhanced overall system reliability, though over-flushing risks pipe erosion if not velocity-controlled. and flushing frequencies vary by system size and risk profile—small systems may flush quarterly for high-risk segments, while larger municipals schedule based on water age modeling—but EPA encourages tailored programs integrated with sanitary surveys every 3-5 years.

Long-Term Renewal Planning and Economics

Long-term renewal planning for water distribution systems addresses the progressive deterioration of buried infrastructure, much of which exceeds its original design life. In the United States, the average age of water mains surpasses 50 years, with many systems originating from the early , necessitating systematic replacement to avert failures such as bursts and leaks that compromise service reliability and . Effective planning integrates condition assessments, hydraulic modeling, and risk prioritization to schedule interventions that extend asset life while minimizing disruptions. Economic analysis underpins these strategies through lifecycle costing, which evaluates the total expenses of , rehabilitation, and full replacement against deferred action risks, including emergency repairs and losses. The recommends budgeting 1-2% of the total replacement value annually for sustainable renewal, yet many utilities fall short, leading to escalating future liabilities. For instance, optimization models balance structural integrity with financial efficiency, often employing calculations to determine the timing of pipe renewals that reduce overall system costs by up to 20-30% compared to reactive approaches. Funding mechanisms include user rates, municipal bonds, and federal grants, though persistent shortfalls hinder implementation; the U.S. Agency's 7th Drinking Water Infrastructure Needs Survey estimates $625 billion required over 20 years for pipe replacements and related assets, with transmission and distribution accounting for over 40% of needs. The ' 2025 Infrastructure Report Card highlights that while recent legislation like the has narrowed gaps, only partial funding covers the $3.7 trillion national shortfall projected through 2033, underscoring the economic imperative of proactive planning to avoid compounded costs from failures. Risk-based frameworks further inform economics by quantifying failure probabilities and societal impacts, enabling utilities to allocate limited resources toward high-consequence assets like those in densely populated areas.

Recent Technological Advancements

Digital Twins and AI Applications

Digital twins in water distribution systems consist of integrated virtual models that replicate physical , incorporating real-time data from sensors to simulate , dynamics, and asset conditions for operational forecasting and . These models enable utilities to predict system responses to variables such as demand fluctuations or pipe failures, reducing losses through calibrated simulations validated against historical flow and measurements. In a 2022 analysis by the , two U.S. utilities employed digital twins to enhance daily operations, achieving improved by integrating geographic information systems with hydraulic software for and rehabilitation prioritization. Artificial intelligence enhances digital twins by processing vast datasets for pattern recognition and optimization, particularly in predictive maintenance where machine learning algorithms analyze vibration, acoustic, and pressure signals to forecast pipe breaks or corrosion progression. For instance, AI-driven models in water distribution networks have demonstrated up to 30% cost savings in maintenance by simulating failure modes and recommending targeted interventions, as observed in Italian utility Gruppo CAP's implementation of a digital twin framework updated with sensor feeds. In leak detection, AI integrates with digital twins to identify anomalies in real-time; a 2025 deployment in Dublin's infrastructure used AI to localize leaks with sub-meter accuracy by correlating flow discrepancies and acoustic data within the virtual model. Similarly, Poland's Wroclaw water system applied AI for predictive failure analysis across its sewer and distribution networks, minimizing disruptions through proactive pipe assessments informed by twin simulations. Demand forecasting and energy optimization represent further AI synergies with digital twins, where neural networks trained on consumption patterns and weather data optimize pump schedules, potentially reducing energy use by 10-20% in pressurized systems. A 2024 study on generative AI in water distribution networks highlighted its role in generating synthetic scenarios for reclaimed and potable systems, improving resilience against events by testing strategies virtually before physical . The global market for AI in , encompassing these applications, grew to $7.54 billion in 2024, driven by utilities adopting hybrid digital twin-AI platforms for and efficiency gains. Challenges include dependencies and computational demands, yet empirical validations from case studies affirm causal links between model accuracy and reduced operational risks, such as the conversion of Ayodhya, India's intermittent supply to a 24/7 pressurized network via a calibrated in 2023.

Sensor Networks and Automation

Sensor networks in water distribution systems consist of distributed devices that collect real-time data on parameters such as , flow rates, (including , , conductivity, and chlorine residuals), and acoustic signals for . These networks, often and powered by IoT technologies, enable continuous monitoring across pipelines, reservoirs, and pumping stations, reducing reliance on manual inspections and improving response times to issues like leaks or contamination. For instance, the WaterWiSe platform developed at MIT integrates hydraulic, acoustic, and quality sensors to analyze data from urban networks, facilitating early detection of disruptions. Advancements in deployment include self-powered wireless nodes that measure multiple parameters without external sources, such as , conductivity, , oxidation-reduction potential, dissolved oxygen, and , deployed in operational pipelines since 2020. In , acoustic and sensors using IoT and models process signals from pipelines; a 2023 study utilizing 30,000 cases from installed sensors achieved high accuracy in identifying leak locations by training models on transients and noise patterns. Case studies demonstrate practical efficacy, such as AWS IoT implementations in 2022 that pinpointed leaks in fire hydrants and pipelines via near-real-time from distributed sensors. Automation integrates these sensors with supervisory control and data acquisition (SCADA) systems, which provide centralized oversight for adjusting valves, pumps, and treatment processes based on sensor inputs. enables predictive maintenance by analyzing trends, such as nodal demand estimation in real-time hydraulic models, where asynchronous sensor data refines water usage forecasts and minimizes losses. Recent integrations with and AI, as of 2024, allow on-site processing of sensor data for immediate anomaly alerts, enhancing 's role in optimizing energy use and compliance in water utilities. In simulated Spanish networks, AI-driven IoT sensor analysis optimized distribution efficiency by simulating leak scenarios and pressure management. These technologies have proven cost-effective; for example, wireless challenges like the Battle of the Water Networks (2009) benchmarked designs that reduced risks in hypothetical systems by strategically placing fewer than 100 sensors per network. However, implementation requires addressing power harvesting for remote , with ongoing research into energy-efficient protocols for long-term deployment in aging infrastructure. Overall, networks and shift from reactive to proactive paradigms, supported by empirical data from field trials showing reduced downtime and resource waste.

Sustainable Material and Efficiency Innovations

(HDPE) pipes have emerged as a sustainable alternative in water distribution systems due to their corrosion resistance, exceeding 100 years in many applications, and lower life-cycle environmental impacts compared to traditional for certain diameters. HDPE's smooth interior surface reduces frictional losses, thereby decreasing energy requirements for pumping by up to 20-30% relative to rougher or unlined pipes, enhancing overall system efficiency. In a replacement project spanning 761 km of networks, HDPE-based ELGEF Plus systems lowered losses from higher baseline rates to 30%, conserving resources and reducing operational costs. Carbon fiber reinforced polymer (CFRP) pipes represent an innovation for high-pressure mains, offering superior resistance over alternatives while minimizing material weight and installation energy. These composites exhibit tensile strengths comparable to but with negligible degradation from electrochemical , extending and reducing replacement frequency in aggressive soil environments. Life-cycle assessments indicate CFRP's lower embodied carbon for rehabilitation scenarios versus full replacements, though initial costs remain higher without subsidies. Cured-in-place pipe (CIPP) linings provide efficiency gains by creating seamless, low-friction interiors within existing mains, often restoring hydraulic capacity to near-original levels without excavation. Applied via inversion and thermal curing, these or resin-based liners reduce Hazen-Williams roughness coefficients from typical aged values of 80-100 to 140-150, cutting head losses and pumping by 10-25% in rehabilitated segments. Sustainability benefits include avoided trenching emissions—equivalent to 50-70% fewer CO2 equivalents per km rehabilitated compared to open-cut methods—and extended asset life by 50 years or more. Emerging , incorporating microcapsules or embedded polymers that autonomously repair microcracks, are under development to further enhance durability and minimize leakage risks in distribution networks. Prototypes demonstrate up to 90% crack closure within hours of , potentially reducing chronic losses that account for 20-30% of supplied volumes in aging systems globally. (PVDF) fittings complement these pipes by providing chemical inertness and zero , supporting leak-free joints in sustainable retrofits. While scalable adoption lags due to hurdles, field trials as of 2024 show 15-20% improvements in pressure retention over conventional metals.

Controversies and Policy Challenges

Privatization Outcomes and Incentives

Private ownership of water distribution systems creates incentives for operators to minimize operational costs and maximize service reliability, as profits depend on efficient resource use and in a regulated monopoly environment. This contrasts with public utilities, where bureaucratic inertia and electoral cycles often prioritize short-term spending over sustained capital investment, leading to deferred maintenance. Empirical analyses indicate that can enhance labor productivity and reduce losses by aligning managerial incentives with performance metrics, though outcomes hinge on regulatory frameworks that enforce standards without stifling returns. In the , following in 1989, water companies invested £160 billion in by , a sharp rise from annual public spending under £2 billion, enabling widespread upgrades to pipes, treatment plants, and monitoring systems. This capital influx correlated with quality reaching 99.96% compliance and bathing sites improving from under 33% excellent status to 66%, alongside a one-third reduction in s since the mid-1990s. However, average household bills rose approximately 40% above over the period, accumulating to levels around £400 annually by the 2020s, while companies accrued £45-50 billion in debt and paid over £50 billion in dividends to shareholders, prompting criticism of dividend-driven underinvestment in leak prevention and . Cross-country reviews of 22 empirical tests and 51 case studies reveal no systematic outperformance of private over public water utilities in metrics like coverage expansion or tariff affordability, with private operators often charging 82% higher in developing contexts despite marginal gains in staff efficiency (e.g., 13.1 versus 20.1 employees per 1,000 connections). In , where private firms serve over 75% of the population under delegated management contracts, performance indicators show competitive efficiency in distribution but no absolute edge over public alternatives, underscoring that contractual incentives—such as performance-based renewals—drive results more than ownership form alone. Failures, including contract terminations in places like (1999-2003) and (2000), frequently stem from inadequate tariff adjustments for or , eroding incentives and sparking public backlash rather than inherent privatization flaws. These patterns suggest that 's incentives foster investment in asset-heavy sectors like water distribution when paired with transparent , but weak oversight invites opportunism, such as cost-shifting to consumers or deferred maintenance to boost short-term profits. , private systems among large utilities exhibit higher prices and reduced affordability for low-income households, per regression analyses, highlighting risks in under-regulated markets. Overall, success correlates with institutional capacity to enforce service obligations, rather than privatization per se, as evidenced by sustained private participation in stable economies versus frequent reversals in volatile ones.

Government Mismanagement Case Studies

Government mismanagement in water distribution systems has led to numerous crises, often stemming from inadequate oversight, deferred maintenance, and decisions prioritizing short-term fiscal savings over integrity. These failures frequently involve local authorities neglecting treatment protocols or , compounded by state or federal lapses in enforcement and response. from investigations highlights how underfunding and exacerbate vulnerabilities in aging pipes and treatment facilities, resulting in events that could have been prevented through rigorous monitoring and proactive upgrades. In , a 2014 decision by city officials, under a state-appointed emergency manager, to switch the water source from via to the untreated for cost savings of approximately $5 million annually triggered widespread lead leaching from corroded pipes. Without adding corrosion inhibitors like orthophosphate, as required by federal standards, lead levels exceeded EPA action levels of 15 in over 40% of homes tested by October 2015, affecting a of about 100,000 and causing elevated lead levels in children. State environmental regulators dismissed resident complaints and falsified compliance reports, delaying federal intervention until January 2016, when the source was reverted; a subsequent EPA Office of Inspector General report identified lapses across local, state, and federal agencies in oversight and communication. Jackson, Mississippi's water system has endured chronic breakdowns due to decades of local government neglect of a 1960s-era treatment plant, with infrastructure deterioration leading to over 100 boil-water notices since 2015 and a of the O.B. Curtis Water Plant in August 2022 that left 180,000 residents without potable water for weeks. City audits revealed mismanagement including uncollected bills totaling $30 million and failure to implement a 2013 engineering study recommending $2 billion in upgrades, while state health department violations went unaddressed despite repeated EPA warnings since 2018. Federal investigations pointed to insufficient enforcement of requirements, with unspent infrastructure funds and delayed exacerbating the crisis until a court-appointed manager assumed control in November 2022. The 2000 Walkerton, Ontario outbreak illustrates regulatory deregulation's perils, where provincial government cuts to water inspection staff by 35% from 1996 to 2000 and reliance on self-reporting by undertrained operators allowed E. coli O157:H7 contamination from a cattle farm to enter the municipal well without detection. Inadequate chlorination—residual levels dropped to zero during heavy rainfall in May 2000—sickened 2,300 and killed seven, primarily to the local utility's failure to follow basic protocols amid reduced Ministry of the Environment oversight. The Walkerton Inquiry Commission found that Ontario's neoliberal policy shifts, including downloading responsibilities to municipalities without capacity building, directly contributed to the absence of mandatory training and verification, prompting subsequent legislation like the 2006 .

Regulatory Burdens versus Practical Reliability

Compliance with the (SDWA), particularly through rules like the Lead and Copper Rule (LCR) and its improvements (LCRI), imposes significant financial and administrative burdens on water utilities managing distribution systems. The EPA estimates annual nationwide compliance costs for the LCRI at $2.1 billion to $3.6 billion, encompassing service line replacements, enhanced sampling, and corrosion control upgrades. The contends these figures underestimate true expenses, projecting up to $4.9 billion annually, as utilities must integrate costly inventory assessments and accelerated removals within 10 years. These requirements demand extensive documentation, monitoring, and reporting, diverting personnel and budgets from core operational tasks. Small water systems, defined under SDWA as serving fewer than people and constituting over 85% of U.S. public water systems, face amplified challenges, with compliance often exceeding operational revenues due to limited customer bases and high per-capita costs. Historical analyses show SDWA mandates, such as those from amendments, elevated costs for these entities without proportional protections, leading to reliance on variances, consolidations, or state grants to avoid shutdowns. Financial pressures from such regulations can constrain maintenance budgets, indirectly undermining distribution system reliability by deferring repairs to leaks, breaks, or pressure management—issues that affect service continuity and in aging networks. Proponents of stringent oversight, including EPA analyses, assert benefits like $9 billion in annual health gains from LCR revisions outweigh implementation costs of $335 million, through reduced lead exposure and related illnesses. Yet, for practical reliability—defined by minimal disruptions, efficient distribution, and resilient infrastructure—excessive regulatory layering risks resource misallocation, as administrative compliance competes with proactive . Congressional reports highlight that while regulations avert acute contamination risks, small systems' struggles with affordability and capacity often result in deferred infrastructure investments, perpetuating vulnerabilities like those seen in underfunded rural networks. Streamlined approaches, such as targeted variances or regionalization incentives, could mitigate burdens without compromising essential safeguards.

References

Add your contribution
Related Hubs
User Avatar
No comments yet.