

Community hub
Recent from talks
Contribute something
Nothing was collected or created yet.
Climate of Finland
View on Wikipedia

The climate of Finland is influenced most by its latitude: Finland is located between 60 and 70 N. Because of Finland's northern location, winter is the longest season. Only on the south coast and in the southwest is summer as long as winter. On average, winter lasts from early December to late March along the southern coast and from early October to mid May in the northernmost locations such as Lapland. This means that southern portions of the country are snow-covered about three to four months of the year, and the northern for about seven months. The long winter causes about half of the annual 500 to 600 millimetres (19.7 to 23.6 in) precipitation in the north to fall as snow. Precipitation in the south amounts to about 600 to 700 millimetres (23.6 to 27.6 in) annually. Like that of the north, it occurs all through the year, though not so much of it is snow.[1]
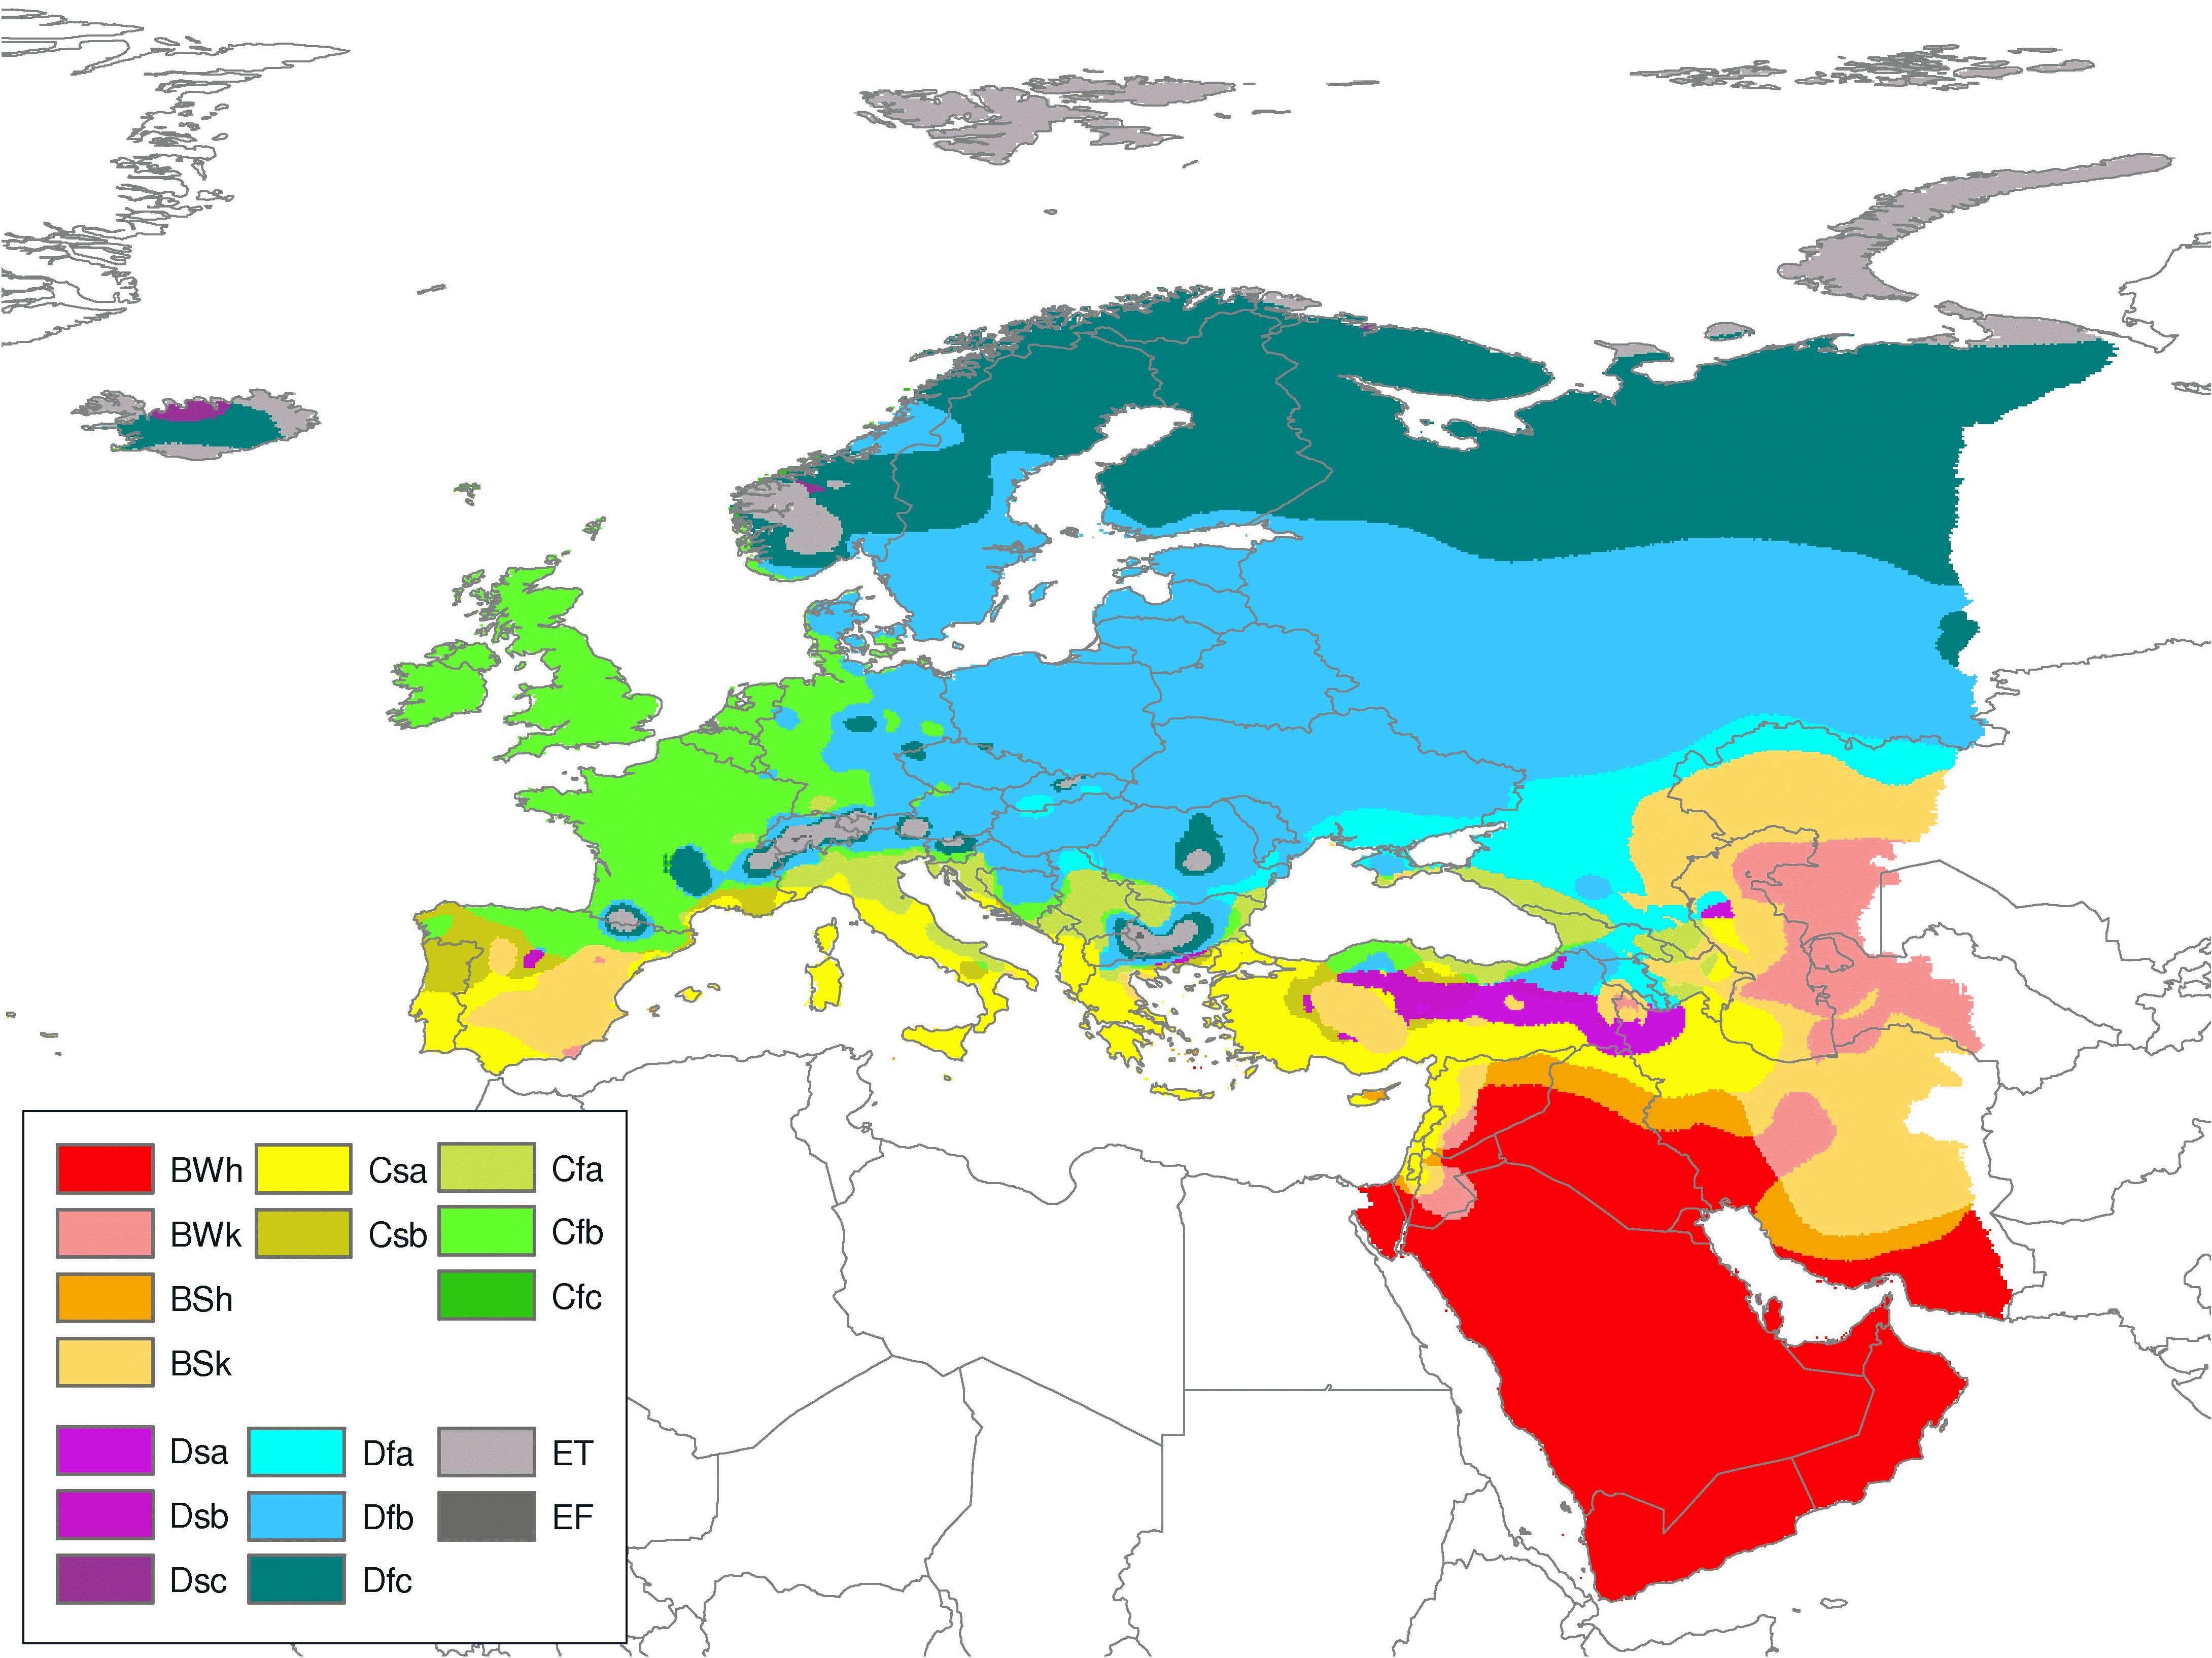
In Köppen climate classification Finland belongs to the Df group (continental subarctic or boreal climates). The southern coast is Dfb (humid continental mild summer, wet all year), and the rest of the country is Dfc (subarctic with cool summer, wet all year).[2][3]
The climate of Finland has characteristics of both maritime and continental climate. The Atlantic Ocean to the west and the Eurasian continent to the east interact to modify the climate of the country. The warm waters of the Gulf Stream and the North Atlantic Drift Current, which continuously warm the region, play a big role in the climate of Norway, Sweden and Finland; if it weren't for these currents, the winters in Fennoscandia would be much colder. Westerly winds bring the warm air currents into the Baltic areas and to the country's shores, moderating winter temperatures, especially in the south and southwest in cities like Helsinki and Turku where winter highs tend to be between 0 and 5 °C (32 and 41 °F) but a cold snap like the one that occurred in mid-January 2016 can cause temperatures to plunge well below −20 °C (−4 °F). These winds, because of clouds associated with weather systems accompanying the westerlies, also decrease the amount of sunshine received during the summer. By contrast, the continental high pressure system situated over the Eurasian continent counteracts the maritime influences, occasionally causing severe winters and high temperatures in the summer.
Temperature
[edit]The warmest annual average temperature in Southwestern Finland is 6.5 °C (43.7 °F). From there the temperature decreases gradually towards north and east. The Suomenselkä and Maanselkä drainage divides rise higher than the surrounding areas, and the climate there is cooler than at same latitudes elsewhere in Finland.[4] The Barents Sea between Finland and the North Pole is open even in winter, so northerly airflows are not as cold as in Siberia or Alaska.[5]
The highest temperature ever recorded is 37.2 °C (99.0 °F) (Liperi, July 29, 2010).[6] The lowest, −51.5 °C (−60.7 °F) (Kittilä, January 28, 1999). The annual average temperature is relatively high in the southwestern part of the country (5.0 to 7.5 °C or 41.0 to 45.5 °F), with quite mild winters and warm summers, and low in the northeastern part of Lapland (Finland) (0 to −4 °C or 32 to 25 °F).
Temperature extremes for every month:[7]
| Climate data for Finland | |||||||||||||
|---|---|---|---|---|---|---|---|---|---|---|---|---|---|
| Month | Jan | Feb | Mar | Apr | May | Jun | Jul | Aug | Sep | Oct | Nov | Dec | Year |
| Record high °C (°F) | 10.9 (51.6) |
11.8 (53.2) |
17.5 (63.5) |
25.5 (77.9) |
31.0 (87.8) |
33.8 (92.8) |
37.2 (99.0) |
33.8 (92.8) |
28.8 (83.8) |
21.1 (70.0) |
16.6 (61.9) |
11.3 (52.3) |
37.2 (99.0) |
| Record low °C (°F) | −51.5 (−60.7) |
−49.0 (−56.2) |
−44.3 (−47.7) |
−36.0 (−32.8) |
−24.6 (−12.3) |
−7.7 (18.1) |
−5.0 (23.0) |
−10.8 (12.6) |
−18.7 (−1.7) |
−31.8 (−25.2) |
−42.0 (−43.6) |
−47.0 (−52.6) |
−51.5 (−60.7) |
| Source: http://ilmatieteenlaitos.fi/lampotilaennatyksia | |||||||||||||
Record highs and lows
[edit]| Record highs by month | |||
| Month | Temp. | Date | Location |
|---|---|---|---|
| January | +10.9 °C (51.6 °F) | January 6, 1973 | Mariehamn, Åland |
| February | +11.8 °C (53.2 °F) | February 28, 1943 | Ilmala, Helsinki, Uusimaa |
| March | +17.5 °C (63.5 °F) | March 27, 2007 | Helsinki-Vantaa Airport, Vantaa, Uusimaa |
| April | +25.5 °C (77.9 °F) | April 27, 1921 | Jyväskylä, Central Finland |
| May | +31.0 °C (87.8 °F) | May 30/31, 1995 | Lapinjärvi, Uusimaa |
| June | +33.8 °C (92.8 °F) | June 24, 1934 | Ähtäri, South Ostrobothnia |
| July | +37.2 °C (99.0 °F) | July 29, 2010 | Joensuu Airport, Liperi, North Karelia[6] |
| August | +33.8 °C (92.8 °F) | August 7, 2010 | Heinola, Päijät-Häme,[8] Puumala, South Savo[9] |
| August 8, 2010 | Lahti, Päijät-Häme[8] | ||
| September | +28.8 °C (83.8 °F) | September 6, 1968 | Rauma, Satakunta |
| October | +21.1 °C (70.0 °F) | October 14, 2018 | Oulu Airport, North Ostrobothnia |
| November | +16.6 °C (61.9 °F) | November 6, 2020 | Mariehamn Airport, Jomala, Åland[10] |
| December | +11.3 °C (52.3 °F) | December 20, 2015 | Pori and Kokemäki, Satakunta[11] |
| Record lows by month | |||
| Month | Temp. | Date | Location |
|---|---|---|---|
| January | −51.5 °C (−60.7 °F) | January 28, 1999 | Kittilä, Pokka, Lapland |
| February | −49.0 °C (−56.2 °F) | February 5, 1912 | Sodankylä, Lapland |
| March | −44.3 °C (−47.7 °F) | March 1, 1971 | Salla, Tuntsa, Lapland |
| April | −36.0 °C (−32.8 °F) | April 2/9, 1912 | Kuusamo, Northern Ostrobothnia; Sodankylä, Lapland |
| May | −24.6 °C (−12.3 °F) | May 1, 1971 | Enontekiö, Kalmankaltio, Lapland |
| June | −7.7 °C (18.1 °F) | June 1, 2023 | Saana, Kilpisjärvi, Enontekiö, Lapland |
| July | −5.0 °C (23.0 °F) | July 1/12, 1958 | Enontekiö, Kilpisjärvi, Lapland |
| August | −10.8 °C (12.6 °F) | August 26, 1980 | Salla, Naruskajärvi, Lapland |
| September | −18.7 °C (−1.7 °F) | September 26, 1968 | Sodankylä, Vuotso, Lapland |
| October | −31.8 °C (−25.2 °F) | October 25, 1968 | Sodankylä, Lapland |
| November | −42.0 °C (−43.6 °F) | November 30, 1915 | Sodankylä, Lapland |
| December | −47.0 °C (−52.6 °F) | December 21, 1919 | Pielisjärvi, North Karelia |
- Measurements are made at the height of 2 metres. A record cold of sorts for June, −9.1 °C (15.6 °F) was measured on June 2, 2023 in Koivuniemi, Virolahti, Kymenlaakso. However, the measurement was made at ground level, so it could not be accepted as a record.[12][13]
Climate data
[edit]| Climate data for Helsinki (1991–2020 normals, records 1900–present) | |||||||||||||
|---|---|---|---|---|---|---|---|---|---|---|---|---|---|
| Month | Jan | Feb | Mar | Apr | May | Jun | Jul | Aug | Sep | Oct | Nov | Dec | Year |
| Record high °C (°F) | 8.5 (47.3) |
10.3 (50.5) |
15.1 (59.2) |
21.9 (71.4) |
27.6 (81.7) |
31.7 (89.1) |
33.2 (91.8) |
31.2 (88.2) |
26.2 (79.2) |
17.6 (63.7) |
13.4 (56.1) |
10.5 (50.9) |
33.2 (91.8) |
| Mean daily maximum °C (°F) | −0.7 (30.7) |
−1.3 (29.7) |
2.3 (36.1) |
8.1 (46.6) |
14.6 (58.3) |
18.8 (65.8) |
21.9 (71.4) |
20.5 (68.9) |
15.4 (59.7) |
9.2 (48.6) |
4.4 (39.9) |
1.4 (34.5) |
9.6 (49.3) |
| Daily mean °C (°F) | −3.1 (26.4) |
−3.8 (25.2) |
−0.7 (30.7) |
4.4 (39.9) |
10.4 (50.7) |
14.9 (58.8) |
18.1 (64.6) |
16.9 (62.4) |
12.3 (54.1) |
6.6 (43.9) |
2.4 (36.3) |
−0.7 (30.7) |
6.5 (43.7) |
| Mean daily minimum °C (°F) | −5.6 (21.9) |
−6.3 (20.7) |
−3.6 (25.5) |
1.1 (34.0) |
6.4 (43.5) |
11.2 (52.2) |
14.5 (58.1) |
13.5 (56.3) |
9.3 (48.7) |
4.2 (39.6) |
0.4 (32.7) |
−2.9 (26.8) |
3.5 (38.3) |
| Record low °C (°F) | −34.3 (−29.7) |
−31.5 (−24.7) |
−24.5 (−12.1) |
−16.3 (2.7) |
−4.8 (23.4) |
0.7 (33.3) |
5.4 (41.7) |
2.8 (37.0) |
−4.5 (23.9) |
−11.6 (11.1) |
−18.6 (−1.5) |
−29.5 (−21.1) |
−34.3 (−29.7) |
| Average precipitation mm (inches) | 53 (2.1) |
38 (1.5) |
34 (1.3) |
34 (1.3) |
38 (1.5) |
60 (2.4) |
57 (2.2) |
81 (3.2) |
56 (2.2) |
73 (2.9) |
69 (2.7) |
58 (2.3) |
653 (25.7) |
| Average rainy days (≥ 0.1 mm) | 19 | 16 | 13 | 12 | 11 | 14 | 12 | 13 | 14 | 16 | 17 | 19 | 176 |
| Mean monthly sunshine hours | 38 | 70 | 138 | 194 | 284 | 297 | 291 | 238 | 150 | 93 | 36 | 29 | 1,858 |
| Average ultraviolet index | 0 | 0 | 1 | 3 | 4 | 5 | 5 | 4 | 3 | 1 | 0 | 0 | 2 |
| Source 1: FMI climatological normals for Finland 1991–2020[14] | |||||||||||||
| Source 2: record highs and lows[15] | |||||||||||||
| Climate data for Tampere (1981–2010 normals, precipitation 1981-2010, extremes 1900–present) | |||||||||||||
|---|---|---|---|---|---|---|---|---|---|---|---|---|---|
| Month | Jan | Feb | Mar | Apr | May | Jun | Jul | Aug | Sep | Oct | Nov | Dec | Year |
| Record high °C (°F) | 8.0 (46.4) |
9.4 (48.9) |
14.9 (58.8) |
24.2 (75.6) |
28.4 (83.1) |
31.7 (89.1) |
33.1 (91.6) |
32.1 (89.8) |
24.8 (76.6) |
18.4 (65.1) |
11.1 (52.0) |
9.6 (49.3) |
33.1 (91.6) |
| Mean daily maximum °C (°F) | −3.4 (25.9) |
−3.5 (25.7) |
1.2 (34.2) |
8.2 (46.8) |
15.4 (59.7) |
19.5 (67.1) |
22.2 (72.0) |
19.9 (67.8) |
14.0 (57.2) |
7.5 (45.5) |
1.5 (34.7) |
−1.9 (28.6) |
8.4 (47.1) |
| Daily mean °C (°F) | −6.4 (20.5) |
−6.9 (19.6) |
−2.8 (27.0) |
3.3 (37.9) |
9.7 (49.5) |
14.1 (57.4) |
16.9 (62.4) |
15.0 (59.0) |
9.8 (49.6) |
4.6 (40.3) |
0.6 (33.1) |
−4.5 (23.9) |
4.4 (39.9) |
| Mean daily minimum °C (°F) | −9.7 (14.5) |
−10.6 (12.9) |
−6.6 (20.1) |
−1.3 (29.7) |
3.8 (38.8) |
8.6 (47.5) |
11.7 (53.1) |
10.4 (50.7) |
5.9 (42.6) |
1.9 (35.4) |
−3.0 (26.6) |
−7.6 (18.3) |
0.3 (32.5) |
| Record low °C (°F) | −37.0 (−34.6) |
−36.8 (−34.2) |
−29.6 (−21.3) |
−19.6 (−3.3) |
−7.3 (18.9) |
−2.8 (27.0) |
1.8 (35.2) |
−0.4 (31.3) |
−6.7 (19.9) |
−14.8 (5.4) |
−22.5 (−8.5) |
−34.2 (−29.6) |
−37.0 (−34.6) |
| Average precipitation mm (inches) | 41 (1.6) |
29 (1.1) |
31 (1.2) |
32 (1.3) |
41 (1.6) |
66 (2.6) |
75 (3.0) |
72 (2.8) |
58 (2.3) |
60 (2.4) |
51 (2.0) |
42 (1.7) |
598 (23.5) |
| Average snowfall cm (inches) | 32.3 (12.7) |
31.4 (12.4) |
29.5 (11.6) |
13.9 (5.5) |
1.6 (0.6) |
0.1 (0.0) |
0 (0) |
0 (0) |
0 (0) |
3.3 (1.3) |
13.1 (5.2) |
27.2 (10.7) |
152.4 (60) |
| Average precipitation days (≥ 0.1 mm) | 22 | 18 | 16 | 12 | 12 | 13 | 15 | 15 | 14 | 17 | 21 | 22 | 197 |
| Average relative humidity (%) | 90 | 87 | 82 | 70 | 63 | 66 | 69 | 76 | 82 | 87 | 91 | 92 | 80 |
| Source 1: weatheronline.co.uk[16] | |||||||||||||
| Source 2: FMI (precipitation, record highs and lows)[17] | |||||||||||||
| Climate data for Turku (1991-2020 normals, extremes 1900-present) | |||||||||||||
|---|---|---|---|---|---|---|---|---|---|---|---|---|---|
| Month | Jan | Feb | Mar | Apr | May | Jun | Jul | Aug | Sep | Oct | Nov | Dec | Year |
| Record high °C (°F) | 8.5 (47.3) |
10.2 (50.4) |
15.8 (60.4) |
24.5 (76.1) |
30.0 (86.0) |
32.0 (89.6) |
35.9 (96.6) |
32.6 (90.7) |
27.8 (82.0) |
18.9 (66.0) |
14.0 (57.2) |
11.0 (51.8) |
35.9 (96.6) |
| Mean daily maximum °C (°F) | −1.1 (30.0) |
−1.2 (29.8) |
2.6 (36.7) |
9.1 (48.4) |
15.5 (59.9) |
19.5 (67.1) |
22.6 (72.7) |
21.1 (70.0) |
15.7 (60.3) |
8.8 (47.8) |
3.6 (38.5) |
0.7 (33.3) |
9.7 (49.5) |
| Daily mean °C (°F) | −3.8 (25.2) |
−4.5 (23.9) |
−1.3 (29.7) |
4.1 (39.4) |
10.0 (50.0) |
14.4 (57.9) |
17.5 (63.5) |
16.2 (61.2) |
11.3 (52.3) |
5.7 (42.3) |
1.5 (34.7) |
−1.5 (29.3) |
5.8 (42.5) |
| Mean daily minimum °C (°F) | −6.5 (20.3) |
−7.1 (19.2) |
−4.7 (23.5) |
−0.2 (31.6) |
4.6 (40.3) |
9.3 (48.7) |
12.5 (54.5) |
11.6 (52.9) |
7.4 (45.3) |
2.8 (37.0) |
−0.9 (30.4) |
−4.1 (24.6) |
2.1 (35.8) |
| Record low °C (°F) | −35.5 (−31.9) |
−35.2 (−31.4) |
−32.8 (−27.0) |
−21.0 (−5.8) |
−6.6 (20.1) |
−2.2 (28.0) |
1.8 (35.2) |
0.2 (32.4) |
−6.9 (19.6) |
−15.0 (5.0) |
−22.3 (−8.1) |
−33.8 (−28.8) |
−35.5 (−31.9) |
| Average precipitation mm (inches) | 58 (2.3) |
42 (1.7) |
39 (1.5) |
32 (1.3) |
35 (1.4) |
55 (2.2) |
74 (2.9) |
73 (2.9) |
59 (2.3) |
73 (2.9) |
71 (2.8) |
73 (2.9) |
684 (27.1) |
| Average precipitation days | 11 | 9 | 8 | 7 | 7 | 8 | 8 | 10 | 9 | 11 | 13 | 12 | 113 |
| Mean monthly sunshine hours | 40 | 75 | 134 | 204 | 284 | 276 | 287 | 230 | 155 | 89 | 38 | 27 | 1,839 |
| Source: Climatological statistics for the normal period 1991–2020[18] | |||||||||||||
| Climate data for Oulu (1991-2020 normals, records 1921 - present) | |||||||||||||
|---|---|---|---|---|---|---|---|---|---|---|---|---|---|
| Month | Jan | Feb | Mar | Apr | May | Jun | Jul | Aug | Sep | Oct | Nov | Dec | Year |
| Record high °C (°F) | 9.3 (48.7) |
7.8 (46.0) |
11.5 (52.7) |
23.9 (75.0) |
29.9 (85.8) |
32.3 (90.1) |
33.3 (91.9) |
30.5 (86.9) |
25.4 (77.7) |
21.1 (70.0) |
11.2 (52.2) |
8.2 (46.8) |
33.3 (91.9) |
| Mean daily maximum °C (°F) | −4.8 (23.4) |
−4.7 (23.5) |
−0.4 (31.3) |
5.8 (42.4) |
12.6 (54.7) |
17.9 (64.2) |
21.1 (70.0) |
18.9 (66.0) |
13.2 (55.8) |
5.8 (42.4) |
0.5 (32.9) |
−2.7 (27.1) |
6.9 (44.5) |
| Daily mean °C (°F) | −8.2 (17.2) |
−8.4 (16.9) |
−4.4 (24.1) |
1.6 (34.9) |
8.0 (46.4) |
13.7 (56.7) |
16.7 (62.1) |
14.6 (58.3) |
9.6 (49.3) |
3.3 (37.9) |
−1.6 (29.1) |
−5.3 (22.5) |
3.3 (38.0) |
| Mean daily minimum °C (°F) | −11.9 (10.6) |
−12.1 (10.2) |
−8.3 (17.1) |
−2.5 (27.5) |
3.4 (38.1) |
9.3 (48.7) |
12.4 (54.3) |
10.6 (51.1) |
6.0 (42.8) |
0.6 (33.1) |
−4.2 (24.4) |
−8.8 (16.2) |
−0.5 (31.2) |
| Record low °C (°F) | −37.5 (−35.5) |
−41.5 (−42.7) |
−32 (−26) |
−21.4 (−6.5) |
−9.1 (15.6) |
−6.1 (21.0) |
3.6 (38.5) |
−1.5 (29.3) |
−8.0 (17.6) |
−20.6 (−5.1) |
−33 (−27) |
−37.2 (−35.0) |
−41.5 (−42.7) |
| Average precipitation mm (inches) | 32 (1.3) |
29 (1.1) |
26 (1.0) |
23 (0.9) |
40 (1.6) |
51 (2.0) |
80 (3.1) |
62 (2.4) |
49 (1.9) |
51 (2.0) |
43 (1.7) |
39 (1.5) |
525 (20.5) |
| Average snowfall cm (inches) | 33 (13) |
46 (18) |
43 (17) |
7 (2.8) |
— | — | — | — | — | — | 4 (1.6) |
17 (6.7) |
150 (59) |
| Average precipitation days | 9 | 8 | 7 | 6 | 8 | 8 | 10 | 10 | 8 | 10 | 10 | 10 | 104 |
| Average relative humidity (%) (daily average) | 87 | 86 | 82 | 73 | 67 | 66 | 71 | 76 | 82 | 86 | 90 | 89 | 80 |
| Mean monthly sunshine hours | 24 | 69 | 137 | 208 | 273 | 296 | 283 | 212 | 133 | 69 | 28 | 8 | 1,740 |
| Average ultraviolet index | 0 | 0 | 1 | 2 | 3 | 4 | 4 | 3 | 2 | 1 | 0 | 0 | 2 |
| Source 1: FMI[19] | |||||||||||||
| Source 2: FMI (record highs and lows 1961–present)[20]
FMI(record highs and lows 1921–1961)[21] Source 3: Finland. Oulu climate (average monthly UV index)[22] | |||||||||||||
Wind
[edit]The most common wind direction in Finland is from southwest, but the low pressure areas typical for these latitudes cause great variations in wind speed and direction.[1]
Storm, defined as at least one Finnish coastal station reporting at least 21 m/s as a 10-minutes average wind speed, is observed on Finnish seas on average 19 days a year. Strong winds are most frequent between October and January.[23]
Snow
[edit]The first snow cover is observed on average in September in Lapland, and in November in Southern and western areas. Permanent snow cover time starts typically around Christmas in the Southwestern corner, but before mid-November in most of Lapland. The maximum snow depth is usually found around March.[24]
Snow and supercooled droplets can accumulate in tree crowns and cause damage to trees. The trunks of pine trees can break under the weight of a snow-loaded crown, and deciduous trees can bend permanently. The snow load of a tree is typically 100–150 kg per one meter tree trunk, but the heaviest measured snow load of a spruce was over 3000 kilograms.[25]
Snowmelt contributes to spring floods. In north, the peak flow of rivers always happens in spring, in the south 70–80% of floods happen in spring. In the south, maximum flow happens in mid-April, in the north, in mid-May.[26]
It is predicted that as the Barents Sea gets less frozen in the coming winters and it becomes thus "Atlantified" additional evaporation will increase future snowfalls in Finland and much of continental Europe.[27]
Climate change
[edit]
References
[edit]- ^ a b "Climate elements". Finnish Meteorological Institute. Retrieved November 16, 2017.
- ^ "Map of climate classifications of Europe and Middle East" (JPG). People.eng.unimelbb.edu.au. Retrieved December 31, 2018.
- ^ Köppen Climate Classification System Encyclopedia of Earth
- ^ Karttunen, Hannu & Koistinen, Jarmo & Saltikoff, Elena & Manner, Olli: Ilmakehä, sää ja ilmasto. Ursan julkaisuja 107. Helsingissä: Ursa, 2008. ISBN 978-952-5329-61-2. page 357-358
- ^ Solantie, Reijo (2001). "Suomen ilmaston erityispiirteitä". Tieteessä tapahtuu (in Finnish). Retrieved November 15, 2017.
- ^ a b "Mercury Hits All Time Record of 37.2 Degrees". YLE Uutiset. Helsinki: Yleisradio Oy. July 29, 2010. Retrieved July 29, 2010.
- ^ "Lämpötilan ennätykset" (in Finnish). Helsinki: Ilmatieteen laitos. November 14, 2007. Retrieved July 29, 2010.
- ^ a b Sairanen, Sara (August 16, 2022). "Heinolassa mitattiin hurja hellelukema! Suomessa eletään nyt poikkeuksellisen lämmintä viikkoa" [‘Unusually high temperature recorded in Heinola! This week is exceptionally warm in Finland’]. Ilta-Sanomat (in Finnish). Sanoma. Retrieved August 16, 2022.
- ^ "Elokuun lämpöennätys tarkentui: 33,8 astetta". YLE Uutiset (in Finnish). Helsinki: Yleisradio Oy. August 8, 2010. Retrieved August 8, 2010.
- ^ Konttinen, Matti (November 6, 2020). "Marraskuun lämpöennätys meni taas rikki: Ahvenanmaalla 16,6 astetta" [‘Again record high in November: 16.6 degrees in the Åland Islands’]. yle.fi (in Finnish). Yle. Retrieved November 7, 2020.
- ^ "Säähavaintoarkisto 20.12.2015 - Päivätilastot - FMI Avoin data". kilotavu.com. Retrieved May 31, 2023.
- ^ Sairanen, Sara (June 2, 2023). "Kesäkuun kylmyysennätys rikkoutui jälleen" [‘Record low for June again’]. Iltasanomat (in Finnish). Sanoma. Retrieved June 2, 2023.
- ^ Ylen aamu 2 June 2023.
- ^ "FMI normals 1991-2020". fmi.fi. Retrieved October 7, 2021.
- ^ "FMI data". FMI. Retrieved September 25, 2020.
- ^ "weatheronline.uk". weatheronline.co.uk. Retrieved July 25, 2022.
- ^ "FMI open data". Finnish Meteorological Institute. Retrieved July 25, 2022.
- ^ "Normal period 1991–2020". Archived from the original on September 30, 2021. Retrieved October 7, 2021.
- ^ "FMI normals 1991-2020". FMI. Retrieved October 14, 2021.
- ^ "FMI open data". FMI. Retrieved September 7, 2019.
- ^ Juha Kersalo and Pentti Pirinen. (2009). Suomen Maakuntien Ilmasto Helsinki: Finnish Meteorological Institute. (in Finnish)
- ^ "Oulu climate guide". Weather 2 Travel. Retrieved May 13, 2022.
- ^ "Tuulitilastot". fmi (in Finnish). Finnish Meteorological Institute. Retrieved November 18, 2017.
- ^ "Snow statistics". Finnish Meteorological Institute. Retrieved November 16, 2017.
- ^ "Snow damage". Luke. Natural Resources Institute Finland. Archived from the original on November 17, 2017. Retrieved November 18, 2017.
- ^ Kuusisto, Esko. "Snow accumulation and snowmelt in Finland" (PDF). National board of waters. Retrieved November 16, 2017.
- ^ Bailey, Hannah; Hubbard, Alun; Klen, Eric S.; Mustonen, Kaisa-Riikka; Akers, Pete D.; Marttila, Hannu; Welker, Jeffrey M. (April 1, 2021). "Arctic sea-ice loss fuels extreme European snowfall". Nature Geoscience. 14 (5): 283–288. doi:10.1038/s41561-021-00719-y. hdl:10037/20941.
- ^ Which nations are most responsible for climate change? Guardian 21 April 2011
- ^ Pipatti, Riitta. "Statistics Finland - Greenhouse gases". www.stat.fi. Retrieved April 12, 2018.
- ^ Finland far behind climate goals, think tank says YLE 22.1.2020
- ^ Europe's Great Coal Collapse of 2019 Archived 2019-09-20 at the Wayback Machine Sandbag UK 18.9.2019
- ^ Darby, Megan (June 3, 2019). "Finland to be carbon neutral by 2035. One of the fastest targets ever set". Climate Home News. Retrieved May 11, 2020.
- ^ "Finland will achieve carbon neutrality by 2035". Sustainable Development Goals. United Nations. Retrieved May 11, 2020.
Climate of Finland
View on GrokipediaClimatic Classification and Influences
Köppen-Geiger Classification
Finland's climate falls under the D group of the Köppen-Geiger classification, denoting cold continental climates with the coldest month averaging below -3 °C and at least one month above 10 °C, combined with fully humid precipitation patterns (f subtype). The country features two primary subtypes: Dfb in the southern and central regions, and Dfc in the north.[5][2] The Dfb subtype, a humid continental climate with warm summers, requires at least four months with averages exceeding 10 °C and the warmest month below 22 °C. This applies to southern Finland, where milder winters and longer frost-free periods support broader agriculture, as evidenced by meteorological data from stations like Helsinki, where four to five months typically surpass 10 °C.[5] In contrast, the Dfc subarctic subtype prevails northward, with only one to three months above 10 °C, leading to shorter growing seasons; for instance, in Lapland, summer warmth is insufficient for more than two such months on average.[2][6] High-resolution mapping using 1991–2020 climatology data from the Climatic Research Unit (CRU) delineates the transition zone approximately along the 62–64° N latitude, with Dfb covering about 40% of the land area in the south and Dfc the remainder. No polar (E) or tundra zones are present, as even northern areas experience months above 10 °C, distinguishing Finland from higher Arctic latitudes.[5] These classifications reflect empirical temperature and precipitation thresholds derived from long-term observations, underscoring Finland's boreal character without dry-season limitations.Major Geographical and Oceanic Influences
Finland's climate is predominantly influenced by its northerly location between 60° and 70° N latitude, positioning it at the interface between polar and temperate zones on the western edge of the Eurasian continent. This geographical placement fosters a subarctic to humid continental regime, with extended periods of daylight in summer and darkness in winter driving extreme seasonal contrasts, including average January temperatures ranging from -4°C in the southwest to -14°C in the northeast. The continental exposure amplifies temperature variability, as cold Siberian air masses can penetrate unimpeded across the relatively low-relief terrain shaped by Pleistocene glaciation, which features modest elevations rarely exceeding 300 meters.[7][8] Oceanic factors, particularly the Atlantic Meridional Overturning Circulation (AMOC)—encompassing the Gulf Stream—exert a warming influence by conveying heat from lower latitudes northward, elevating Finland's temperatures by several degrees above expectations for its latitude alone. This thermohaline circulation, driven by density gradients and winds, moderates winters sufficiently to support coniferous forests across much of the country, with effects most pronounced in the west where westerly winds prevail. Without this oceanic heat transport, mean annual temperatures would approximate those of interior Siberia, underscoring the causal role of AMOC in averting harsher polar conditions.[9][8] The Baltic Sea, bordering Finland to the south and east, introduces maritime moderation along coastal zones, reducing winter extremes by 2–5°C relative to inland sites through heat storage and advection, while enhancing precipitation via orographic lift over adjacent land. In the Gulf of Finland and Gulf of Bothnia, seasonal ice formation—covering up to 50% of the sea in severe winters—alters albedo and wind patterns, prolonging cold spells but also contributing to spring meltwater influences on local hydrology. This semi-enclosed basin's low salinity and variable circulation amplify cyclonic activity, increasing storm frequency and cloudiness in southern regions.[10][11] Internal landscape features, including over 187,000 lakes occupying about 10% of the land area and boreal forests covering roughly 75%, generate mesoscale effects such as elevated local humidity from evaporation and reduced heat loss via canopy insulation, though these primarily manifest in microclimates rather than dominating national patterns. Lake surfaces delay autumn cooling and accelerate spring warming through thermal inertia, while forest evapotranspiration contributes to summer rainfall recycling, estimated at 20–30% of precipitation in forested catchments.[12][13]Regional Variations
Southern and Coastal Finland
Southern and coastal Finland, including major cities such as Helsinki and Turku along the Gulf of Finland and the Archipelago Sea, experiences a humid continental climate classified as Dfb under the Köppen-Geiger system, featuring warm summers and cold, snowy winters with significant moderation from the Baltic Sea. This maritime influence reduces temperature extremes, preventing the severe continental cold prevalent inland, while increasing humidity and cloud cover. The proximity to the sea also elevates precipitation levels compared to interior areas, with annual totals typically ranging from 600 to 700 mm, distributed relatively evenly but peaking in late summer and autumn due to cyclonic activity over the Baltic.[4][3][2] Mean annual temperatures in this region average around 5.5°C in the southwest, rising slightly eastward but remaining warmer than central and northern Finland by 4–6°C annually owing to the sea's thermal inertia, which delays cooling in winter and warming in spring. In Helsinki, representative of coastal conditions, average monthly temperatures vary from -4.9°C in February to 18.3°C in July, with daily highs in summer often reaching 20–22°C and winter lows moderated to rarely below -15°C on average. Snow cover persists for 80–120 days, shorter than inland durations, and thaws earlier in spring, typically by late April, influenced by southerly air masses and occasional mild Atlantic flows.[4][14][15] Precipitation in coastal areas benefits from orographic enhancement along the shoreline and frequent sea-effect snow in winter, contributing to about 10–20% higher totals than immediate inland sites; for instance, Helsinki records around 650 mm yearly, with July and August seeing 60–70 mm monthly, often as convective showers amid longer daylight. Historical data from the Finnish Meteorological Institute indicate a slight upward trend in annual precipitation of approximately 0.9 mm per year since the early 20th century, attributed to increased cyclonic frequency, though variability remains high with wetter phases linked to North Atlantic Oscillation positives. Coastal fog and mist are common, especially in summer, reducing visibility and enhancing the region's maritime character without altering the overall continental dominance.[4][3][16]Central Inland Areas
The central inland areas of Finland, encompassing regions such as Central Finland and parts of North Ostrobothnia, display a humid continental climate (Köppen Dfb) with pronounced seasonality due to their distance from moderating maritime influences, resulting in greater diurnal and annual temperature amplitudes than coastal zones. These areas, dominated by lakes, forests, and lowlands, experience colder winters from continental air masses and warmer summers from southerly flows, with local lake effects providing minor moderation through increased humidity and fog. Average annual temperatures hover around 4.5 °C, reflecting a balance between southern mildness and northern chill.[4][17] Winters in central inland Finland typically span November to April, with mean January temperatures averaging -9 to -10 °C, occasionally dipping below -30 °C during cold snaps driven by high-pressure systems over eastern Europe. Snow cover persists for 140-175 days annually, accumulating to maximum depths of 50-70 cm by March, supporting extensive frozen lake surfaces and influencing local albedo effects that prolong cold spells. Precipitation during this period falls predominantly as snow, contributing to about 40-50% of the annual total, though thaws can occur mid-season due to transient Atlantic lows.[1][18][19] Summers, from June to August, feature mean July temperatures of 15-17 °C, with daytime highs often exceeding 20 °C and rare peaks above 30 °C during blocking highs; these periods contrast sharply with winters, highlighting the continental gradient. Precipitation remains steady at 60-70 mm monthly, mostly as convective rain amid longer daylight hours, fostering rapid vegetation growth in forested terrains. Annual totals range from 650-700 mm, slightly higher than coastal averages due to orographic lift from inland topography, distributed fairly evenly but with winter snowfall emphasizing the region's hydrological freeze-thaw cycles.[4][17][7]Northern Lapland
Northern Lapland, the northernmost region of Finland extending beyond 68°N latitude, features a harsh subarctic climate (Köppen Dfc) marked by extended cold seasons, limited precipitation, and pronounced photoperiodic extremes due to its Arctic proximity and elevation in fell areas. Annual mean temperatures average around -1°C in representative stations like Sodankylä, with slightly cooler values further north toward Utsjoki, reflecting the gradient from continental influences and minimal maritime moderation.[20][4] Winters dominate from October to May, with average monthly temperatures in January and February ranging from -10°C to -15°C in Utsjoki and similar locales, accompanied by frequent subzero minima.[21] Snow accumulation supports persistent cover lasting 200-250 days, contributing to permafrost in higher elevations and fens. Precipitation totals 400-500 mm annually, predominantly as snow in winter (e.g., 35 mm equivalent in January at Sodankylä), with summer maxima around 70-75 mm in July; overall aridity stems from cold air's low moisture capacity and orographic barriers from Norwegian mountains.[22][23] Summers are short and cool, confined to June-August, with daily highs averaging 15-17°C in July at Utsjoki, rarely exceeding 20°C except during heat events; the 2021 record high of 33.6°C in Utsjoki illustrates potential for transient warmth under blocking highs.[24][25] Conversely, winter extremes include minima of -45°C to -50°C, as observed in Lapland's interior during radiative cooling under clear skies and light winds.[1] Polar night from late November to mid-January suppresses solar heating, while midnight sun from late May to mid-July enables modest diurnal warming despite low angles.[4] Observational records show recent intensification of variability, including the 2024 summer mean of 15.9°C across Lapland—surpassing prior benchmarks by 0.4°C based on tree-ring proxies spanning two millennia—attributable to amplified Arctic warming effects.[26] Such shifts influence snowmelt timing and growing season length, though baseline cold persists, with January 2025 averages remaining wintry in Lapland per Finnish Meteorological Institute data.[27]Seasonal Patterns
Winter Conditions
Winter in Finland typically spans from early December to late March in the southern coastal regions, extending to early October through mid-May in northern Lapland, resulting in durations of approximately four months in the south and seven months in the north. Average temperatures during December through February fall below freezing nationwide, ranging from around -1°C in the southwestern archipelago to -14°C in northern and eastern inland areas, as observed in the 2023-2024 season. These conditions arise primarily from the country's high latitude and continental influences, moderated slightly by the Baltic Sea in coastal zones.[28][1] Snow accumulation defines much of the season, with persistent cover forming due to sustained sub-zero temperatures and precipitation favoring solid forms over liquid. In southern Finland, snow persists for three to four months annually, while northern regions experience coverage for about seven months, often exceeding half the year. Maximum depths typically peak in March or early April, averaging 20-50 cm across Lapland and varying with elevation and exposure; historical data from 1961-2014 indicate northern winter averages of 82.7 cm, with maxima up to 121.5 cm in exceptional years like 2000.[19][29] Daylight sharply contracts, contributing to the season's harshness, with polar night—where the sun remains below the horizon for over 24 hours—affecting northernmost locales for up to six weeks around the solstice. In areas like Sodankylä, true polar night lasts about four days, though the term broadly applies to the dim midwinter period extending southward. Extreme events include cold snaps dropping below -30°C, with Finland's record low of -51.5°C at Kittilä on January 28, 1999.[1][30][31]Spring Variability
Spring in Finland, defined meteorologically as March through May, is characterized by a rapid transition from winter conditions, with mean daily temperatures rising from near 0°C to approximately 10°C across much of the country. This period marks the onset of snowmelt and lengthening daylight, but it is prone to pronounced day-to-day and year-to-year fluctuations driven by shifting air masses from the North Atlantic and Arctic regions. Cold outbreaks from the east or north can delay warming, while influxes of milder maritime air accelerate it, resulting in intra-seasonal temperature swings of 10–15°C or more in a single week at locations like Helsinki.[1][32] Snow cover duration and melt timing exhibit high variability, typically persisting into late April in southern Finland and May in the north, but advancing or retreating by weeks depending on antecedent winter accumulation and spring precipitation. Studies indicate that snow water equivalent has declined due to increased temperature variability, with earlier melt contributing to peak spring runoff that varies regionally—earlier and more intense in the south, prolonged in Lapland. Freeze-thaw cycles during this phase amplify hydrological uncertainty, as mid-season cold snaps can refreeze meltwater, reducing groundwater recharge by up to 20–30% in affected years.[33][34][32] Historical analyses reveal decadal-scale spring temperature variability, with the coldest periods in southwestern Finland occurring during the 1840s–1850s and early 1800s, based on multiproxy reconstructions from tree rings and documentary records. Modern observations from 1962–2014 show no uniform decrease in temperature variability despite overall warming, with standard deviations in March–May means remaining around 1.5–2°C at subbasin scales, influenced by large-scale oscillations like the North Atlantic Oscillation. This persistence of variability affects phenological events, such as plant budding and bird migration, which can shift by 1–2 weeks annually, complicating agricultural planning and ecosystem responses.[35][32][36]Summer Characteristics
Summer in Finland is meteorologically defined as the season during which the mean daily temperature exceeds 10°C.[1] This period typically commences in late May in southern Finland and extends until mid-September, spanning approximately four months in the south and three months farther north, influenced by the country's latitudinal extent and continental climate dynamics.[1] July stands as the warmest month, with national averages around 14–15°C, though regional disparities are pronounced: southern coastal areas average 17°C, central inland zones reach 16–18°C during peaks, and northern Lapland hovers near 13°C.[37] [7] Daily highs inland often climb to 20–25°C, occasionally surpassing 30–35°C in continental areas during heatwaves, while coastal proximity moderates extremes below 30°C.[7] Precipitation in summer manifests primarily as convective showers and thunderstorms, driven by diurnal heating and instability, making July and August the rainiest months despite fewer overall precipitation days compared to other seasons.[7] Monthly totals average 60–80 mm in the south, contributing 20–25% of the annual 500–650 mm nationwide, with higher intensities (up to 50–100 mm in single events) possible due to localized convection rather than frontal systems.[7] Northern regions receive slightly less, around 50–70 mm per summer month, but variability remains high, with dry spells interspersed among wet periods.[7] Daylight dominates the season, with June offering up to 24 hours of continuous light (midnight sun) above the Arctic Circle in Lapland and 18–19 hours in Helsinki, fostering extended photosynthesis but moderated by frequent cloud cover from summer convection, yielding actual sunshine of 200–250 hours per month in the south.[38] Annual sunshine totals range from 1,300 hours in eastern Lapland to 1,900 hours along the southwestern coast, with summer accounting for the clearest skies alongside spring.[7] Weather patterns exhibit rapid shifts, from prolonged warm, sunny intervals to cooler, overcast episodes, reflecting the interplay of Baltic Sea moderation and Arctic air incursions.[1] Historical extremes include a record 37.2°C in Joensuu in July 2010, underscoring potential for intense heat under blocking highs, though such events remain infrequent relative to milder norms.[7]Autumn Transitions
Autumn in Finland marks the transition from the relatively mild summer to the harsh winter, defined by the Finnish Meteorological Institute as the period when the daily mean air temperature persistently drops below 10 °C. This shift begins in the last week of August in northern Finland, particularly Lapland, and arrives in southern regions about one month later, around late September. Early autumn features average daytime highs of 10–15 °C in the south decreasing to 5–10 °C by November, with nights often dipping below freezing, leading to widespread initial frosts by mid-September in central areas and earlier in the north.[1][38] Precipitation intensifies during this season, especially along coastal zones where monthly totals peak at 60–80 mm in September and October, driven by increased cyclonic activity from the Atlantic. Rainfall dominates initially but transitions to sleet and snow as temperatures fall, with the first snowfalls occurring in September across northern Finland and extending to central and southern regions by October, though early accumulations typically melt due to intermittent thaws. By late November, persistent cold facilitates the onset of semi-permanent snow cover in inland and northern areas, averaging 10–20 cm initially.[4][1][39] The shortening daylight—dropping from roughly 12 hours in early September to under 7 hours by November—exacerbates the cooling trend through reduced solar insolation, while deciduous forests exhibit the ruska phenomenon of vivid red, yellow, and orange foliage from birch and rowan trees, peaking in September–October. Winds strengthen with more frequent low-pressure systems, contributing to gusts up to 15–20 m/s in exposed areas, and fog becomes prevalent in low-lying regions due to radiative cooling. These elements collectively signal the causal shift toward winter dominance, influenced by Finland's continental-maritime climate boundary.[1][38][4]Temperature Regimes
Average Monthly and Annual Temperatures
Finland's national climate normals for the 1991–2020 period, derived from gridded datasets incorporating observations across the country's stations, yield an annual mean temperature of approximately 2.9 °C.[40] This figure accounts for the pronounced north-south gradient, where southern coastal areas average around 5–6 °C annually, central regions 2–4 °C, and northern Lapland below 0 °C, influenced by latitude, Baltic Sea moderation, and continental air masses. For example, January mean temperatures from station-specific normals include -3.1 °C at Helsinki Kaisaniemi, -7.3 °C at Jyväskylä lentoasema, and -12.5 °C at Sodankylä Tähtelä, illustrating the regional variations.[41] The Finnish Meteorological Institute provides interactive charts for country-wide average monthly mean temperatures on their kuukausitilastot page, along with detailed station data.[41] Monthly patterns show subarctic characteristics: prolonged cold seasons with means below freezing from November to March, transitioning to positive anomalies in summer, peaking in July. These averages reflect empirical station data aggregated by organizations like NOAA and the University of East Anglia's Climate Research Unit, emphasizing observed variability over modeled projections.[42]| Month | Mean Daily Max (°C) | Mean Daily Min (°C) |
|---|---|---|
| January | -5.5 | -12.8 |
| February | -5.4 | -13.1 |
| March | -0.4 | -9.3 |
| April | 5.8 | -3.3 |
| May | 12.8 | 2.4 |
| June | 18.0 | 7.9 |
| July | 21.0 | 11.1 |
| August | 18.7 | 9.5 |
| September | 12.8 | 5.2 |
| October | 5.4 | -0.1 |
| November | -0.1 | -5.3 |
| December | -3.3 | -9.6 |
| Annual | 6.7 | -1.5 |
Historical and Recent Extremes
The highest temperature officially recorded in Finland is 37.2 °C, measured on 29 July 2010 at Joensuu Airport in Liperi, North Karelia.[44] The lowest temperature is -51.5 °C, recorded on 28 January 1999 at the Pokka station in Kittilä, Lapland.[45] These absolute extremes reflect the continental influence on Finland's subarctic climate, where brief incursions of warm air masses from the south can produce sharp peaks in summer, while stable high-pressure systems over Siberia enable profound cold outbreaks in winter.[1] In recent years, Finland has seen notable high-temperature events amid variable patterns. A prolonged heatwave in July 2025 marked the longest streak on record, with 15 consecutive days exceeding 30 °C nationwide, surpassing the prior benchmark of 13 days from 1972; this event affected even northern regions like Lapland, where daily maxima routinely topped 30 °C.[46] Conversely, cold extremes persist, including a -44.3 °C reading on 5 January 2024 at Enontekiö Airport in western Lapland, the lowest of that winter season.[47] Such events underscore that while average temperatures have risen—evident in warmer winters like the record-mild 2007–2008 season—absolute lows remain capable of approaching historical thresholds under favorable synoptic conditions.[48]| Extreme Type | Value | Date | Location | Source |
|---|---|---|---|---|
| Highest temperature | 37.2 °C | 29 July 2010 | Joensuu Airport, Liperi | FMI[44] |
| Lowest temperature | -51.5 °C | 28 January 1999 | Kittilä, Pokka | FMI[45] |
| Recent high streak | 15 days >30 °C | July 2025 | Nationwide | FMI[46] |
| Recent low | -44.3 °C | 5 January 2024 | Enontekiö Airport | FMI[47] |
Precipitation and Snow Dynamics
Rainfall Patterns and Distribution
Finland's rainfall patterns reflect its subarctic and humid continental climate influences, with liquid precipitation predominantly occurring from May through October due to temperatures above freezing. Annual rainfall totals vary spatially, increasing from the northeast to the southwest as a result of prevailing westerly winds carrying moisture from the Atlantic Ocean and the Baltic Sea. In northeastern Finland, averages range from 400 to 500 mm, while southwestern coastal areas receive 650 to 800 mm or more.[3][49] Seasonally, rainfall accumulates gradually from spring, peaking in late summer inland (July–August) and extending into early autumn on coastal regions (September–October), before declining sharply toward winter when much precipitation falls as snow. This distribution aligns with convective activity during warmer months and cyclonic storms in autumn, contrasting with minimal liquid precipitation in February and March, the driest periods. Nationwide, summer and autumn account for over 50% of annual rainfall, with monthly averages in southern stations like Helsinki reaching 60–80 mm in peak wet months, compared to 40–50 mm in northern areas like Rovaniemi.[4][3] Regional disparities are pronounced: western Finland experiences more frequent rain events from orographic uplift over proximity to the Gulf of Bothnia, while eastern interiors see drier conditions shielded by the continental high-pressure influences. Long-term data indicate stable patterns with slight increases in summer rainfall intensity observed since the mid-20th century, though total annual rainfall remains below 700 mm on average across most of the country.[16][50]Snow Cover Duration and Depth
Snow cover duration in Finland exhibits strong latitudinal gradients, with the number of days featuring continuous snow on the ground averaging 152 nationwide based on spatiotemporal analyses of gridded data. In southwestern coastal and archipelagic regions, the length of the stable snow season typically falls below 85 days, reflecting milder maritime influences and higher winter temperatures that limit accumulation. Conversely, northern and eastern interiors experience prolonged coverage, often exceeding 200 days annually, due to colder continental air masses and greater snowfall from northerly storm tracks. Permanent snow establishment occurs roughly two weeks after meteorological winter onset, which varies from late November in the south to October in Lapland.[51][52][1] Maximum snow depths peak around mid-March across most regions, shifting to early April in Lapland where persistence allows further buildup. Southwestern Finland records average maximum depths of 20 to 30 cm, constrained by frequent thaws and precipitation falling as rain or mixed forms. Eastern and northern areas achieve deeper accumulations of 60 to 90 cm on average, facilitated by sustained subfreezing conditions and higher solid precipitation totals from Arctic inflows. In specific northern locales, such as Inari district sites, mean winter depths approximate 83 cm, with maxima reaching 121 cm during heavy accumulation seasons. These depths support ecosystems adapted to prolonged insulation but vary interannually with precipitation efficiency and radiative losses.[1][19][53] Regional disparities in snow metrics stem primarily from topographic and synoptic factors: coastal proximity reduces depth and duration via warmer advection, while fell and forest interiors in the north enhance trapping and minimize ablation. Observations from the Finnish Meteorological Institute's network confirm these patterns, with snow depth measured daily at standardized sites using ultrasonic sensors for consistency. Interannual fluctuations, driven by North Atlantic Oscillation phases, can alter durations by weeks, but long-term means hold regionally stable absent major forcings.[19][54]Wind and Atmospheric Phenomena
Prevailing Wind Directions
In Finland, winds most commonly blow from the southwest across the country, reflecting the influence of mid-latitude westerly circulation where tropical and polar air masses converge.[4][7] Northeast winds occur least frequently nationwide.[4] Average wind speeds range from 2.5 to 4 m/s, with moderate conditions typical and stronger gusts rarer inland than along coasts.[4] South to southwest directions prevail in both summer and winter, driven by low-pressure systems from the North Atlantic that introduce mild, cloudy, and wet weather.[38] In winter, these southerly and southwesterly flows dominate, while occasional northern winds from the Arctic Ocean deliver cold, clear conditions.[38] Summer sees similar southwest prevalence, though southeast winds occasionally bring hot spells, thunderstorms, and heavy rain, and north-northeast flows usher in cooler air.[38] Wind speeds peak in winter and dip in summer overall.[4] Regional variations arise from topography and proximity to the Baltic Sea. In the Gulf of Finland region, southwest and northerly winds dominate basin-wide, with local east and west components; south to southwest sea breezes extend inland during the day.[55][38] Along the Gulf of Bothnia, westerly sea breezes influence coastal zones up to 10–20 km inland.[38] Inland areas experience calmer, less directional winds due to frictional damping from forests and lakes.[4]Storm Events and Gust Records
Finland experiences extratropical cyclones that occasionally produce severe windstorms, particularly in autumn and winter, originating from the North Atlantic and affecting coastal and inland areas. These events are tracked by the Finnish Meteorological Institute (FMI), with significant storms causing power outages, forest damage, and infrastructure disruptions; for instance, 92 notable windstorms from 2005 to 2018 impacted electricity grids, with the most severe occurring when systems moved northwest to east across northern Finland.[56] Nine major non-convective windstorms in the 2010s damaged forests, with reported timber losses ranging from 0.15 to 3.0 million cubic meters per event, influenced by gust speeds and terrain roughness.[57] Long-term analyses indicate no significant increase in wind speeds or storm frequency in northern Europe, including Finland, with interannual variability dominating trends.[58] Notable historical storms include Storm Aapeli on January 2, 2019, which set a prior national record for 10-minute mean wind speed at 32.5 m/s in Utsjoki, causing widespread power outages and structural damage.[59] [60] Storm Aila in September 2009 produced gusts up to 28 m/s inland, leading to significant coastal flooding and tree fall, though less intense than later events. More recently, Storm Lyly on November 1, 2024, marked Finland's first recorded hurricane-force winds, with a 10-minute mean of 33.5 m/s and gusts reaching 39.6 m/s at Rauma's Kylmäpihlaja lighthouse, surpassing previous benchmarks and causing extensive disruptions along the western coast.[45] [61] [62]| Record Type | Value | Location | Date |
|---|---|---|---|
| Highest 10-min mean wind | 33.5 m/s | Rauma, Kylmäpihlaja | 1 Nov 2024 |
| Highest gust | 39.6 m/s | Rauma, Kylmäpihlaja | 1 Nov 2024 |
| Previous 10-min mean record | 32.5 m/s | Utsjoki | 2 Jan 2019 |
Historical Climate Variations
Paleoclimate and Medieval Warm Period
Finland's paleoclimate during the Holocene epoch, beginning approximately 11,700 years ago after the retreat of the Fennoscandian Ice Sheet, is reconstructed primarily from proxy data including pollen records, chironomid (non-biting midge) assemblages, and lake sediment varves, which indicate an initial rapid warming phase post-deglaciation around 10,000 calibrated years before present (cal BP). Early Holocene summer temperatures in subarctic Finland, inferred from chironomid-based models, reached 1–2°C above modern averages, supporting the establishment of birch-dominated woodlands amid ongoing glacial isostatic rebound that elevated landmasses by up to 800 meters in some areas since the ice maximum.[65][66] The mid-Holocene (ca. 8,000–4,000 cal BP) encompassed the regional Holocene Thermal Maximum, with proxy evidence from pollen and branched glycerol dialkyl glycerol tetraethers (brGDGTs) showing expanded pine forests and summer temperatures potentially 1–1.5°C warmer than late 20th-century baselines in northern Fennoscandia, driven by enhanced summer insolation from Milankovitch cycles. This period transitioned into late Holocene neoglaciation, marked by gradual cooling and increased humidity, as evidenced by rising lake levels and shifts to cooler-adapted vegetation in sediment cores, culminating in alpine glacier advances by 4,000 cal BP. Tree-ring chronologies from Scots pine and Norway spruce, extending back over 2,000 years in northern Finland, further document multi-centennial cooling trends interrupted by shorter warm intervals.[67][68][69] The Medieval Warm Period (MWP), spanning roughly AD 900–1300 and also termed the Medieval Climate Anomaly, is prominently recorded in Finnish proxies as a phase of relative warmth, particularly in summer temperatures. Tree-ring width and density series from Lapland identify AD 931–1180 as the warmest 250-year interval since AD 750, with reconstructed warm-season (April–September) temperatures exceeding those of the subsequent Little Ice Age (AD 1601–1850) by margins consistent with natural thermohaline circulation variability.[70] In southern and eastern Finland, annually laminated lake sediments from sites like those analyzed for varve thickness and diatom assemblages reveal a climatically favorable interval around AD 1000–1250, characterized by reduced clastic input and enhanced organic deposition indicative of milder, potentially drier conditions compared to the cooler, wetter Little Ice Age.[71] Multi-proxy syntheses for Finland and adjacent Fennoscandia, including the north-central Europe/southern Fennoscandia network, show MWP centennial averages (e.g., AD 915–1014 and AD 1130–1229) aligning closely with 20th-century reference periods (e.g., 0.3°C above AD 1911–2010 in some reconstructions), contrasting with Little Ice Age lows of 0.7–0.8°C below those baselines. These patterns, derived from ring-width indices sensitive to summer warmth and drought stress, suggest solar irradiance peaks and positive North Atlantic Oscillation phases as key natural drivers, though regional asynchrony limits claims of global uniformity. Empirical tree-ring data underscore that MWP warmth in Finland was not anomalous relative to pre-industrial variability but highlights the role of internal ocean-atmosphere dynamics over anthropogenic influences in that era.[72][73]Little Ice Age Impacts
Proxy-based reconstructions using chironomid assemblages from lake sediments in northern Lapland reveal that the Little Ice Age (LIA, circa 1400–1850 CE) marked a prolonged cold phase in Finland, succeeding the Medieval Climate Anomaly (circa 900–1300 CE), with summer temperatures during the LIA averaging below the long-term record mean and interrupted by a brief warmer interlude that segmented the period into two principal cold episodes.[74] The LIA's cooling extended regionally, with proxy data from fossil midges indicating depressed temperatures persisting in southern Finland until around 1800 CE and in eastern Finland until approximately 1900 CE, reflecting a gradual transition toward modern warmth.[75] Agricultural productivity, centered on rye as the staple crop, faced recurrent threats from shortened growing seasons, untimely frosts, and volatile weather patterns during the LIA's chilliest intervals, such as the 17th century.[76] Tropical volcanic eruptions amplified these effects through short-term global cooling via stratospheric aerosols, triggering harvest failures in southern Ostrobothnia in years like 1601, 1641, 1675, and 1695, with over 50% of documented agricultural crises in the region causally linked to such volcanism-induced temperature drops of 1–2 years duration. These failures culminated in severe famines, including the 1695–1697 crisis, where crop shortfalls led to widespread impoverishment and elevated mortality rates across affected parishes. Finnish farmers employed adaptive strategies, including phenological adjustments to sowing and harvest timing based on observed weather patterns documented in historical diaries, which partially buffered against LIA extremes despite persistent yield vulnerabilities.[76] Broader societal repercussions encompassed heightened food insecurity and demographic pressures, though preindustrial resilience in Finland mitigated total collapse, with recovery tied to the LIA's termination amid rising solar activity and reduced volcanism by the late 18th century.[77] The period's cooler, often drier conditions with episodic instability further strained pastoral and forestry activities, underscoring the LIA's role in amplifying subsistence risks in northern latitudes.[78]Modern Trends and Observations
Instrumental Records from 19th Century Onward
Instrumental meteorological observations in Finland commenced in the mid-19th century, with systematic temperature measurements at the Helsinki-Kaisaniemi station beginning in 1844.[79] Precipitation records at the same station started in 1844, while other early stations, such as those in Turku and Oulu, provided supplementary data from the 1830s onward, though coverage was initially sparse.[80] The Finnish Meteorological Institute (FMI) has compiled gridded national temperature datasets from 1847, interpolating monthly means from available station records, with data density improving after the 1880s; prior to that, uncertainties arise from limited station networks.[81] National annual mean temperatures, derived from these gridded series, indicate a rise of over 2°C from 1847 to 2013, equating to approximately 0.14°C per decade, with acceleration after the late 1960s.[82] This warming has been most pronounced in winter, with December-February mean temperatures showing a trend of approximately 2-3°C since the early 1900s and exceeding 3°C overall since the late 19th century; long-term data from stations like Helsinki (from 1900) and Sodankylä (from 1908) confirm this upward trend, with milder winters and shorter thermal winter duration particularly in the south, where recent winters (last ~10 years relative to 1900s average) have been about 2.8°C warmer compared to about 2°C in the north.[81] Summer trends are milder at around 1°C; the 1930s marked a regional warm anomaly, particularly in northern Finland.[81] Precipitation totals have increased by about 10% over the same period, with greater relative gains in northern regions and during winter months, though year-to-year variability remains high due to Finland's maritime influences.[81] Station-specific records, such as Helsinki-Kaisaniemi's 1844–present series, show similar patterns after homogenization for site changes and urban effects, confirming the gridded trends but highlighting local variability; for instance, early 20th-century winters were colder on average than post-1980 conditions. FMI's ongoing data quality controls, including adjustments for measurement inconsistencies, underpin these series, though pre-1880 estimates rely on fewer observations and proxy validations.[81] Extremes within the record include a national high of 37.2°C in Liperi (2010) and a low of -51.5°C in Kittilä (1999), with frequency analyses indicating fewer severe cold spells since the mid-20th century.[45]Recent Decadal Anomalies
The decade from 2011 to 2020 featured several years with temperature anomalies exceeding 1 °C above the 1981–2010 national average, culminating in 2020 as the warmest year on record with an annual mean of 4.8 °C, 2.5 °C above that baseline and 0.6 °C warmer than the prior record holder of 2015.[83] [84] This period's warmth was particularly pronounced in winter, consistent with long-term seasonal trends where Finland's temperatures have risen 2–3 °C since the late 19th century, outpacing summer increases of just over 1 °C.[81] Precipitation during 1991–2020, encompassing much of the 2010s, averaged 2% higher than the 1981–2010 normal, with snow cover duration shortening by 1–2 weeks nationally.[40] Into the 2020s, anomalies remained elevated, with the 1991–2020 climatological normal itself registering a national mean temperature of 2.9 °C, 0.6 °C warmer than 1981–2010 and 1.3 °C above 1961–1990, reflecting accelerated warming relative to earlier 20th-century decades.[40] [85] The winter of 2019–2020 set a record for mildness, with December–February means surpassing prior benchmarks from 1924–1925 and 2007–2008 by 0.3 °C.[86] However, variability persisted; a persistent cold anomaly over Fennoscandia from October 2023 to January 2024 produced temperatures more than 3 °C below the 1991–2020 average in central Finland, driven by atmospheric blocking patterns amid a globally warm backdrop.[87] Such episodes underscore decadal-scale fluctuations superimposed on the upward trend, with no uniform acceleration in precipitation extremes documented in instrumental records for these years.[88]Climate Change Perspectives
Empirical Observations of Change
Instrumental records indicate that Finland's annual mean temperature has increased by approximately 2°C from the early 20th century to the present, a rate roughly double the global average warming.[89] This warming has been particularly pronounced in winter and spring, with summertime temperatures showing a trend of 0.486°C per decade from 1980–1999 to 2000–2019.[89] In 2024, the national average temperature reached about 4.0°C, exceeding the 1991–2020 baseline by 1.1°C.[90] Precipitation trends show an increase in annual totals, with observations from 1911 to 2011 revealing a rise of 0.92 ± 0.50 mm per year across Finland.[16] This upward trend has been more evident in cold-season heavy precipitation events, though spatial variations exist, with greater increases in northern regions during autumn.[32] Changes in the cryosphere are marked by reductions in snow and ice persistence. The length of the snow season shortened across nearly all of Finland from 1961 to 2014, with annual maximum snow depths decreasing in over 85% of the country, most notably in western coastal areas.[52] Lake ice cover has exhibited earlier break-up dates since the late 19th century, except in the northernmost areas, accompanied by a decline in black ice thickness of 7–8 cm per decade over the past 30 years.[91][92] These shifts correlate with warmer temperatures and altered precipitation patterns, though natural variability influences interannual fluctuations.[93]Natural Variability Versus Anthropogenic Claims
Finland's climate exhibits significant natural variability driven by large-scale atmospheric and oceanic oscillations, such as the North Atlantic Oscillation (NAO) and Atlantic Multidecadal Oscillation (AMO), which modulate temperature and precipitation patterns, particularly in winter and over decadal scales.[94][95] Positive NAO phases correlate with milder winters and increased storminess in Fennoscandia, contributing to observed temperature fluctuations independent of greenhouse gas forcing.[96] These modes introduce substantial uncertainty in attributing recent trends, as multi-decadal shifts in AMO and NAO can amplify or mask long-term changes, with natural variability accounting for a large portion of Arctic regional warming.[97][98] Anthropogenic attribution studies, often relying on climate model ensembles like CMIP6, claim that human-induced greenhouse gases have made specific extremes—such as the 2023 record-warm September in Helsinki—9.4 times more likely and 1.4°C warmer, or intensified recent Fennoscandian heatwaves by factors of 10 or more.[99][100] However, these assessments depend on counterfactual simulations assuming pre-industrial baselines, which incorporate model biases and fail to fully resolve internal variability on decadal timescales, potentially overstating anthropogenic signals.[101] Empirical instrumental records from Finland, spanning 1901–2018, show annual mean temperatures rising by about 2°C—double the global average—but comparisons with global climate models reveal discrepancies in simulating observed variability, suggesting unaccounted natural influences like solar modulation of summer temperatures in northern Fennoscandia.[102][103] Proxy reconstructions, including tree-ring data, indicate correlations between solar activity cycles and regional temperatures over centuries, with quasi-22-year Hale cycles evident in summer reconstructions from Finland, implying persistent natural forcings that models underrepresent.[104] While the Finnish Meteorological Institute attributes much of the post-1900 warming to anthropogenic factors aligned with global trends, the dominance of natural modes in boreal latitudes underscores challenges in causal isolation, as no direct experimental evidence quantifies the precise partitioning without reliance on equilibrium assumptions in general circulation models.[105][89] Decadal predictability remains limited by these internal dynamics, with studies emphasizing the need for better disentanglement to avoid conflating variability with forced change.[101]Finnish Adaptation Strategies and Critiques of Projections
Finland's National Climate Change Adaptation Plan 2030, approved by the government in December 2022 with implementation commencing in spring 2023, outlines measures to build societal capacity for managing climate-related risks, emphasizing integration across sectors like built environment, water resources, health, biodiversity, and food production.[106] [107] The plan prioritizes risk modeling, effectiveness monitoring of measures, and cross-sectoral coordination under the Climate Act (423/2022), which mandates updates at least every second parliamentary term.[108] Key actions include enhancing urban heat risk indicators through co-developed outcome metrics and adapting forest regulations to address shifting pest dynamics and growth patterns, as boreal forests face both opportunities from extended growing seasons and threats from increased storm damage.[109] [110] Sector-specific adaptations focus on empirical vulnerabilities: in agriculture, strategies leverage projected warmer conditions for yield gains while mitigating flood and drought risks via improved drainage and crop diversification; forestry emphasizes resilient species selection amid heavier snow loads in eastern regions and reduced ice cover on waters affecting log transport.[111] [112] Infrastructure resilience targets rising precipitation—anticipated to increase winter totals by up to 30% by mid-century—through upgraded flood defenses and energy sector preparations for variable hydropower from altered snowmelt patterns.[113] Municipal-level efforts, evaluated in risk assessments, reveal barriers like limited non-climate data integration, underscoring the need for localized empirical monitoring over generalized projections.[114] Overall, these strategies build on Finland's pioneering 2005 adaptation framework, prioritizing adaptive capacity without assuming irreversible thresholds.[115] Critiques of climate projections for Finland highlight limitations in global and regional models' ability to capture local variability, with the Finnish Meteorological Institute noting that coarser resolutions (e.g., 10-20 km) underestimate short-duration heavy rainfall events, necessitating 3 km grids for improved daily cycle representation.[116] CMIP5-based projections, used for national planning, forecast 2-5°C winter warming by 2040 and precipitation increases, yet discrepancies arise in snow damage predictions—models indicate rising risks in northern/eastern areas but declining in southern/western Finland, conflicting with observed regional trends influenced by natural atmospheric circulation.[117] [112] Uncertainties persist in aerosol-cloud interactions, where human pollution may mask warming extents, potentially leading to underestimation of baseline trends and overreliance on high-emission scenarios for adaptation planning.[118] Economic impact assessments critique projections for overlooking net benefits, such as reduced heating demands and agricultural expansions, which empirical data suggest could offset costs in a warming boreal context despite modeled extremes.[111] These issues underscore the value of observation-driven adjustments over model-derived alarmism, as multi-year forecast evaluations show strong temperature skill but weaker precipitation reliability for decision-making.[119]References
- https://www.coastalwiki.org/wiki/Effect_of_Climate_Change_in_the_Baltic_Sea_Area