Hubbry Logo
Raised-relief mapRaised-relief mapMain
Open search
Raised-relief map
Community hub
Raised-relief map
logo
8 pages, 0 posts
0 subscribers
Be the first to start a discussion here.
Raised-relief map
Raised-relief map
from Wikipedia
Hand-made raised-relief map of the High Tatras in scale 1:50 000

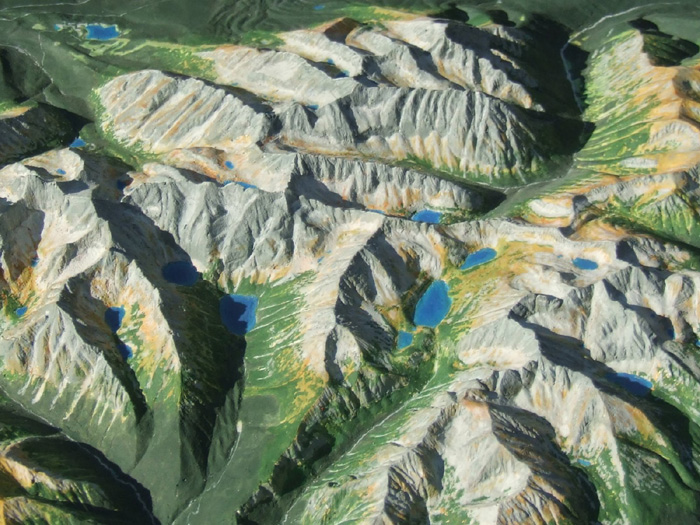
A raised-relief map, terrain model or embossed map is a three-dimensional representation, usually of terrain, materialized as a physical artifact. When representing terrain, the vertical dimension is usually exaggerated by a factor between five and ten; this facilitates the visual recognition of terrain features.

History

[edit]

If the account of Sima Qian (c. 145–86 BCE) in his Records of the Grand Historian is proven correct upon the unearthing of Qin Shi Huang's tomb, the raised-relief map has existed since the Qin dynasty (221–206 BCE) of China. Joseph Needham suggests that certain pottery vessels of the Han dynasty (202 BCE – 220 CE) showing artificial mountains as lid decorations may have influenced the raised-relief map.[1]

The Han dynasty general Ma Yuan made a raised-relief map of valleys and mountains in a rice-constructed model of 32 CE.[2] Such rice models were expounded on by the Tang dynasty (618–907) author Jiang Fang in his Essay on the Art of Constructing Mountains with Rice (c. 845). A raised-relief map made of wood representing all the provinces of the empire and put together like a giant 0.93 m2 (10 ft2) jigsaw puzzle was invented by Xie Zhuang (421–466) during the Liu Song dynasty (420–479).

Shen Kuo (1031-1095) created a raised-relief map using sawdust, wood, beeswax, and wheat paste.[3][4] His wooden model pleased Emperor Shenzong of Song, who later ordered that all the prefects administering the frontier regions should prepare similar wooden maps which could be sent to the capital and stored in an archive.[5]

In 1130, Huang Shang made a wooden raised-relief map which later caught the attention of the Neo-Confucian philosopher Zhu Xi, who tried to acquire it but instead made his own map out of sticky clay and wood.[5] The map, made of eight pieces of wood connected by hinges, could be folded up and carried around by one person.[5]

Later, Ibn Battuta (1304–1377) described a raised-relief map while visiting Gibraltar.[6]

In his 1665 paper for the Philosophical Transactions of the Royal Society, John Evelyn (1620–1706) believed that wax models imitating nature and bas relief maps were something entirely new from France.[7] Some later scholars attributed the first raised-relief map to one Paul Dox, who represented the area of Kufstein in his raised-relief map of 1510.[7]

Construction

[edit]

There are a number of ways to create a raised-relief map. Each method has advantages and disadvantages in regards to accuracy, price, and relative ease of creation.

Layer Stacking

[edit]

Starting with a topographic map, one can cut out successive layers from some sheet material, with edges following the contour lines on the map. These may be assembled in a stack to obtain a rough approximation of the terrain. This method is commonly used as the base for architectural models, and is usually done without vertical exaggeration. For models of landforms, the stack can then be smoothed by filling with some material. This model may be used directly, or for greater durability a mold may be made from it. This mold may then be used to produce a plaster model.

Vacuum Formed Plastic Maps

[edit]

A combination of computer numerical control (CNC) machining a master model, and vacuum forming copies from this, can be been used to rapidly mass-produce raised-relief maps. The Vacuum Forming technique, invented in 1947 by the Army Map Service in Washington, D.C., uses vacuum-formed plastic sheets and heat to increase the production rate of these maps. To make the Vacuum-Formed plastic maps, first a master model made of resin or other materials is created with a computer guided milling machine using a digital terrain model. Then a reproduction mold is cast using the master mold and a heat and pressure resistant material. Fine holes are put into the reproduction mold so that the air can later be removed by a vacuum. Next, a plastic sheet is applied to the mold so that they are airtight, and a heater is placed above the plastic for about 10 seconds. The vacuum is then applied to remove the remaining air. After letting the plastic cool, it can be removed and the terrain is complete. After this step, a color map can be overlaid/printed onto the bases that were created to make it realistic.[8]

Vacuum-formed plastic maps have many advantages and disadvantages. They can be quickly produced, which can be beneficial in time of war or disaster. However, the accuracy of certain points throughout the model can vary. The points that touch the mold first are the most accurate, while the points that touch the mold last can become bulged and slightly distorted. Also, the effectiveness of this particular construction method varies by the terrain being represented. They are not good at representing sharp-edged land forms like high mountain ranges or urban areas.[8]

3D Printing

[edit]
STL model of Mars with 20× elevation exaggeration for 3D printing

Another method which is becoming more widespread is the use of 3D printing. With the rapid development of this technology its use is becoming increasingly economic. In order to create a raised-relief map using a 3D printer, Digital Elevation Models (DEM) are rendered into a 3D computer model, which can then be sent to a 3D printer. Most consumer-level 3D printers extrude plastic layer by layer to create a 3D object. However, if a map is needed for commercial and professional uses, higher-end printers can be used. These 3D printers use a combination of powders, resins, and even metals to create higher-quality models. After the model is created, color can be added to show different land cover characteristics, providing a more realistic view of the area. Some benefits of using a 3D printed model include the technology and DEMs being more prevalent easier to find, and that they are easier to understand than a typical topographic map.[9]

DEM/TIN Formed Papercraft Maps

[edit]

Creating a papercraft raised relief map via a Digital Elevation Model (DEM) is a low cost alternative to many other methods. The method involves converting the DEM to a triangulated irregular network (TIN), unfolding the TIN, printing the unfolded TIN on paper, and assembling the printout into a physical 3D model.[10] This method allows raised relief maps to be constructed without the need for specialized equipment or extensive training. The degree of realism and accuracy of the resulting maps is similar to that of layer stacking models. However, the quality of the final map heavily depends on the characteristics of the TIN used.

Non-terrain applications

[edit]

For appropriate mathematical functions and especially for certain types of statistics displays, a similar model may be constructed as an aid to understanding a function or as an aid to studying the statistical data.

Notable examples

[edit]

The Great Polish Map of Scotland is claimed to be the largest terrain relief model, constructed out of brick and concrete in the grounds of a hotel near Peebles, Scotland. It measures 50 by 40 metres (160 ft × 130 ft).[11]

The Relief map of Guatemala, in Guatemala City, is of similar size as the Great Polish Map of Scotland. It was built in 1904–05.

However, a site in Ningxia province, China at 38°15′57″N 105°57′4″E / 38.26583°N 105.95111°E / 38.26583; 105.95111 was spotted in 2006 using satellite imagery. It measured 900 by 700 metres (3,000 ft × 2,300 ft), had a 3-kilometre (1.9 mi) perimeter and appeared to be a large scale relief model (1:500) of Aksai Chin, a disputed territory between China and India.[12]

See also

[edit]

References

[edit]

Further reading

[edit]
[edit]
Revisions and contributorsEdit on WikipediaRead on Wikipedia
from Grokipedia
A raised-relief map is a three-dimensional physical model of that depicts geographical elevations and through exaggerated vertical , providing a tactile and visual aid for understanding landforms beyond the limitations of two-dimensional representations. These maps are typically constructed using molded materials such as , , or vacuum-formed sheets, where the height differences are amplified—often by factors of 20 to 50 times the horizontal scale—to emphasize features like mountains, valleys, and plains for clearer comprehension. Originating in the with large-scale models for educational and planning purposes, raised-relief maps have been employed in geological studies, , and public exhibits, with notable examples including the monumental Great Globe on England's and detailed representations of volcanic regions like Hawaii's islands. Modern advancements, including , have enabled precise, customizable productions that maintain fidelity to digital elevation data while enhancing accessibility for visualization of extraterrestrial terrains, such as Mars' surface.

Fundamentals

Definition and Principles

A raised-relief map is a that depicts terrain features in three dimensions, with physical elevations molded or formed to represent the height of landforms above . These maps combine planimetric horizontal scaling with vertical relief to provide both visual and tactile of , distinguishing them from flat contour maps. The fundamental underlying raised-relief maps is the proportional scaling of elevation data onto a base layer, where higher terrains are raised relative to lower areas to mimic real-world . Horizontal distances follow a uniform scale for accurate plan views, while vertical dimensions are often exaggerated—typically by factors of 20 to 100 times—to ensure is perceptible at the reduced overall scale. This compensates for the limitations of human perception and material constraints, as true-scale vertical would be imperceptibly shallow on most sizes. Shading and contouring enhance the three-dimensional effect, with light and shadow accentuating slopes and peaks for intuitive comprehension of morphology. The design prioritizes for educational, navigational, or purposes, allowing users to trace routes or assess features by touch or sight without specialized tools. Construction relies on accurate source data, such as digital elevation models, to ensure fidelity to surveyed elevations.

Advantages and Limitations

Raised-relief maps provide a tangible three-dimensional depiction of , allowing users to intuitively grasp variations, slopes, and relationships that flat maps obscure through or shading. This tactile quality aids comprehension, particularly for individuals inexperienced with abstract topographic symbols, and supports applications in , , and by enabling direct physical interaction with the model's . Their physical form also facilitates volumetric analysis, such as assessing shadow patterns or water flow, which enhances realism through scaled to human perception, often exaggerating heights by factors of 5 to 20 times for visibility on small models. Despite these strengths, raised-relief maps incur high production costs and extended fabrication times, especially with methods like CNC milling or , limiting their for large areas or high-volume needs. They are bulky and heavy, complicating storage, transport, and deployment in field conditions, while updates to reflect new data require complete remaking rather than simple revisions. Additionally, their relief-focused design restricts integration of dense overlays like or thematic , reducing utility for multifaceted analysis compared to digital or flat alternatives.

Historical Development

Ancient and Pre-Industrial Origins

The earliest documented references to raised-relief maps appear in ancient Chinese records from the (206 BCE–220 CE), where such models facilitated navigation and military strategy by physically representing terrain elevations using materials like wood or clay. These innovations complemented grid-based mapping systems, allowing for more intuitive visualization of landscapes compared to flat depictions. In the Roman era, physical examples emerged, including a 2nd-century CE marble model of the Bay of that depicted coastal and volcanic in three dimensions, serving educational and planning purposes. Medieval Islamic scholars advanced the practice; al-Idrisi (c. 1100–1166 CE) documented clay-based elevation models to illustrate regional , influencing later European through descriptive texts on layered representation. During the (15th–16th centuries), European polymaths like constructed plaster and wood terrain models to study geological features such as river erosion and volcanic activity, often commissioned by patrons for estates or battlefields. In parallel, 16th-century Japanese artisans crafted wooden raised-relief maps, carving elevations to depict local geography for practical use. Pre-industrial production remained labor-intensive and artisanal through the 17th and 18th centuries, primarily employing plaster molding or layered paper techniques for military reconnaissance and royal displays in Europe; for instance, topographic models aided strategic planning in conflicts like the Thirty Years' War (1618–1648), where physical reliefs outperformed flat charts in conveying elevation-based tactics. These handmade artifacts, though durable, were limited by scale and material fragility, restricting widespread adoption until mechanized methods in the 19th century.

19th and Early 20th Century Innovations

The production of raised-relief maps advanced significantly in early 19th-century through the adoption of as a lightweight, moldable material for representation. In 1822, Karl Wilhelm Kummer in developed hand-painted relief maps using this technique, detailed in his publication Beschreibung von erhaben gearbeiteten oder Relief-Erdkugeln und Landkarten, which facilitated more precise elevation modeling compared to prior wood or carvings. August Ravenstein in followed with the Plastischer Schul-Atlas in 1838, employing for educational atlases that emphasized topographic accuracy and were reissued multiple times, laying groundwork for standardized use. A pivotal innovation occurred in the 1840s with the establishment of mechanized . Bauerkeller & Cie, founded in in 1836 by German immigrants, secured a on July 13, 1840, for an automated process combining for planimetric details and for raised lettering and contours, enabling scalable output of durable maps like the Environs de Paris en relief (1839). This method reduced labor-intensive handcrafting, lowered costs, and expanded distribution across , with subsequent patents in 1844 refining embossing for finer relief gradients. Parallel efforts in , such as J.D. Schneiter's regional maps from Berne starting in 1845, incorporated similar molding for alpine terrains, enhancing tactical and instructional applications. By the late , techniques evolved to include curved paper layering and engraving for enhanced , allowing integration of hypsometric data into relief forms. Production dispersed to the , with firms like Chicago's Central School Supply House manufacturing educational models by 1895. In the early , George Willard Hubbard advanced commercialization by merging sculptural molding with precise data, producing Hubbard Relief Maps that offered tactile for visualization, marking the shift toward widespread, affordable accessibility in North American . Hubbard Scientific's vacuum-forming processes further standardized output, prioritizing durability and detail for institutional use.

Post-WWII and Digital Transition

In the years following , raised-relief map production benefited from mapping programs that emphasized and , leading to the adoption of lighter synthetic materials such as rigid foams and high-density for substrates, which reduced weight and enabled compared to earlier or wood constructions. These advancements facilitated broader applications in and civilian analysis, including schoolroom models for demonstrating watersheds and geological processes. By the early 1960s, the Defense Mapping Agency Topographic Center (DMATC) developed digital terrain tapes as a direct outcome of efforts to automate and streamline the creation of raised-relief maps, marking an initial shift from purely manual sculpting to data-driven processes that encoded elevation information for mechanical reproduction. This innovation laid groundwork for integrating computational methods, though physical fabrication remained labor-intensive, often involving layered molding or contour milling guided by analog or early digital inputs. The full digital transition accelerated in the late 20th century with the proliferation of (CAD) software and digital elevation models (DEMs), which allowed precise rendering of data from sources like into 3D models suitable for automated fabrication. By the 1980s and 1990s, technologies such as (invented in 1984) and fused deposition modeling enabled prototyping of custom raised-relief maps, evolving into widespread by the 2000s for high-resolution, on-demand production using DEMs derived from missions like NASA's in 2000. This shift reduced costs and improved accuracy, supplanting traditional methods for applications requiring detailed topographic visualization.

Construction Techniques

Traditional Manual Methods

Traditional manual methods for raised-relief maps relied on hand-sculpting terrain features from malleable or carvable materials, drawing from topographic surveys or contour maps to approximate elevations. These techniques, practiced since ancient times and popularized in the late , emphasized skill in translating two-dimensional data into three-dimensional form, often with to enhance visibility of subtle relief. Artisans began by securing a flat base, such as wood or , scaled to the map's horizontal dimensions. A foundational layer of , modeling clay, or similar medium was applied, partially set, and then shaped using hand tools including trowels, spatulas, knives, rasps, and files to build ridges, carve valleys, and define peaks in accordance with contour intervals—typically adjusted for variability, such as 20 feet for flat areas and for rugged zones. For wood, subtractive carving from blocks predominated, employing chisels and gouges to remove material progressively. Finishing involved drying the model, sanding irregularities, applying fillers like papier-mâché for seams if needed, and painting to differentiate landforms, water, and vegetation—sometimes incorporating textured elements such as glued cork for forests. These labor-intensive processes, documented in Civilian Conservation Corps training manuals from the 1930s, produced durable artifacts but were limited by the sculptor's interpretive accuracy and time demands, often requiring weeks for large-scale models.

Layer Stacking and Forming Processes

Layer stacking, a foundational technique in raised-relief map construction, involves fabricating models by cutting successive horizontal sheets of material along topographic contour lines and assembling them into a stepped structure. This method approximates vertical through discrete layers, each representing a fixed interval derived from contour data, typically ranging from 10 to 100 meters depending on scale and desired resolution. Common materials for the sheets include , foam board, , or , selected for their ease of cutting and structural integrity when stacked. The process commences with a base or (DEM) providing contour lines; each layer's perimeter is traced and excised manually with knives, saws, or, in modern applications, precision tools like cutters or CNC routers to ensure accuracy within millimeters. Layers are aligned using pins, templates, or fixtures, then bonded sequentially from lowest to highest with adhesives such as glue or , building cumulative height that mirrors the terrain's . Forming processes follow stacking to mitigate the inherent stepped profile, which can distort visual and tactile representation of slopes. Gaps between layers are filled with , , or modeling compounds, followed by sanding, filing, or to sculpt smoother gradients and eliminate abrupt edges; this refinement can reduce step heights by up to 50% of the original layer thickness, enhancing realism without altering base contours. In historical applications, such as 19th-century military models, forming emphasized manual retouching with chisels and abrasives for tactical accuracy, while contemporary variants incorporate vacuum-assisted forming over stacked molds for thin-sheet overlays that conform more fluidly to the stack's . The technique's scalability allows for models from small-scale educational aids (e.g., 1:50,000 with 20-meter intervals) to large installations, though labor-intensive manual cutting limits precision in complex terrains; digital integration has improved repeatability, with software generating cut files from DEMs to minimize errors below 1% of total range. Limitations include warping under and the need for post-forming to avoid overemphasizing flat benches between contours.

Modern Digital Fabrication

Modern digital fabrication of raised-relief maps leverages (CAD) software and computer (CNC) machinery to convert digital elevation models (DEMs) into physical three-dimensional representations, supplanting labor-intensive manual sculpting with scalable, repeatable processes. DEMs, derived from sources such as scans or satellite radar data like the (SRTM) collected in 2000, provide elevation grids with resolutions as fine as 1 arc-second (approximately 30 meters horizontally). These datasets are processed into mesh formats like STL files, which define surface geometry through triangulated vertices representing height variations. Additive manufacturing via dominates contemporary production due to its accessibility and ability to handle complex topologies without tooling. Tools such as the open-source TouchTerrain , introduced in , automate DEM-to-STL conversion by generating printer-specific models that account for bed size, layer height, and exaggeration factors to enhance subtle relief features—typically scaling vertical elevations by 5 to 20 times for visual clarity. Printing occurs layer-by-layer using fused deposition modeling (FDM) with thermoplastics like (PLA), achieving layer thicknesses of 0.1 to 0.4 millimeters, or (SLA) for finer details down to 25 micrometers. Post-processing includes sanding, painting, and sealing to replicate natural textures and withstand handling. Commercial fabricators like WhiteClouds report producing maps up to 10 feet in scale, integrating color printing for geological or vegetative overlays directly during fabrication. Subtractive CNC milling complements 3D printing for larger or more durable models, particularly in foam, wood, or substrates. Digital models guide multi-axis routers to carve contours from a blank, with depths controlled to match DEM elevations; for instance, processes using software like TouchTerrain output for machines capable of tolerances under 0.5 millimeters. This method excels in high-volume or oversized applications, such as architectural mockups exceeding printer build volumes, and allows hybrid workflows where milled masters seed casting molds. Limitations include material waste and the need for robust fixturing on soft substrates to avoid deflection, though advancements in vacuum-assisted tables mitigate these since the mid-2010s. Hybrid digital techniques, including laser sintering or over CNC-machined positives, further expand options for cost-sensitive runs, with fabrication times scaling from hours for small prints to days for expansive terrains. Accuracy hinges on input DEM fidelity—errors in source data propagate, as seen in SRTM's absolute vertical inaccuracies of up to 16 meters in vegetated areas—necessitating validation against ground surveys for critical uses. These methods, proliferated by affordable hardware post-2010, enable custom production by non-specialists via platforms like tutorials, democratizing access while preserving topographic fidelity.

Applications

Terrain Visualization and Analysis

Raised-relief maps enable direct tactile and visual examination of terrain features, allowing users to physically trace ridges, depressions, and slopes that represent changes derived from digital elevation models (DEMs). This physical embodiment exaggerates vertical scale—often by factors of 20 to 50 times horizontal scale—to accentuate subtle topographic variations otherwise obscured in two-dimensional representations, facilitating intuitive grasp of landscape configuration without reliance on abstract contour lines. In visualization contexts, these maps surpass flat alternatives by leveraging natural and shadows to reveal micro-relief details, such as drainage patterns and fault lines, which enhance and reduce interpretive errors in perceiving three-dimensional structure from planar data. Studies on comprehension indicate that physical models improve users' ability to infer volumetric properties, correlating two-dimensional symbols with real-world forms more effectively than digital screens alone. For terrain analysis, raised-relief maps support qualitative evaluations of geomorphic processes, such as identifying potential zones through manual assessment of angles and aspect via direct measurement with tools like or inclinometers applied to the model's surfaces. Hydrologists and geologists have historically employed them to simulate water flow and by pouring fluids or tracers over the , observing causal pathways that inform predictive modeling, though modern quantitative analysis typically integrates these with GIS-derived metrics for precision.

Military and Strategic Planning

Raised-relief maps serve as critical tools in military and strategic planning by offering a physical, three-dimensional depiction of terrain that reveals elevation gradients, natural barriers, and potential chokepoints inaccessible through two-dimensional cartography alone. These models allow planners to simulate troop deployments, evaluate fields of fire, and anticipate logistical challenges posed by topography, such as restricted mobility in mountainous or urban environments. Unlike digital simulations, physical relief maps enable tactile interaction during briefings, fostering intuitive comprehension among commanders and staff without reliance on interpretive skills for contour lines. The origins of molded raised-relief maps trace to necessities, with initial applications focused on modeling fortifications, urban centers, and broader landscapes for tactics and defensive assessments dating back to pre-modern eras. By the , European armies, including French forces, produced detailed relief maps that informed operational doctrines, emphasizing terrain's causal role in dictating maneuver options and vulnerability to flanking attacks. World War II saw extensive production of such models, with thousands fabricated in mobile workshops proximate to combat zones to expedite planning for offensives and defenses. Notably, legacy 19th-century French relief maps contributed to Allied preparations for the 1944 , where accurate terrain replication aided in forecasting beach obstacles, inland ridges, and inland flood risks. Plastic-molded variants emerged during the (1950–1953), enhancing durability and scalability for field use amid rugged peninsular terrain. Postwar, U.S. Army units integrated raised-relief maps into training regimens, with organizations like the USAREUR Simulation, Training, and Experimentation Resources Production Center manufacturing 3D plastic models to replicate operational environments for mission rehearsal. Rudimentary forms appeared earlier in the (1861–1865), where both Union and Confederate engineers constructed terrain mockups from available materials to visualize battlefields like Gettysburg, though limited by manual fabrication constraints. Despite digital alternatives, physical models persist for scenarios demanding verifiable, low-tech redundancy in contested electromagnetic environments.

Educational and Recreational Uses

Raised-relief maps facilitate tactile exploration of terrain in educational settings, enabling students to physically trace elevations, valleys, and ridges to comprehend topography more intuitively than with flat representations. In classrooms, these maps support hands-on activities where learners correlate contour lines with three-dimensional forms, enhancing spatial reasoning and retention of geographic concepts. A 2018 study published in the Journal of Geography Education demonstrated that students using tactile raised-relief maps achieved 25% higher scores on topography quizzes compared to those relying on two-dimensional maps alone, attributing gains to kinesthetic engagement. These maps prove particularly valuable for visually impaired students, with tactile versions employed in schools for over a century to convey geographic features through heightened relief that emphasizes elevation changes. Educational applications extend to museums and labs, where models like those from Hubbard Scientific allow group demonstrations of landforms, fostering in subjects such as and . The U.S. Geological Survey has historically produced molded raised-relief maps for instructional purposes, aiding in the visualization of regional terrains. In recreational contexts, raised-relief maps assist outdoor enthusiasts in trip planning by providing tangible previews of trails, sites, and challenges, thereby reducing navigational errors in rugged areas. Hobbyists often craft custom models at home using layered materials to replicate local landscapes, combining topographic data with personal creativity for activities like terrain simulation in remote-controlled racing or wargaming. Beyond utility, these maps serve as decorative elements in homes or offices, appealing to nature enthusiasts who value their artistic depiction of physiographic features for aesthetic enjoyment. Commercial producers like Summit Maps stock versions tailored for climbers, hunters, and pilots, emphasizing durable, portable designs for field reference.

Non-Terrain Adaptations

Raised-relief techniques have been adapted for anatomical modeling to create three-dimensional educational tools that emphasize structural elevations and depressions in human physiology. These models, typically produced via vacuum-forming or similar molding processes on plaques, provide tactile feedback alongside visual representation, aiding in the comprehension of complex internal features such as muscle layers, organ contours, and neural pathways. For instance, sets comprising multiple plaques cover systems like the skeletal, muscular, and circulatory, with dimensions often around 25 cm by 35 cm per model. Specific examples include raised-relief charts of the , which depict cross-sections, lateral views, and functional regions with raised elements to highlight gyri, sulci, and ventricular spaces. Similarly, eye models illustrate corneal layers, structures, and the optic pathway in relief, while heart charts raise arterial and valvular features for during study. Spinal nerve diagrams employ relief to show branching patterns and vertebral alignments, facilitating understanding of innervation without . These tools, distributed by educational suppliers since at least the early , are designed for classroom use, with realistic coloring to differentiate tissues. Beyond anatomy, the contour-layering approach inherent to raised-relief construction finds application in architectural site modeling, where stacked layers represent building footprints and structural elevations on flat bases, often scaled to 1:500 or finer without terrain exaggeration. This adaptation prioritizes precise volumetric representation of man-made forms, such as multi-level facades or urban assemblages, differing from geographic uses by focusing on orthogonal rather than undulating profiles. Such models support design visualization and stakeholder presentations, leveraging the same formative precision as terrain maps but applied to engineered constructs.

Notable Examples

Historical Artifacts

One of the earliest documented raised-relief maps was created by the polymath (1031–1095) during a border inspection in the late . Constructed from layered wood, sawdust, beeswax, and wheat paste, the model depicted terrain features with precise proportions and orientations, adhering to a uniform scale of 1:900,000 as used in his accompanying flat maps. Presented to , it exemplified an established Chinese tradition of three-dimensional topographic representation for strategic and exploratory purposes. In and , raised-relief maps proliferated in the 19th century, often for educational, promotional, and geological illustration. A notable surviving example is the 1872 papier-mâché relief map of New Hampshire's White Mountains, produced by publishers K. Snow and J.Q. Bradlee. Measuring approximately 3 feet by 4 feet, it incorporated hand-applied shading to accentuate elevations up to 6,288 feet at , reflecting mid-19th-century advances in molding techniques for tourist and academic use. This artifact, preserved in collections like the New-York Historical Society, highlights the transition from artisanal carving to more reproducible methods using molded pulp. Few pre-modern raised-relief maps survive intact due to the perishable materials like clay, wood, and plaster employed, though descriptions in historical texts confirm their use in military planning and imperial surveys as early as ancient . By the late , larger-scale artifacts emerged, such as the Portland Stone Great Globe in (circa 1900), a 40-foot-diameter hollow with embedded , intended as an educational display but never fully realized in its original form. These examples underscore the evolution from portable strategic models to monumental public installations.

Contemporary Productions

Contemporary raised-relief maps are fabricated using digital elevation models (DEMs) derived from sources such as USGS data and satellite altimetry, processed via CAD software to generate precise 3D geometries. Fabrication techniques include multi-material for detailed, full-color representations and of vinyl sheets over molded plastic substrates for durable, large-scale maps. These methods enable customization, with producers offering maps scaled from local neighborhoods to national extents, often at resolutions capturing sub-meter elevation changes. WhiteClouds specializes in 3D-printed models, utilizing binder jetting and full-color printing to replicate landscapes with integrated bases and optional LED for visualization. Their products, such as custom regional topographies, incorporate updates and support applications in and environmental analysis. Similarly, Hubbard Scientific produces vinyl-over-molded maps of U.S. states, regions, and national parks, registering printed cartographic details onto relief forms generated from USGS 1:250,000-scale for tactile accuracy. These maps, available since the of digital molding in the late , maintain production as of 2023 with enhancements for educational use. Open-access tools like TouchTerrain, developed by , democratize production by allowing users to export STL files for 3D printing of terrain tiles from global DEM datasets, facilitating low-cost, on-demand models since its 2015 launch. Commercial entities such as RaisedRelief and Muir Way extend this to consumer markets, offering wall art-style maps that blend topographic relief with artistic hydrology layers, produced via layered printing on substrates like wood or acrylic as of 2024. Summit Maps provides high-resolution topographic wall maps for , emphasizing to highlight subtle features in flat terrains. These advancements, rooted in empirical geospatial data, ensure verifiability against source metrics like vertical accuracy standards (e.g., RMSE below 1 meter for recent ).

References

Add your contribution
Related Hubs
User Avatar
No comments yet.