
Community hub
Recent from talks
Contribute something
Nothing was collected or created yet.
Real-time polymerase chain reaction
View on Wikipedia

A real-time polymerase chain reaction (real-time PCR, or qPCR when used quantitatively) is a laboratory technique of molecular biology based on the polymerase chain reaction (PCR). It monitors the amplification of a targeted DNA molecule during the PCR (i.e., in real time), not at its end, as in conventional PCR. Real-time PCR can be used quantitatively and semi-quantitatively (i.e., above/below a certain amount of DNA molecules).
Two common methods for the detection of PCR products in real-time PCR are (1) non-specific fluorescent dyes that intercalate with any double-stranded DNA and (2) sequence-specific DNA probes consisting of oligonucleotides that are labelled with a fluorescent reporter, which permits detection only after hybridization of the probe with its complementary sequence.
The Minimum Information for Publication of Quantitative Real-Time PCR Experiments (MIQE) guidelines, written by professors Stephen Bustin, Mikael Kubista, Michael Pfaffl and colleagues propose that the abbreviation qPCR be used for quantitative real-time PCR and that RT-qPCR be used for reverse transcription–qPCR.[1] The acronym "RT-PCR" commonly denotes reverse transcription polymerase chain reaction and not real-time PCR, but not all authors adhere to this convention.[2]
Background
[edit]Cells in all organisms regulate gene expression by turnover of gene transcripts (single stranded RNA): The amount of an expressed gene in a cell can be measured by the number of copies of an RNA transcript of that gene present in a sample. In order to robustly detect and quantify gene expression from small amounts of RNA, amplification of the gene transcript is necessary. The polymerase chain reaction (PCR) is a common method for amplifying DNA; for RNA-based PCR the RNA sample is first reverse-transcribed to complementary DNA (cDNA) with reverse transcriptase.
In order to amplify small amounts of DNA, the same methodology is used as in conventional PCR using a DNA template, at least one pair of specific primers, deoxyribonucleotide triphosphates, a suitable buffer solution and a thermo-stable DNA polymerase. A substance marked with a fluorophore is added to this mixture in a thermal cycler that contains sensors for measuring the fluorescence of the fluorophore after it has been excited at the required wavelength allowing the generation rate to be measured for one or more specific products. This allows the rate of generation of the amplified product to be measured at each PCR cycle. The data thus generated can be analysed by computer software to calculate relative gene expression (or mRNA copy number) in several samples. Quantitative PCR can also be applied to the detection and quantification of DNA in samples to determine the presence and abundance of a particular DNA sequence in these samples.[3] This measurement is made after each amplification cycle, and this is the reason why this method is called real time PCR (that is, immediate or simultaneous PCR).
Quantitative PCR and DNA microarray are modern methodologies for studying gene expression. Older methods were used to measure mRNA abundance: differential display, RNase protection assay and northern blot. Northern blotting is often used to estimate the expression level of a gene by visualizing the abundance of its mRNA transcript in a sample. In this method, purified RNA is separated by agarose gel electrophoresis, transferred to a solid matrix (such as a nylon membrane), and probed with a specific DNA or RNA probe that is complementary to the gene of interest. Although this technique is still used to assess gene expression, it requires relatively large amounts of RNA and provides only qualitative or semi quantitative information of mRNA levels.[4] Estimation errors arising from variations in the quantification method can be the result of DNA integrity, enzyme efficiency and many other factors. For this reason a number of standardization systems (often called normalization methods) have been developed. Some have been developed for quantifying total gene expression, but the most common are aimed at quantifying the specific gene being studied in relation to another gene called a normalizing gene, which is selected for its almost constant level of expression. These genes are often selected from housekeeping genes as their functions related to basic cellular survival normally imply constitutive gene expression.[5][6] This enables researchers to report a ratio for the expression of the genes of interest divided by the expression of the selected normalizer, thereby allowing comparison of the former without actually knowing its absolute level of expression.
The most commonly used normalizing genes are those that code for the following molecules: tubulin, glyceraldehyde-3-phosphate dehydrogenase, albumin, cyclophilin, and ribosomal RNAs.[4]
Basic principles
[edit]Real-time PCR is carried out in a thermal cycler with the capacity to illuminate each sample with a beam of light of at least one specified wavelength and detect the fluorescence emitted by the excited fluorophore. The thermal cycler is also able to rapidly heat and chill samples, thereby taking advantage of the physicochemical properties of the nucleic acids and DNA polymerase.
The PCR process generally consists of a series of temperature changes that are repeated 25–50 times. These cycles normally consist of three stages: the first, at around 95 °C, allows the separation of the nucleic acid's double chain; the second, at a temperature of around 50–60 °C, allows the binding of the primers with the DNA template;[7] the third, at between 68 and 72 °C, facilitates the polymerization carried out by the DNA polymerase. Due to the small size of the fragments the last step is usually omitted in this type of PCR as the enzyme is able to replicate the DNA amplicon during the change between the alignment stage and the denaturing stage. In addition, in four-step PCR the fluorescence is measured during short temperature phases lasting only a few seconds in each cycle, with a temperature of, for example, 80 °C, in order to reduce the signal caused by the presence of primer dimers when a non-specific dye is used.[8] The temperatures and the timings used for each cycle depend on a wide variety of parameters, such as: the enzyme used to synthesize the DNA, the concentration of divalent ions and deoxyribonucleotide triphosphates (dNTPs) in the reaction and the bonding temperature of the primers.[9]
Chemical classification
[edit]Real-time PCR technique can be classified by the chemistry used to detect the PCR product, specific or non-specific fluorochromes.
Non-specific detection: real-time PCR with double-stranded DNA-binding dyes as reporters
[edit]A DNA-binding dye binds to all double-stranded (ds) DNA in PCR, increasing the fluorescence quantum yield of the dye. An increase in DNA product during PCR therefore leads to an increase in fluorescence intensity measured at each cycle. However, dsDNA dyes such as SYBR Green will bind to all dsDNA PCR products, including nonspecific PCR products (such as primer dimer). This can potentially interfere with, or prevent, accurate monitoring of the intended target sequence.
In real-time PCR with dsDNA dyes the reaction is prepared as usual, with the addition of fluorescent dsDNA dye. Then the reaction is run in a real-time PCR instrument, and after each cycle, the intensity of fluorescence is measured with a detector; the dye only fluoresces when bound to the dsDNA (i.e., the PCR product). This method has the advantage of only needing a pair of primers to carry out the amplification, which keeps costs down; multiple target sequences can be monitored in a tube by using different types of dyes.
Specific detection: fluorescent reporter probe method
[edit]
Fluorescent reporter probes detect only the DNA containing the sequence complementary to the probe; therefore, use of the reporter probe significantly increases specificity, and enables performing the technique even in the presence of other dsDNA. Using different-coloured labels, fluorescent probes can be used in multiplex assays for monitoring several target sequences in the same tube. The specificity of fluorescent reporter probes also prevents interference of measurements caused by primer dimers, which are undesirable potential by-products in PCR. However, fluorescent reporter probes do not prevent the inhibitory effect of the primer dimers, which may depress accumulation of the desired products in the reaction.
The method relies on a DNA-based probe with a fluorescent reporter at one end and a quencher of fluorescence at the opposite end of the probe. The close proximity of the reporter to the quencher prevents detection of its fluorescence; breakdown of the probe by the 5' to 3' exonuclease activity of the Taq polymerase breaks the reporter-quencher proximity and thus allows unquenched emission of fluorescence, which can be detected after excitation with a laser. An increase in the product targeted by the reporter probe at each PCR cycle therefore causes a proportional increase in fluorescence due to the breakdown of the probe and release of the reporter.
- The PCR is prepared as usual (see PCR), and the reporter probe is added.
- As the reaction commences, during the annealing stage of the PCR both probe and primers anneal to the DNA target.
- Polymerisation of a new DNA strand is initiated from the primers, and once the polymerase reaches the probe, its 5'-3'-exonuclease degrades the probe, physically separating the fluorescent reporter from the quencher, resulting in an increase in fluorescence.
- Fluorescence is detected and measured in a real-time PCR machine, and its geometric increase corresponding to exponential increase of the product is used to determine the quantification cycle (Cq) in each reaction.
Fusion temperature analysis
[edit]
Real-time PCR permits the identification of specific, amplified DNA fragments using analysis of their melting temperature (also called Tm value, from melting temperature). The method used is usually PCR with double-stranded DNA-binding dyes as reporters and the dye used is usually SYBR Green. The DNA melting temperature is specific to the amplified fragment. The results of this technique are obtained by comparing the dissociation curves of the analysed DNA samples.[11]
Unlike conventional PCR, this method avoids the previous use of electrophoresis techniques to demonstrate the results of all the samples. This is because, despite being a kinetic technique, quantitative PCR is usually evaluated at a distinct end point. The technique therefore usually provides more rapid results and/or uses fewer reactants than electrophoresis. If subsequent electrophoresis is required it is only necessary to test those samples that real time PCR has shown to be doubtful and/or to ratify the results for samples that have tested positive for a specific determinant.
Modeling
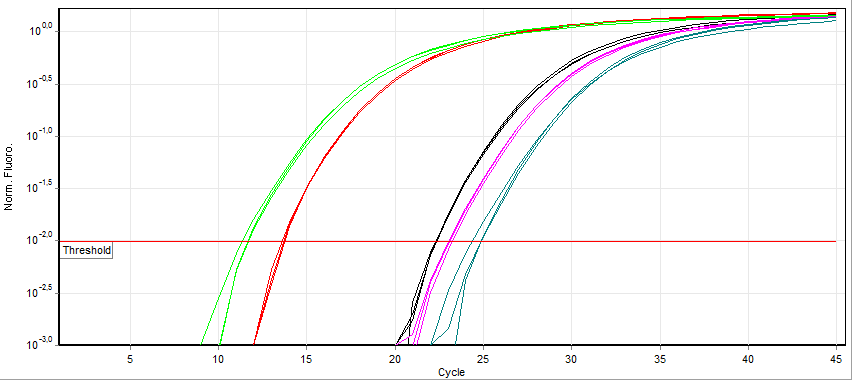
[edit]Unlike end point PCR (conventional PCR), real time PCR allows monitoring of the desired product at any point in the amplification process by measuring fluorescence (in real time frame, measurement is made of its level over a given threshold). A commonly employed method of DNA quantification by real-time PCR relies on plotting fluorescence against the number of cycles on a logarithmic scale. A threshold for detection of DNA-based fluorescence is set 3–5 times of the standard deviation of the signal noise above background. The number of cycles at which the fluorescence exceeds the threshold is called the threshold cycle (Ct) or, according to the MIQE guidelines, quantification cycle (Cq).[1] Using this method, the greater the amount of starting mRNA, the lower the Cq.
During the exponential amplification phase, the quantity of the target DNA template (amplicon) doubles every cycle. For example, a DNA sample whose Cq precedes that of another sample by 3 cycles contained 23 = 8 times more template. However, the efficiency of amplification is often variable among primers and templates. Therefore, the efficiency of a primer-template combination is assessed in a titration experiment with serial dilutions of DNA template to create a standard curve of the change in (Cq) with each dilution. The slope of the linear regression is then used to determine the efficiency of amplification, which is 100% if a dilution of 1:2 results in a (Cq) difference of 1. The cycle threshold method makes several assumptions of reaction mechanism and has a reliance on data from low signal-to-noise regions of the amplification profile that can introduce substantial variance during the data analysis.[12]
To quantify gene expression, the (Cq) for an RNA or DNA from the gene of interest is subtracted from the (Cq) of RNA/DNA from a housekeeping gene in the same sample to normalize for variation in the amount and quality of RNA between different samples. This normalization procedure is commonly called the ΔCt-method[13] and permits comparison of expression of a gene of interest among different samples. However, for such comparison, expression of the normalizing reference gene needs to be very similar across all the samples. Choosing a reference gene fulfilling this criterion is therefore of high importance, and often challenging, because only very few genes show equal levels of expression across a range of different conditions or tissues.[14][15] Although cycle threshold analysis is integrated with many commercial software systems, there are more accurate and reliable methods of analysing amplification profile data that should be considered in cases where reproducibility is a concern.[12]
Mechanism-based qPCR quantification methods have also been suggested, and have the advantage that they do not require a standard curve for quantification. Methods such as MAK2[16] have been shown to have equal or better quantitative performance to standard curve methods. These mechanism-based methods use knowledge about the polymerase amplification process to generate estimates of the original sample concentration. An extension of this approach includes an accurate model of the entire PCR reaction profile, which allows for the use of high signal-to-noise data and the ability to validate data quality prior to analysis.[12]
According to research of Ruijter et al.[17] MAK2 assumes constant amplification efficiency during the PCR reaction. However, theoretical analysis of polymerase chain reaction, from which MAK2 was derived, has revealed that amplification efficiency is not constant throughout PCR. While MAK2 quantification provides reliable estimates of target DNA concentration in a sample under normal qPCR conditions, MAK2 does not reliably quantify target concentration for qPCR assays with competimeters.
Applications
[edit]There are numerous applications for quantitative polymerase chain reaction in the laboratory. It is commonly used for both diagnostic and basic research. Uses of the technique in industry include the quantification of microbial load in foods or on vegetable matter, the detection of GMOs (genetically modified organisms) and the quantification and genotyping of human viral pathogens.
Quantification of gene expression
[edit]Quantifying gene expression by traditional DNA detection methods is unreliable. Detection of mRNA on a northern blot or PCR products on a gel or Southern blot does not allow precise quantification.[18] For example, over the 20–40 cycles of a typical PCR, the amount of DNA product reaches a plateau that is not directly correlated with the amount of target DNA in the initial PCR.[19]
Real-time PCR can be used to quantify nucleic acids by two common methods: relative quantification and absolute quantification.[20] Absolute quantification gives the exact number of target DNA molecules by comparison with DNA standards using a calibration curve. It is therefore essential that the PCR of the sample and the standard have the same amplification efficiency.[21] Relative quantification is based on internal reference genes to determine fold-differences in expression of the target gene. The quantification is expressed as the change in expression levels of mRNA interpreted as complementary DNA (cDNA, generated by reverse transcription of mRNA). Relative quantification is easier to carry out as it does not require a calibration curve as the amount of the studied gene is compared to the amount of a control reference gene.
As the units used to express the results of relative quantification are unimportant the results can be compared across a number of different RTqPCR. The reason for using one or more housekeeping genes is to correct non-specific variation, such as the differences in the quantity and quality of RNA used, which can affect the efficiency of reverse transcription and therefore that of the whole PCR process. However, the most crucial aspect of the process is that the reference gene must be stable.[22]
The selection of these reference genes was traditionally carried out in molecular biology using qualitative or semi-quantitative studies such as the visual examination of RNA gels, northern blot densitometry or semi-quantitative PCR (PCR mimics). Now, in the genome era, it is possible to carry out a more detailed estimate for many organisms using transcriptomic technologies.[23] However, research has shown that amplification of the majority of reference genes used in quantifying the expression of mRNA varies according to experimental conditions.[24][25][26] It is therefore necessary to carry out an initial statistically sound methodological study in order to select the most suitable reference gene.
A number of statistical algorithms have been developed that can detect which gene or genes are most suitable for use under given conditions. Those like geNORM or BestKeeper can compare pairs or geometric means for a matrix of different reference genes and tissues.[4][6] The entire qPCR analysis workflow with proper error propagations is implemented in GenEx.
Diagnostic uses
[edit]Diagnostic qualitative PCR is applied to rapidly detect nucleic acids that are diagnostic of, for example, infectious diseases,[27][28] cancer and genetic abnormalities. The introduction of qualitative PCR assays to the clinical microbiology laboratory has significantly improved the diagnosis of infectious diseases,[29] and is deployed as a tool to detect newly emerging diseases, such as new strains of flu and coronavirus,[30] in diagnostic tests.[31][32]
Microbiological uses
[edit]Quantitative PCR is also used by microbiologists working in the fields of food safety, food spoilage and fermentation and for the microbial risk assessment of water quality (drinking and recreational waters) and in public health protection.[33]
qPCR may also be used to amplify taxonomic or functional markers of genes in DNA taken from environmental samples.[34] Markers are represented by genetic fragments of DNA or complementary DNA.[34] By amplifying a certain genetic element, one can quantify the amount of the element in the sample prior to amplification.[34] Using taxonomic markers (ribosomal genes) and qPCR can help determine the amount of microorganisms in a sample, and can identify different families, genera, or species based on the specificity of the marker.[34] Using functional markers (protein-coding genes) can show gene expression within a community, which may reveal information about the environment.[34]
Detection of phytopathogens
[edit]The agricultural industry is constantly striving to produce plant propagules or seedlings that are free of pathogens in order to prevent economic losses and safeguard health. Systems have been developed that allow detection of small amounts of the DNA of Phytophthora ramorum, an oomycete that kills oaks and other species, mixed in with the DNA of the host plant. Discrimination between the DNA of the pathogen and the plant is based on the amplification of ITS sequences, spacers located in ribosomal RNA gene's coding area, which are characteristic for each taxon.[35] Field-based versions of this technique have also been developed for identifying the same pathogen.[36]
Detection of genetically modified organisms
[edit]qPCR using reverse transcription (RT-qPCR) can be used to detect GMOs given its sensitivity and dynamic range in detecting DNA. Alternatives such as DNA or protein analysis are usually less sensitive. Specific primers are used that amplify not the transgene but the promoter, terminator or even intermediate sequences used during the process of engineering the vector. As the process of creating a transgenic plant normally leads to the insertion of more than one copy of the transgene its quantity is also commonly assessed. This is often carried out by relative quantification using a control gene from the treated species that is only present as a single copy.[37][38]
Clinical quantification and genotyping
[edit]Viruses can be present in humans due to direct infection or co-infections which makes diagnosis difficult using classical techniques and can result in an incorrect prognosis and treatment. The use of qPCR allows both the quantification and genotyping (characterization of the strain, carried out using melting curves) of a virus such as the hepatitis B virus.[39] The degree of infection, quantified as the copies of the viral genome per unit of the patient's tissue, is relevant in many cases; for example, the probability that the type 1 herpes simplex virus reactivates is related to the number of infected neurons in the ganglia.[40] This quantification is carried out either with reverse transcription or without it, as occurs if the virus becomes integrated in the human genome at any point in its cycle, such as happens in the case of HPV (human papillomavirus), where some of its variants are associated with the appearance of cervical cancer.[41] Real-time PCR has also brought the quantization of human cytomegalovirus (CMV) which is seen in patients who are immunosuppressed following solid organ or bone marrow transplantation.[42]
References
[edit]- ^ a b Bustin, Stephen A; Benes, Vladimir; Garson, Jeremy A; Hellemans, Jan; Huggett, Jim; Kubista, Mikael; Mueller, Reinhold; Nolan, Tania; Pfaffl, Michael W; Shipley, Gregory L; Vandesompele, Jo; Wittwer, Carl T (1 April 2009). "The MIQE Guidelines: Minimum Information for Publication of Quantitative Real-Time PCR Experiments". Clinical Chemistry. 55 (4): 611–622. doi:10.1373/clinchem.2008.112797. PMID 19246619.
- ^ Logan, Julie; Edwards, Kirstin & Saunders, Nick, eds. (2009). Real-Time PCR: Current Technology and Applications. Caister Academic Press. ISBN 978-1-904455-39-4.
- ^ Watson, J D; Baker, T A; Bell, S P; Gann, A; Levine, M; Losick, R (2004). Molecular Biology of the Gene (Fifth ed.). San Francisco: Benjamin Cummings. ISBN 978-0-321-22368-5.
- ^ a b c Pfaffl, MW; Tichopad, A; Prgomet, C; Neuvians, TP (March 2004). "Determination of stable housekeeping genes, differentially regulated target genes and sample integrity: BestKeeper--Excel-based tool using pair-wise correlations". Biotechnology Letters. 26 (6): 509–15. doi:10.1023/b:bile.0000019559.84305.47. PMID 15127793. S2CID 977404.
- ^ Pfaffl, MW; Horgan, GW; Dempfle, L (2002). "Relative Expression Software Tool (REST©) for group wise comparison and statistical analysis of relative expression results in real-time PCR". Nucleic Acids Res. 30 (9) e36. doi:10.1093/nar/30.9.e36. PMC 113859. PMID 11972351.
- ^ a b Vandesompele, J; De Preter, K; Pattyn, F; Poppe, B; Van Roy, N; De Paepe, A; Speleman, F (2002). "Accurate normalization of real-time quantitative RT-PCR data by geometric averaging of multiple internal control genes". Genome Biology. 3 (7): 1–12. doi:10.1186/gb-2002-3-7-research0034. PMC 126239. PMID 12184808.
- ^ Rychlik, W.; Spencer, W.J.; Rhoads, R.E. (1990). "Optimization of the annealing temperature for DNA amplification in vitro". Nucleic Acids Research. 18 (21): 6409–6412. doi:10.1093/nar/18.21.6409. PMC 332522. PMID 2243783.
- ^ Pfaffl, Michael (2000). "Development and Validation of an Externally Standardized Quantitative Insulin-like Growth Factor-1 RT-PCR Using LightCycler SYBR Green I Technology" (PDF). Biochemica (3) – via gene-quantification.org.
- ^ Sambrook, Joseph; Russel, David W. (2001). Molecular Cloning: A Laboratory Manual (3rd ed.). Cold Spring Harbor, N.Y.: Cold Spring Harbor Laboratory Press. ISBN 978-0-87969-576-7.
- ^ Ponchel, Frederique; Toomes, Carmel; Bransfield, Kieran; Leong, Fong T; Douglas, Susan H; Field, Sarah L; Bell, Sandra M; Combaret, Valerie; Puisieux, Alain; Mighell, Alan J; Robinson, Philip A; Inglehearn, Chris F; Isaacs, John D; Markham, Alex F (13 October 2003). "Real-time PCR based on SYBR-Green I fluorescence: An alternative to the TaqMan assay for a relative quantification of gene rearrangements, gene amplifications and micro gene deletions". BMC Biotechnology. 3 (1) 18. doi:10.1186/1472-6750-3-18. PMC 270040. PMID 14552656.
- ^ Ririe, Kirk M.; Rasmussen, Randy P.; Wittwer, Carl T. (February 1997). "Product Differentiation by Analysis of DNA Melting Curves during the Polymerase Chain Reaction". Analytical Biochemistry. 245 (2): 154–160. doi:10.1006/abio.1996.9916. PMID 9056205.
- ^ a b c Carr, A. C.; Moore, S. D. (2012). Lucia, Alejandro (ed.). "Robust Quantification of Polymerase Chain Reactions Using Global Fitting". PLOS ONE. 7 (5) e37640. Bibcode:2012PLoSO...737640C. doi:10.1371/journal.pone.0037640. PMC 3365123. PMID 22701526.
- ^ Schefe, Jan H.; Lehmann, Kerstin E.; Buschmann, Ivo R.; Unger, Thomas; Funke-Kaiser, Heiko (26 October 2006). "Quantitative real-time RT-PCR data analysis: current concepts and the novel "gene expression's C T difference" formula". Journal of Molecular Medicine. 84 (11): 901–910. doi:10.1007/s00109-006-0097-6. PMID 16972087. S2CID 10427299.
- ^ Nailis, Heleen; Coenye, Tom; Van Nieuwerburgh, Filip; Deforce, Dieter; Nelis, Hans J (December 2006). "Development and evaluation of different normalization strategies for gene expression studies in Candida albicans biofilms by real-time PCR". BMC Molecular Biology. 7 (1) 25. doi:10.1186/1471-2199-7-25. PMC 1557526. PMID 16889665.
- ^ Nolan, Tania; Hands, Rebecca E; Bustin, Stephen A (August 2006). "Quantification of mRNA using real-time RT-PCR". Nature Protocols. 1 (3): 1559–1582. doi:10.1038/nprot.2006.236. PMID 17406449. S2CID 10108148.
- ^ Boggy, Gregory J.; Woolf, Peter J. (30 August 2010). "A Mechanistic Model of PCR for Accurate Quantification of Quantitative PCR Data". PLOS ONE. 5 (8) e12355. Bibcode:2010PLoSO...512355B. doi:10.1371/journal.pone.0012355. PMC 2930010. PMID 20814578.
- ^ Ruijter, Jan M.; Pfaffl, Michael W.; Zhao, Sheng; Spiess, Andrej N.; Boggy, Gregory; Blom, Jochen; Rutledge, Robert G.; Sisti, Davide; Lievens, Antoon; De Preter, Katleen; Derveaux, Stefaan; Hellemans, Jan; Vandesompele, Jo (January 2013). "Evaluation of qPCR curve analysis methods for reliable biomarker discovery: Bias, resolution, precision, and implications". Methods. 59 (1): 32–46. doi:10.1016/j.ymeth.2012.08.011. PMID 22975077.
- ^ Gelerter, Bruce. "PEMF For Treatment Of Corneal Disorders". lemuriatechnologies.com. Archived from the original on 2014-06-09.
- ^ Overbergh, L.; Giulietti, A.; Valckx, D.; Decallonne, R.; Bouillon, R.; Mathieu, C. (2003). "The use of real-time reverse transcriptase PCR for the quantification of cytokine gene expression". Journal of Biomolecular Techniques. 14 (1): 33–43. PMC 2279895. PMID 12901609.
- ^ Dhanasekaran, S.; Doherty, T. Mark; Kenneth, John; TB Trials Study Group (March 2010). "Comparison of different standards for real-time PCR-based absolute quantification". Journal of Immunological Methods. 354 (1–2): 34–39. doi:10.1016/j.jim.2010.01.004. PMID 20109462.
- ^ Bar, Tzachi; Kubista, Mikael; Tichopad, Ales (2011-10-19). "Validation of kinetics similarity in qPCR". Nucleic Acids Research. 40 (4): 1395–1406. doi:10.1093/nar/gkr778. ISSN 0305-1048. PMC 3287174. PMID 22013160.
- ^ Brunner, AM; Yakovlev, IA; Strauss, SH (2004). "Validating internal controls for quantitative plant gene expression studies". BMC Plant Biol. 4 (1) 14. Bibcode:2004BMCPB...4...14B. doi:10.1186/1471-2229-4-14. PMC 515301. PMID 15317655.
- ^ McGettigan, Paul A (2013). "Transcriptomics in the RNA-seq era". Current Opinion in Chemical Biology. 17 (1): 4–11. doi:10.1016/j.cbpa.2012.12.008. PMID 23290152.
- ^ Thellin, O; Zorzi, W; Lakaye, B; De Borman, B; Coumans, B; Henne, G; Grisar, T; Igout, A; Heinen, E (1999). "Housekeeping genes as internal standards: use and limits". J Biotechnol. 75 (2–3): 197–200. doi:10.1016/s0168-1656(99)00163-7. hdl:2268/3661. PMID 10617337.
- ^ Radonic, A; Thulke, S; Mackay, IM; Landt, O; Siegert, W; Nitsche, A (2004). "Guideline for reference gene selection for quantitative real-time PCR". Biochem Biophys Res Commun. 313 (4): 856–862. Bibcode:2004BBRC..313..856R. doi:10.1016/j.bbrc.2003.11.177. PMID 14706621. Archived from the original on 2013-08-02.
- ^ Dheda, K; Huggett, JF; Bustin, SA; Johnson, MA; Rook, G; Zumla, A (2004). "Validation of housekeeping genes for normalizing RNA expression in real-time PCR". BioTechniques. 37 (1): 112–119. doi:10.2144/04371RR03. PMID 15283208.
- ^ Jawerth, Nicole (27 March 2020). "How is the COVID-19 Virus Detected using real time reverse transcription–polymerase chain reaction?". International Atomic Energy Agency. Retrieved 16 February 2023.
- ^ Xiu, Leshan; Binder, Raquel A.; Alarja, Natalie A.; Kochek, Kara; Coleman, Kristen K.; Than, Son T.; Bailey, Emily S.; Bui, Vuong N.; Toh, Teck-Hock; Erdman, Dean D.; Gray, Gregory C. (July 2020). "A RT-PCR assay for the detection of coronaviruses from four genera". Journal of Clinical Virology. 128 104391. doi:10.1016/j.jcv.2020.104391. PMC 7192118. PMID 32403008.
- ^ Espy, M.J. (January 2006). "Real-Time PCR in Clinical Microbiology: Applications for Routine Laboratory Testing". Clinical Microbiology Reviews. 19 (3): 165–256. doi:10.1128/CMR.19.1.165-256.2006. PMC 1360278. PMID 16418529.
- ^ Dhamad, AE; Abdal Rhida, MA (2020). "COVID-19: molecular and serological detection methods". PeerJ. 8 e10180. doi:10.7717/peerj.10180. PMC 7547594. PMID 33083156.
- ^ "FDA-cleared RT-PCR Assays and Other Molecular Assays for Influenza Viruses" (PDF). cdc.gov.
- ^ "rRT-PCR, a method to confirm Wuhan coronavirus case – Artificial Intelligence for Chemistry". 24 January 2020. Retrieved 2020-01-26.
- ^ Filion, M, ed. (2012). Quantitative Real-time PCR in Applied Microbiology. Caister Academic Press. ISBN 978-1-908230-01-0.
- ^ a b c d e Bouchez, T.; Blieux, A. L.; Dequiedt, S.; Domaizon, I.; Dufresne, A.; Ferreira, S.; Godon, J. J.; Hellal, J.; Joulian, C.; Quaiser, A.; Martin-Laurent, F.; Mauffret, A.; Monier, J. M.; Peyret, P.; Schmitt-Koplin, P.; Sibourg, O.; D'oiron, E.; Bispo, A.; Deportes, I.; Grand, C.; Cuny, P.; Maron, P. A.; Ranjard, L. (December 2016). "Molecular microbiology methods for environmental diagnosis". Environmental Chemistry Letters. 14 (4): 423–441. Bibcode:2016EnvCL..14..423B. doi:10.1007/s10311-016-0581-3. S2CID 88827291.
- ^ Baldwin, B.G. (1992). "Phylogenetic utility of the internal transcribed spacers of nuclear ribosomal DNA in plants: An example from the Compositaogy". Molecular Phylogenetics and Evolution. 1 (1): 3–16. Bibcode:1992MolPE...1....3B. doi:10.1016/1055-7903(92)90030-K. PMID 1342921.
- ^ Tomlinson, J. A.; Barker, I.; Boonham, N. (2007). "Faster, Simpler, More-Specific Methods for Improved Molecular Detection of Phytophthora ramorum in the Field". Applied and Environmental Microbiology. 73 (12): 4040–4047. Bibcode:2007ApEnM..73.4040T. doi:10.1128/AEM.00161-07. PMC 1932743. PMID 17449689.
- ^ Holst-Jensen, Arne; Rønning, Sissel B.; Løvseth, Astrid; Berdal, Knut G. (2003). "PCR technology for screening and quantification of genetically modified organisms (GMOs)". Analytical and Bioanalytical Chemistry. 375 (8): 985–993. doi:10.1007/s00216-003-1767-7. PMID 12733008. S2CID 43681211.
- ^ Brodmann P.D; Ilg E.C; Berthoud H; Herrmann A. (2002). "Real-Time Quantitative Polymerase Chain Reaction Methods for Four Genetically Modified Maize Varieties and Maize DNA Content in Food". Journal of AOAC International. 85 (3): 646–653. doi:10.1093/jaoac/85.3.646. PMID 12083257.
- ^ Yeh, Shiou-Hwei; Tsai, Ching-Yi; Kao, Jia-Horng; Liu, Chun-Jen; Kuo, Ti-Jung; Lin, Ming-Wei; Huang, Wen-Ling; Lu, Shu-Fen; Jih, Jane; Chen, Ding-Shinn; Chen, Pei-Jer (October 2004). "Quantification and genotyping of hepatitis B virus in a single reaction by real-time PCR and melting curve analysis". Journal of Hepatology. 41 (4): 659–666. doi:10.1016/j.jhep.2004.06.031. PMID 15464248.
- ^ Sawtell, N. M. (August 1998). "The Probability of In Vivo Reactivation of Herpes Simplex Virus Type 1 Increases with the Number of Latently Infected Neurons in the Ganglia". Journal of Virology. 72 (8): 6888–6892. doi:10.1128/JVI.72.8.6888-6892.1998. PMC 109900. PMID 9658140.
- ^ Peter, M; Rosty, C; Couturier, J; Radvanyi, F; Teshima, H; Sastre-Garau, X (28 September 2006). "MYC activation associated with the integration of HPV DNA at the MYC locus in genital tumors". Oncogene. 25 (44): 5985–5993. doi:10.1038/sj.onc.1209625. PMID 16682952.
- ^ Mackay, Ian M.; Arden, Katherine E.; Nitsche, Andreas (2002-03-15). "Real-time PCR in virology". Nucleic Acids Research. 30 (6): 1292–1305. doi:10.1093/nar/30.6.1292. ISSN 0305-1048. PMC 101343. PMID 11884626.
Bibliography
[edit]- Elyse; Houde, Alain (2002). "La PCR en temps réel: principes et applications" (PDF). Reviews in Biology and Biotechnology. 2 (2): 2–11. Archived from the original (PDF) on 2009-06-12.
- Bustin, SA (2000). "Absolute quantification of mRNA using real-time reverse transcription polymerase chain reaction assays". J Mol Endocrinol. 25 (2): 169–193. doi:10.1677/jme.0.0250169. PMID 11013345.
- Higuchi, R.; Dollinger, G.; Walsh, P.S.; Griffith, R. (1992). "Simultaneous amplification and detection of specific DNA-sequences". Bio-Technology. 10 (4): 413–417. doi:10.1038/nbt0492-413. PMID 1368485. S2CID 1684150.
- Holland, P.M.; Abramson, R.D.; Watson, R.; Gelfand, D.H. (1991). "Detection of specific polymerase chain reaction product by utilizing the 50 !30 exonuclease activity of Thermus aquaticus DNA polymerase". Proc. Natl. Acad. Sci. USA. 88 (16): 7276–7280. Bibcode:1991PNAS...88.7276H. doi:10.1073/pnas.88.16.7276. JSTOR 2357665. PMC 52277. PMID 1871133.
- Kubista, M; Andrade, JM; Bengtsson, M; Forootan, A; Jonak, J; Lind, K; Sindelka, R; Sjoback, R; Sjogreen, B; Strombom, L; Stahlberg, A; Zoric, N (2006). "The real-time polymerase chain reaction". Mol. Aspects Med. 27 (2–3): 95–125. doi:10.1016/j.mam.2005.12.007. PMID 16460794.
- Higuchi, R.; Fockler, C.; Dollinger, G.; Watson, R. (1993). "Kinetic PCR: Real time monitoring of DNA amplification reactions". Biotechnology. 11 (9): 1026–1030. doi:10.1038/nbt0993-1026. PMID 7764001. S2CID 5714001.
- Filion, M. (2012). Quantitative Real-time PCR in Applied Microbiology. Caister Academic Press. ISBN 978-1-908230-01-0.
- Wawrik, B; Paul, JH; Tabita, FR (2002). "Real-time PCR quantification of rbcL (ribulose-1,5-bisphosphate carboxylase/oxygenase) mRNA in diatoms and pelagophytes". Appl. Environ. Microbiol. 68 (8): 3771–3779. Bibcode:2002ApEnM..68.3771W. doi:10.1128/aem.68.8.3771-3779.2002. PMC 123995. PMID 12147471.
- Logan J; Edwards K; Saunders N, eds. (2009). Real-Time PCR: Current Technology and Applications. Caister Academic Press. ISBN 978-1-904455-39-4.