Community hub
Recent from talks
Contribute something
Nothing was collected or created yet.
R (programming language)
View on Wikipedia
| R | |
|---|---|
 Terminal window for R | |
| Paradigms | Multi-paradigm: procedural, object-oriented, functional, reflective, imperative, array[1] |
| Designed by | Ross Ihaka and Robert Gentleman |
| Developer | R Core Team |
| First appeared | August 1993 |
| Stable release | 4.5.1[2] |
| Typing discipline | Dynamic |
| Platform | arm64 and x86-64 |
| License | GPL-2.0-or-later[3] |
| Filename extensions | |
| Website | r-project.org |
| Influenced by | |
| Influenced | |
| |
R is a programming language for statistical computing and data visualization. It has been widely adopted in the fields of data mining, bioinformatics, data analysis, and data science.[9]
The core R language is extended by a large number of software packages, which contain reusable code, documentation, and sample data. Some of the most popular R packages are in the tidyverse collection, which enhances functionality for visualizing, transforming, and modelling data, as well as improves the ease of programming (according to the authors and users).[10]
R is free and open-source software distributed under the GNU General Public License.[3][11] The language is implemented primarily in C, Fortran, and R itself. Precompiled executables are available for the major operating systems (including Linux, MacOS, and Microsoft Windows).
Its core is an interpreted language with a native command line interface. In addition, multiple third-party applications are available as graphical user interfaces; such applications include RStudio (an integrated development environment) and Jupyter (a notebook interface).
History
[edit].jpg)

R was started by professors Ross Ihaka and Robert Gentleman as a programming language to teach introductory statistics at the University of Auckland.[12] The language was inspired by the S programming language, with most S programs able to run unaltered in R.[6] The language was also inspired by Scheme's lexical scoping, allowing for local variables.[1]
The name of the language, R, comes from being both an S language successor and the shared first letter of the authors, Ross and Robert.[13] In August 1993, Ihaka and Gentleman posted a binary file of R on StatLib — a data archive website.[14] At the same time, they announced the posting on the s-news mailing list.[15] On 5 December 1997, R became a GNU project when version 0.60 was released.[16] On 29 February 2000, the 1.0 version was released.[17]
Packages
[edit]
R packages are collections of functions, documentation, and data that expand R.[18] For example, packages can add reporting features (using packages such as RMarkdown, Quarto,[19] knitr, and Sweave) and support for various statistical techniques (such as linear, generalized linear and nonlinear modeling, classical statistical tests, spatial analysis, time-series analysis, and clustering). Ease of package installation and use have contributed to the language's adoption in data science.[20]
Immediately available when starting R after installation, base packages provide the fundamental and necessary syntax and commands for programming, computing, graphics production, basic arithmetic, and statistical functionality.[21]
An example is the tidyverse collection of R packages, which bundles several subsidiary packages to provide a common API. The collection specializes in tasks related to accessing and processing "tidy data",[22] which are data contained in a two-dimensional table with a single row for each observation and a single column for each variable.[23]
Installing a package occurs only once. For example, to install the tidyverse collection:[23]
> install.packages("tidyverse")
To load the functions, data, and documentation of a package, one calls the library() function. To load the tidyverse collection, one can execute the following code:[a]
> # The package name can be enclosed in quotes
> library("tidyverse")

> # But the package name can also be used without quotes
> library(tidyverse)
The Comprehensive R Archive Network (CRAN) was founded in 1997 by Kurt Hornik and Friedrich Leisch to host R's source code, executable files, documentation, and user-created packages.[24] CRAN's name and scope mimic the Comprehensive TeX Archive Network (CTAN) and the Comprehensive Perl Archive Network (CPAN).[24] CRAN originally had only three mirror sites and twelve contributed packages.[25] As of 30 June 2025[update], it has 90 mirrors[26] and 22,390 contributed packages.[27] Packages are also available in repositories such as R-Forge, Omegahat, and GitHub.[28][29][30]
To provide guidance on the CRAN web site, its Task Views area lists packages that are relevant for specific topics; sample topics include causal inference, finance, genetics, high-performance computing, machine learning, medical imaging, meta-analysis, social sciences, and spatial statistics.
The Bioconductor project provides packages for genomic data analysis, complementary DNA, microarray, and high-throughput sequencing methods.
Community
[edit]
There are three main groups that help support R software development:
- The R Core Team was founded in 1997 to maintain the R source code.
- The R Foundation for Statistical Computing was founded in April 2003 to provide financial support.
- The R Consortium is a Linux Foundation project to develop R infrastructure.
The R Journal is an open access, academic journal that features short to medium-length articles on the use and development of R. The journal includes articles on packages, programming tips, CRAN news, and foundation news.
The R community hosts many conferences and in-person meetups.[b] These groups include:
- UseR!: an annual international R user conference (website)
- Directions in Statistical Computing (DSC) (website)
- R-Ladies: an organization to promote gender diversity in the R community (website)
- SatRdays: R-focused conferences held on Saturdays (website)
- Data Science & AI Conferences (website)
- posit::conf (formerly known as rstudio::conf) (website)
On social media sites such as Twitter, the hashtag #rstats can be used to follow new developments in the R community.[31]
Examples
[edit]Hello, World!
[edit]The following is a "Hello, World!" program:
> print("Hello, World!")
[1] "Hello, World!"
Here is an alternative version, which uses the cat() function:
> cat("Hello, World!")
Hello, World!
Basic syntax
[edit]The following examples illustrate the basic syntax of the language and use of the command-line interface.[c]
In R, the generally preferred assignment operator is an arrow made from two characters <-, although = can be used in some cases.[32]
> x <- 1:6 # Create a numeric vector in the current environment
> y <- x^2 # Similarly, create a vector based on the values in x.
> print(y) # Print the vector’s contents.
[1]  1  4  9 16 25 36

> z <- x + y # Create a new vector that is the sum of x and y
> z # Return the contents of z to the current environment.
[1]  2  6 12 20 30 42

> z_matrix <- matrix(z, nrow = 3) # Create a new matrix that transforms the vector z into a 3x2 matrix object
> z_matrix
     [,1] [,2]
[1,]    2   20
[2,]    6   30
[3,]   12   42

> 2 * t(z_matrix) - 2 # Transpose the matrix; multiply every element by 2; subtract 2 from each element in the matrix; and then return the results to the terminal.
     [,1] [,2] [,3]
[1,]    2   10   22
[2,]   38   58   82

> new_df <- data.frame(t(z_matrix), row.names = c("A", "B")) # Create a new dataframe object that contains the data from a transposed z_matrix, with row names 'A' and 'B'
> names(new_df) <- c("X", "Y", "Z") # Set the column names of the new_df dataframe as X, Y, and Z.
> print(new_df)  # Print the current results.
   X  Y  Z
A  2  6 12
B 20 30 42

> new_df$Z # Output the Z column
[1] 12 42

> new_df$Z == new_df['Z'] && new_df[3] == new_df$Z # The dataframe column Z can be accessed using the syntax $Z, ['Z'], or [3], and the values are the same.
[1] TRUE

> attributes(new_df) # Print information about attributes of the new_df dataframe
$names
[1] "X" "Y" "Z"

$row.names
[1] "A" "B"

$class
[1] "data.frame"

> attributes(new_df)$row.names <- c("one", "two") # Access and then change the row.names attribute; this can also be done using the rownames() function
> new_df
     X  Y  Z
one  2  6 12
two 20 30 42
Structure of a function
[edit]R is able to create functions that add new functionality for code reuse.[33] Objects created within the body of the function (which are enclosed by curly brackets) remain accessible only from within the function, and any data type may be returned. In R, almost all functions and all user-defined functions are closures.[34]
The following is an example of creating a function to perform an arithmetic calculation:
# The function's input parameters are x and y.
# The function, named f, returns a linear combination of x and y.
f <- function(x, y) {
  z <- 3 * x + 4 * y

  # An explicit return() statement is optional--it could be replaced with simply `z` in this case.
  return(z)
}

# As an alternative, the last statement executed in a function is returned implicitly.
f <- function(x, y) 3 * x + 4 * y
The following is some output from using the function defined above:
> f(1, 2) #  3 * 1 + 4 * 2 = 3 + 8
[1] 11

> f(c(1, 2, 3), c(5, 3, 4)) # Element-wise calculation
[1] 23 18 25

> f(1:3, 4) # Equivalent to f(c(1, 2, 3), c(4, 4, 4))
[1] 19 22 25
It is possible to define functions to be used as infix operators by using the special syntax `%name%`, where "name" is the function variable name:
> `%sumx2y2%` <- function(e1, e2) {e1 ^ 2 + e2 ^ 2}
> 1:3 %sumx2y2% -(1:3)
[1]  2  8 18
Since R version 4.1.0, functions can be written in a short notation, which is useful for passing anonymous functions to higher-order functions:[35]
> sapply(1:5, \(i) i^2)    # here \(i) is the same as function(i)
[1]  1  4  9 16 25
Native pipe operator
[edit]In R version 4.1.0, a native pipe operator, |>, was introduced.[36] This operator allows users to chain functions together, rather than using nested function calls.
> nrow(subset(mtcars, cyl == 4)) # Nested without the pipe character
[1] 11

> mtcars |> subset(cyl == 4) |> nrow() # Using the pipe character
[1] 11
An alternative to nested functions is the use of intermediate objects, rather than the pipe operator:
> mtcars_subset_rows <- subset(mtcars, cyl == 4)
> num_mtcars_subset <- nrow(mtcars_subset_rows)
> print(num_mtcars_subset)
[1] 11
While the pipe operator can produce code that is easier to read, influential R programmers like Hadley Wickham suggest to chain together at most 10-15 lines of code using this operator and saving them into objects having meaningful names to avoid code obfuscation.[37]
Object-oriented programming
[edit]The R language has native support for object-oriented programming. There are two native frameworks, the so-called S3 and S4 systems. The former, being more informal, supports single dispatch on the first argument, and objects are assigned to a class simply by setting a "class" attribute in each object. The latter is a system like the Common Lisp Object System (CLOS), with formal classes (also derived from S) and generic methods, which supports multiple dispatch and multiple inheritance[38]
In the example below, summary() is a generic function that dispatches to different methods depending on whether its argument is a numeric vector or a factor:
> data <- c("a", "b", "c", "a", NA)
> summary(data)
   Length     Class      Mode
        5 character character
> summary(as.factor(data))
   a    b    c NA's
   2    1    1    1
Modeling and plotting
[edit]
plot.lm() function). Mathematical notation is allowed in labels, as shown in the lower left plot.The R language has built-in support for data modeling and graphics. The following example shows how R can generate and plot a linear model with residuals.
# Create x and y values
x <- 1:6
y <- x^2

# Linear regression model: y = A + B * x
model <- lm(y ~ x)

# Display an in-depth summary of the model
summary(model)

# Create a 2-by-2 layout for figures
par(mfrow = c(2, 2))

# Output diagnostic plots of the model
plot(model)
The output from the summary() function in the preceding code block is as follows:
Residuals:
      1       2       3       4       5       6       7       8      9      10
 3.3333 -0.6667 -2.6667 -2.6667 -0.6667  3.3333

Coefficients:
            Estimate Std. Error t value Pr(>|t|)
(Intercept)  -9.3333     2.8441  -3.282 0.030453 *
x             7.0000     0.7303   9.585 0.000662 ***
---
Signif. codes:  0 ‘***’ 0.001 ‘**’ 0.01 ‘*’ 0.05 ‘.’ 0.1 ‘ ’ 1

Residual standard error: 3.055 on 4 degrees of freedom
Multiple R-squared:  0.9583, Adjusted R-squared:  0.9478
F-statistic: 91.88 on 1 and 4 DF,  p-value: 0.000662
Mandelbrot set
[edit]
This example of a Mandelbrot set highlights the use of complex numbers. It models the first 20 iterations of the equation z = z2 + c, where c represents different complex constants.
To run this sample code, it is necessary to first install the package that provides the write.gif() function:
install.packages("caTools")
The sample code is as follows:
library(caTools)

jet.colors <-
    colorRampPalette(
        c("green", "pink", "#007FFF", "cyan", "#7FFF7F",
          "white", "#FF7F00", "red", "#7F0000"))

dx <- 1500 # define width
dy <- 1400 # define height

C  <-
    complex(
            real = rep(seq(-2.2, 1.0, length.out = dx), each = dy),
            imag = rep(seq(-1.2, 1.2, length.out = dy), times = dx)
            )

# reshape as matrix of complex numbers
C <- matrix(C, dy, dx)

# initialize output 3D array
X <- array(0, c(dy, dx, 20))

Z <- 0

# loop with 20 iterations
for (k in 1:20) {

  # the central difference equation
  Z <- Z^2 + C

  # capture the results
  X[, , k] <- exp(-abs(Z))
}

write.gif(
    X,
    "Mandelbrot.gif",
    col = jet.colors,
    delay = 100)
Version names
[edit]
All R version releases from 2.14.0 onward have codenames that make reference to Peanuts comics and films.[39][40][41]
In 2018, core R developer Peter Dalgaard presented a history of R releases since 1997.[42] Some notable early releases before the named releases include the following:
- Version 1.0.0, released on 29 February 2000, a leap day
- Version 2.0.0, released on 4 October 2004, "which at least had a nice ring to it"[42]
The idea of naming R version releases was inspired by the naming system for Debian and Ubuntu versions. Dalgaard noted an additional reason for the use of Peanuts references in R codenames—the humorous observation that "everyone in statistics is a P-nut."[42]
| Version | Release date | Name | Peanuts reference | Reference |
|---|---|---|---|---|
| 4.5.1 | 2025-06-13 | Great Square Root | [43] | [44] |
| 4.5.0 | 2025-04-11 | How About a Twenty-Six | [45] | [46] |
| 4.4.3 | 2025-02-28 | Trophy Case | [47] | [48] |
| 4.4.2 | 2024-10-31 | Pile of Leaves | [49] | [50] |
| 4.4.1 | 2024-06-14 | Race for Your Life | [51] | [52] |
| 4.4.0 | 2024-04-24 | Puppy Cup | [53] | [54] |
| 4.3.3 | 2024-02-29 | Angel Food Cake | [55] | [56] |
| 4.3.2 | 2023-10-31 | Eye Holes | [57] | [58] |
| 4.3.1 | 2023-06-16 | Beagle Scouts | [59] | [60] |
| 4.3.0 | 2023-04-21 | Already Tomorrow | [61][62][63] | [64] |
| 4.2.3 | 2023-03-15 | Shortstop Beagle | [65] | [66] |
| 4.2.2 | 2022-10-31 | Innocent and Trusting | [67] | [68] |
| 4.2.1 | 2022-06-23 | Funny-Looking Kid | [69][70][71][72][73][74] | [75] |
| 4.2.0 | 2022-04-22 | Vigorous Calisthenics | [76] | [77] |
| 4.1.3 | 2022-03-10 | One Push-Up | [76] | [78] |
| 4.1.2 | 2021-11-01 | Bird Hippie | [79][80] | [78] |
| 4.1.1 | 2021-08-10 | Kick Things | [81] | [82] |
| 4.1.0 | 2021-05-18 | Camp Pontanezen | [83] | [84] |
| 4.0.5 | 2021-03-31 | Shake and Throw | [85] | [86] |
| 4.0.4 | 2021-02-15 | Lost Library Book | [87][88][89] | [90] |
| 4.0.3 | 2020-10-10 | Bunny-Wunnies Freak Out | [91] | [92] |
| 4.0.2 | 2020-06-22 | Taking Off Again | [93] | [94] |
| 4.0.1 | 2020-06-06 | See Things Now | [95] | [96] |
| 4.0.0 | 2020-04-24 | Arbor Day | [97] | [98] |
| 3.6.3 | 2020-02-29 | Holding the Windsock | [99] | [100] |
| 3.6.2 | 2019-12-12 | Dark and Stormy Night | See It was a dark and stormy night#Literature[101] | [102] |
| 3.6.1 | 2019-07-05 | Action of the Toes | [103] | [104] |
| 3.6.0 | 2019-04-26 | Planting of a Tree | [105] | [106] |
| 3.5.3 | 2019-03-11 | Great Truth | [107] | [108] |
| 3.5.2 | 2018-12-20 | Eggshell Igloos | [109] | [110] |
| 3.5.1 | 2018-07-02 | Feather Spray | [111] | [112] |
| 3.5.0 | 2018-04-23 | Joy in Playing | [113] | [114] |
| 3.4.4 | 2018-03-15 | Someone to Lean On | [115][116][117] | [118] |
| 3.4.3 | 2017-11-30 | Kite-Eating Tree | See Kite-Eating Tree[119] | [120] |
| 3.4.2 | 2017-09-28 | Short Summer | See It Was a Short Summer, Charlie Brown | [121] |
| 3.4.1 | 2017-06-30 | Single Candle | [122] | [123] |
| 3.4.0 | 2017-04-21 | You Stupid Darkness | [122] | [124] |
| 3.3.3 | 2017-03-06 | Another Canoe | [125] | [126] |
| 3.3.2 | 2016-10-31 | Sincere Pumpkin Patch | [127] | [128] |
| 3.3.1 | 2016-06-21 | Bug in Your Hair | [129] | [130] |
| 3.3.0 | 2016-05-03 | Supposedly Educational | [131] | [132] |
| 3.2.5 | 2016-04-11 | Very, Very Secure Dishes | [133] | [134][135][136] |
| 3.2.4 | 2016-03-11 | Very Secure Dishes | [133] | [137] |
| 3.2.3 | 2015-12-10 | Wooden Christmas-Tree | See A Charlie Brown Christmas[138] | [139] |
| 3.2.2 | 2015-08-14 | Fire Safety | [140][141] | [142] |
| 3.2.1 | 2015-06-18 | World-Famous Astronaut | [143] | [144] |
| 3.2.0 | 2015-04-16 | Full of Ingredients | [145] | [146] |
| 3.1.3 | 2015-03-09 | Smooth Sidewalk | [147][page needed] | [148] |
| 3.1.2 | 2014-10-31 | Pumpkin Helmet | See You're a Good Sport, Charlie Brown | [149] |
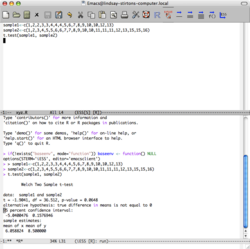
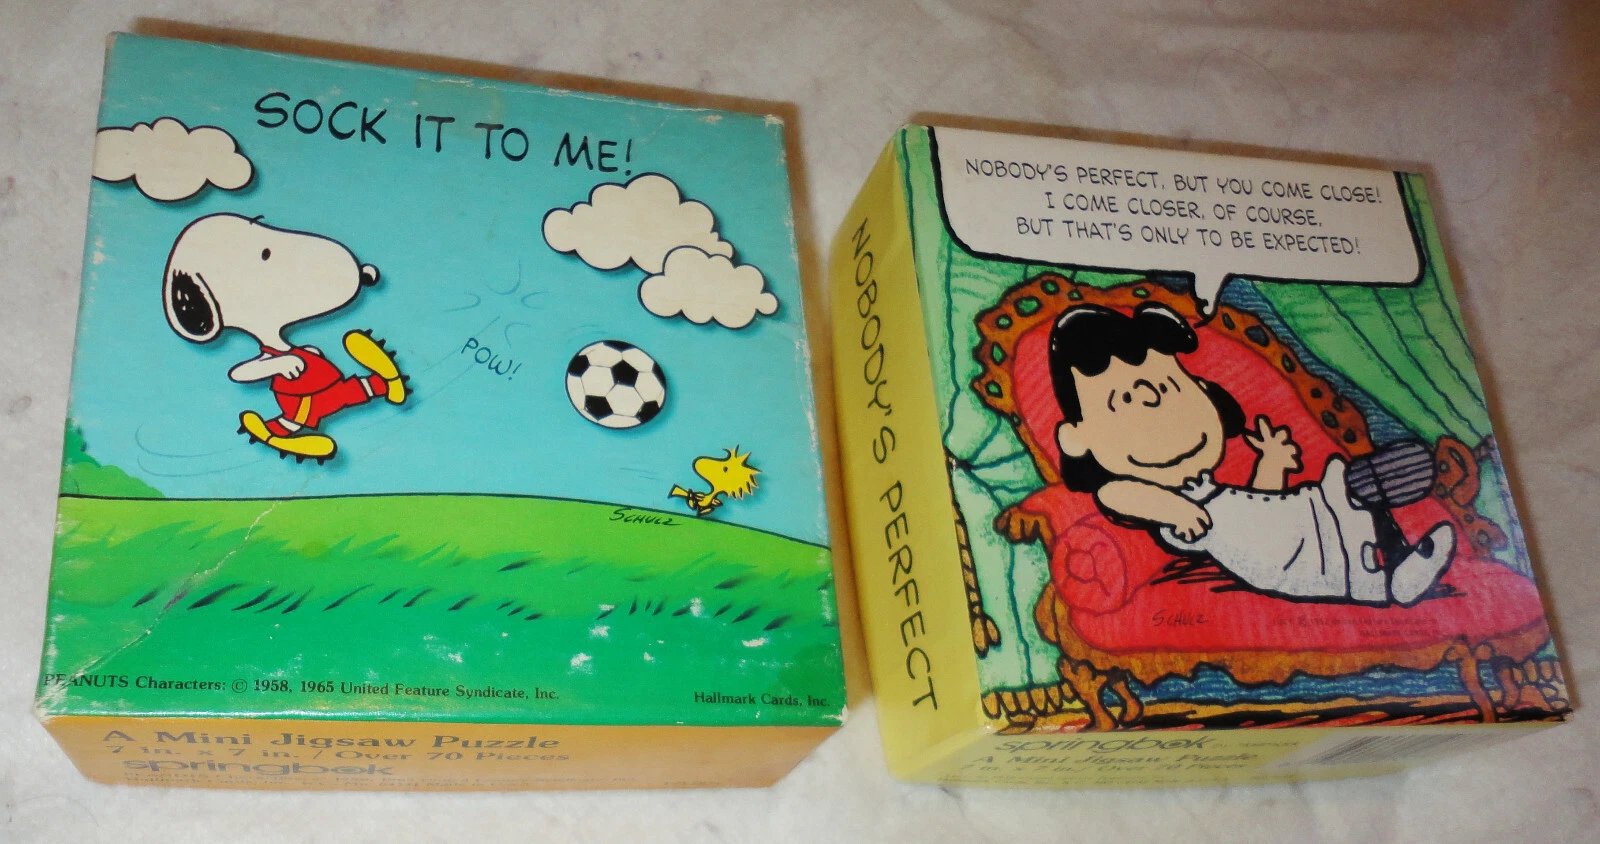
| 3.1.1 | 2014-07-10 | Sock it to Me | [150][151][152][153] | [154] |
| 3.1.0 | 2014-04-10 | Spring Dance | [103] | [155] |
| 3.0.3 | 2014-03-06 | Warm Puppy | [156] | [157] |
| 3.0.2 | 2013-09-25 | Frisbee Sailing | [158] | [159] |
| 3.0.1 | 2013-05-16 | Good Sport | [160] | [161] |
| 3.0.0 | 2013-04-03 | Masked Marvel | [162] | [163] |
| 2.15.3 | 2013-03-01 | Security Blanket | [164] | [165] |
| 2.15.2 | 2012-10-26 | Trick or Treat | [166] | [167] |
| 2.15.1 | 2012-06-22 | Roasted Marshmallows | [168] | [169] |
| 2.15.0 | 2012-03-30 | Easter Beagle | [170] | [171] |
| 2.14.2 | 2012-02-29 | Gift-Getting Season | See It's the Easter Beagle, Charlie Brown[172] | [173] |
| 2.14.1 | 2011-12-22 | December Snowflakes | [174] | [175] |
| 2.14.0 | 2011-10-31 | Great Pumpkin | See It's the Great Pumpkin, Charlie Brown[176] | [177] |
| r-devel | N/A | Unsuffered Consequences | [178] | [42] |
Interfaces
[edit]-
 Screenshot of the RKWard front-end running on the KDE 4 environment
 -
 R running in the emacs editor with the ESS package
 -


.png)
R is installed with a command line console by default, but there are multiple ways to interface with the language:
- Integrated development environment (IDE):
- R.app[179] (OSX/macOS only)
- Rattle GUI
- R Commander
- RKWard
- RStudio
- Positron[180]
- Tinn-R[181]
- General-purpose IDEs:
- Eclipse via the StatET plugin
- Visual Studio via R Tools for Visual Studio.
- Source-code editors:
- Other scripting languages:
- Python (website)
- Perl (website)
- Ruby (source code)
- F# (website)
- Julia (source code).
- General-purpose programming languages:
- Java via the Rserve socket server
- .NET C# (website)
Statistical frameworks that use R in the background include Jamovi and JASP.[citation needed]
Implementations
[edit]The main R implementation is written primarily in C, Fortran, and R itself. Other implementations include the following:
- pretty quick R (pqR), by Radford M. Neal, which attempts to improve memory management.
- Renjin for the Java Virtual Machine.
- CXXR and Riposte[182] written in C++.
- Oracle's FastR built on GraalVM.
- TIBCO Enterprise Runtime for R (TERR) to integrate with Spotfire.[183] (The company also created S-Plus, an implementation of the S language.)
Microsoft R Open (MRO) was an R implementation. As of 30 June 2021, Microsoft began to phase out MRO in favor of the CRAN distribution.[184]
Commercial support
[edit]
Although R is an open-source project, some companies provide commercial support:
- Oracle provides commercial support for its Big Data Appliance, which integrates R into its other products.
- IBM provides commercial support for execution of R within Hadoop.
See also
[edit]Notes
[edit]- ^ This code displays to standard error a listing of all the packages that the tidyverse collection depends upon. The code may also display warnings showing namespace conflicts, which may typically be ignored.
- ^ Information about conferences and meetings is available in a community-maintained list on GitHub, jumpingrivers
.github .io /meetingsR / - ^ An expanded list of standard language features can be found in the manual "An Introduction to R", cran
.r-project .org /doc /manuals /R-intro .pdf
References
[edit]- ^ a b c Morandat, Frances; Hill, Brandon; Osvald, Leo; Vitek, Jan (11 June 2012). "Evaluating the design of the R language: objects and functions for data analysis". European Conference on Object-Oriented Programming. 2012: 104–131. doi:10.1007/978-3-642-31057-7_6. Retrieved 17 May 2016 – via SpringerLink.
- ^ Peter Dalgaard (13 June 2025). "R 4.5.1 is released". Retrieved 14 June 2025.
- ^ a b "R - Free Software Directory". directory.fsf.org. Retrieved 26 January 2024.
- ^ "R scripts". mercury.webster.edu. Retrieved 17 July 2021.
- ^ "R Data Format Family (.rdata, .rda)". Loc.gov. 9 June 2017. Retrieved 17 July 2021.
- ^ a b Hornik, Kurt; The R Core Team (12 April 2022). "R FAQ". The Comprehensive R Archive Network. 3.3 What are the differences between R and S?. Archived from the original on 28 December 2022. Retrieved 27 December 2022.
- ^ "Introduction". The Julia Manual. Archived from the original on 20 June 2018. Retrieved 5 August 2018.
- ^ "Comparison with R". pandas Getting started. Retrieved 15 July 2024.
- ^ Giorgi, Federico M.; Ceraolo, Carmine; Mercatelli, Daniele (27 April 2022). "The R Language: An Engine for Bioinformatics and Data Science". Life. 12 (5): 648. Bibcode:2022Life...12..648G. doi:10.3390/life12050648. PMC 9148156. PMID 35629316.
- ^ "Home - RDocumentation". www.rdocumentation.org. Retrieved 13 June 2025.
- ^ "R: What is R?". www.r-project.org. Retrieved 10 May 2025.
- ^ Ihaka, Ross. "The R Project: A Brief History and Thoughts About the Future" (PDF). p. 12. Archived (PDF) from the original on 28 December 2022. Retrieved 27 December 2022.
We set a goal of developing enough of a language to teach introductory statistics courses at Auckland.
- ^ Hornik, Kurt; The R Core Team (12 April 2022). "R FAQ". The Comprehensive R Archive Network. 2.13 What is the R Foundation?. Archived from the original on 28 December 2022. Retrieved 28 December 2022.
- ^ "Index of /datasets". lib.stat.cmu.edu. Retrieved 5 September 2024.
- ^ Ihaka, Ross. "R: Past and Future History" (PDF). p. 4. Archived (PDF) from the original on 28 December 2022. Retrieved 28 December 2022.
- ^ Ihaka, Ross (5 December 1997). "New R Version for Unix". stat.ethz.ch. Archived from the original on 12 February 2023. Retrieved 12 February 2023.
- ^ Ihaka, Ross. "The R Project: A Brief History and Thoughts About the Future" (PDF). p. 18. Archived (PDF) from the original on 28 December 2022. Retrieved 27 December 2022.
- ^ Wickham, Hadley; Cetinkaya-Rundel, Mine; Grolemund, Garrett (2023). R for Data Science, Second Edition. O'Reilly. p. xvii. ISBN 978-1-492-09740-2.
- ^ "Quarto". Quarto. Retrieved 5 September 2024.
- ^ Chambers, John M. (2020). "S, R, and Data Science". The R Journal. 12 (1): 462–476. doi:10.32614/RJ-2020-028. ISSN 2073-4859.
The R language and related software play a major role in computing for data science. ... R packages provide tools for a wide range of purposes and users.
- ^ Davies, Tilman M. (2016). "Installing R and Contributed Packages". The Book of R: A First Course in Programming and Statistics. San Francisco, California: No Starch Press. p. 739. ISBN 9781593276515.
- ^ Wickham, Hadley (2014). "Tidy Data" (PDF). Journal of Statistical Software. 59 (10). doi:10.18637/jss.v059.i10.
- ^ a b Wickham, Hadley; Cetinkaya-Rundel, Mine; Grolemund, Garrett (2023). R for Data Science, Second Edition. O'Reilly. ISBN 978-1-492-09740-2.
- ^ a b Hornik, Kurt (2012). "The Comprehensive R Archive Network". WIREs Computational Statistics. 4 (4): 394–398. doi:10.1002/wics.1212. ISSN 1939-5108. S2CID 62231320.
- ^ Kurt Hornik (23 April 1997). "Announce: CRAN". r-help. Wikidata Q101068595..
- ^ "The Status of CRAN Mirrors". cran.r-project.org. Retrieved 16 October 2024.
- ^ "CRAN - Contributed Packages". cran.r-project.org. Retrieved 16 October 2024.
- ^ "R-Forge: Welcome". r-forge.r-project.org. Retrieved 5 September 2024.
- ^ "The Omega Project for Statistical Computing". www.omegahat.net. Retrieved 5 September 2024.
- ^ "Build software better, together". GitHub. Retrieved 5 September 2024.
- ^ Wickham, Hadley; Grolemund, Garrett (January 2017). 1 Introduction | R for Data Science (1st ed.). O'Reilly Media. ISBN 978-1491910399.
- ^ R Development Core Team. "Assignments with the = Operator". Retrieved 11 September 2018.
- ^ Kabacoff, Robert (2012). "Quick-R: User-Defined Functions". statmethods.net. Retrieved 28 September 2018.
- ^ Wickham, Hadley. "Advanced R - Functional programming - Closures". adv-r.had.co.nz.
- ^ "NEWS". r-project.org.
- ^ "R: R News". cran.r-project.org. Retrieved 14 March 2024.
- ^ Wickham, Hadley; Çetinkaya-Rundel, Mine; Grolemund, Garrett (2023). "4 Workflow: code style". R for data science: import, tidy, transform, visualize, and model data (2nd ed.). Beijing; Sebastopol, CA: O'Reilly. ISBN 978-1-4920-9740-2. OCLC 1390607935.
- ^ "Class Methods". Retrieved 25 April 2024.
- ^ Monkman, Martin. Chapter 5 R Release Names | Data Science with R: A Resource Compendium.
- ^ McGowan, Lucy D’Agostino (28 September 2017). "R release names". livefreeordichotomize.com. Retrieved 7 April 2024.
- ^ r-hub/rversions, The R-hub project of the R Consortium, 29 February 2024, retrieved 7 April 2024
- ^ a b c d Dalgaard, Peter (15 July 2018). "What's in a name? 20 years of R release management" (video). YouTube. Retrieved 9 April 2024.
- ^ "Read Peanuts by Charles Schulz on GoComics". www.gocomics.com. Retrieved 13 June 2025.
- ^ "[Rd] R 4.5.1 is released". hypatia.math.ethz.ch. Retrieved 13 June 2025.
- ^ "Read Peanuts by Charles Schulz on GoComics". www.gocomics.com. Retrieved 17 April 2025.
- ^ "[Rd] R 4.5.0 is released". hypatia.math.ethz.ch. Retrieved 17 April 2025.
- ^ "Read Peanuts by Charles Schulz on GoComics". www.gocomics.com. Retrieved 17 April 2025.
- ^ "[Rd] R 4.4.3 is released". hypatia.math.ethz.ch. Retrieved 17 April 2025.
- ^ Schulz, Charles (15 November 1957). "Peanuts by Charles Schulz for November 15, 1957 | GoComics.com". GoComics. Retrieved 6 January 2025.
- ^ "[Rd] R 4.4.2 is released". stat.ethz.ch. Retrieved 26 December 2024.
- ^ "Race for Your Life, Charlie Brown". IMDB. 3 August 1977. Retrieved 18 June 2024.
- ^ "R 4.4.1 is released". stat.ethz.ch. Retrieved 18 June 2024.
- ^ Schulz, Charles (29 June 1980). "Peanuts by Charles Schulz for June 29, 1980 | GoComics.com". GoComics. Retrieved 24 April 2024.
- ^ "R 4.4.0 is released". stat.ethz.ch. Retrieved 24 April 2024.
- ^ Schulz, Charles (29 June 1980). "Peanuts by Charles Schulz for June 29, 1980 | GoComics.com". GoComics. Retrieved 9 April 2024.
- ^ "R 4.3.3 is released". hypatia.math.ethz.ch. Retrieved 7 April 2024.
- ^ Schulz, Charles (31 October 1996). "Peanuts by Charles Schulz for October 31, 1996 | GoComics.com". GoComics. Retrieved 9 April 2024.
- ^ "[Rd] R 4.3.2 is released". stat.ethz.ch. Retrieved 7 April 2024.
- ^ Schulz, Charles (28 April 1979). "Peanuts by Charles Schulz for April 28, 1979 | GoComics.com". GoComics. Retrieved 9 April 2024.
- ^ "[Rd] R 4.3.1 is released". stat.ethz.ch. Retrieved 7 April 2024.
- ^ Schulz, Charles (13 June 1980). "Peanuts by Charles Schulz for June 13, 1980 | GoComics.com". GoComics. Retrieved 9 April 2024.
- ^ Schulz, Charles (16 June 1980). "Peanuts by Charles Schulz for June 16, 1980 | GoComics.com". GoComics. Retrieved 9 April 2024.
- ^ Schulz, Charles (26 November 1964). "Peanuts by Charles Schulz for November 26, 1964 | GoComics.com". GoComics. Retrieved 9 April 2024.
- ^ "[Rd] R 4.3.0 is released". stat.ethz.ch. Retrieved 7 April 2024.
- ^ Schulz, Charles (30 March 2001). "Peanuts by Charles Schulz for March 30, 2001 | GoComics.com". GoComics. Retrieved 9 April 2024.
- ^ "[Rd] R 4.2.3 is released". stat.ethz.ch. Retrieved 7 April 2024.
- ^ Schulz, Charles (30 October 1962). "Peanuts by Charles Schulz for October 30, 1962 | GoComics.com". GoComics. Retrieved 9 April 2024.
- ^ "[Rd] R 4.2.2 is released". stat.ethz.ch. Retrieved 7 April 2024.
- ^ Schulz, Charles (22 November 1970). "Peanuts by Charles Schulz for November 22, 1970 | GoComics.com". GoComics. Retrieved 9 April 2024.
- ^ Schulz, Charles (29 July 1971). "Peanuts by Charles Schulz for July 29, 1971 | GoComics.com". GoComics. Retrieved 9 April 2024.
- ^ Schulz, Charles (25 September 1969). "Peanuts by Charles Schulz for September 25, 1969 | GoComics.com". GoComics. Retrieved 9 April 2024.
- ^ Schulz, Charles (13 October 1973). "Peanuts by Charles Schulz for October 13, 1973 | GoComics.com". GoComics. Retrieved 9 April 2024.
- ^ Schulz, Charles (8 February 1974). "Peanuts by Charles Schulz for February 08, 1974 | GoComics.com". GoComics. Retrieved 9 April 2024.
- ^ Schulz, Charles (8 January 1970). "Peanuts by Charles Schulz for January 08, 1970 | GoComics.com". GoComics. Retrieved 9 April 2024.
- ^ "[Rd] R 4.2.1 is released". stat.ethz.ch. Retrieved 7 April 2024.
- ^ a b Schulz, Charles (6 March 1967). "Peanuts by Charles Schulz for March 06, 1967 | GoComics.com". GoComics. Retrieved 9 April 2024.
- ^ "[Rd] R 4.2.0 is released". stat.ethz.ch. Retrieved 7 April 2024.
- ^ a b "[Rd] R 4.1.2 is released". hypatia.math.ethz.ch. Retrieved 7 April 2024.
- ^ Schulz, Charles (1 November 1967). "Peanuts by Charles Schulz for November 01, 1967 | GoComics.com". GoComics. Retrieved 9 April 2024.
- ^ Schulz, Charles (12 July 1967). "Peanuts by Charles Schulz for July 12, 1967 | GoComics.com". GoComics. Retrieved 9 April 2024.
- ^ Schulz, Charles (17 May 1978). "Peanuts by Charles Schulz for May 17, 1978 | GoComics.com". GoComics. Retrieved 9 April 2024.
- ^ "[Rd] R 4.1.1 is released". hypatia.math.ethz.ch. Retrieved 7 April 2024.
- ^ Schulz, Charles (12 February 1986). "Peanuts by Charles Schulz for February 12, 1986 | GoComics.com". GoComics. Retrieved 8 April 2024.
- ^ "[Rd] R 4.1.0 is released". hypatia.math.ethz.ch. Retrieved 7 April 2024.
- ^ Schulz, Charles (30 July 1978). "Peanuts by Charles Schulz for July 30, 1978 | GoComics.com". GoComics. Retrieved 7 April 2024.
- ^ "[Rd] R 4.0.5 is released". hypatia.math.ethz.ch. Retrieved 7 April 2024.
- ^ Schulz, Charles (2 March 1959). "Peanuts by Charles Schulz for March 02, 1959 | GoComics.com". GoComics. Retrieved 7 April 2024.
- ^ Schulz, Charles (27 February 2006). "Peanuts by Charles Schulz for February 27, 2006 | GoComics.com". GoComics. Retrieved 7 April 2024.
- ^ Schulz, Charles (13 March 1959). "Peanuts by Charles Schulz for March 13, 1959 | GoComics.com". GoComics. Retrieved 7 April 2024.
- ^ "[Rd] R 4.0.4 scheduled for February 15". hypatia.math.ethz.ch. Retrieved 7 April 2024.
- ^ Schulz, Charles (23 October 1972). "Peanuts by Charles Schulz for October 23, 1972 | GoComics.com". GoComics. Retrieved 7 April 2024.
- ^ "[Rd] R 4.0.3 is released". stat.ethz.ch. Retrieved 7 April 2024.
- ^ Schulz, Charles (14 April 1962). "Peanuts by Charles Schulz for April 14, 1962 | GoComics.com". GoComics. Retrieved 7 April 2024.
- ^ "R 4.0.2 is released". hypatia.math.ethz.ch. Retrieved 7 April 2024.
- ^ Schulz, Charles (6 February 1962). "Peanuts by Charles Schulz for February 06, 1962 | GoComics.com". GoComics. Retrieved 7 April 2024.
- ^ "R 4.0.1 is released". hypatia.math.ethz.ch. Retrieved 7 April 2024.
- ^ Schulz, Charles (24 April 1970). "Peanuts by Charles Schulz for April 24, 1970 | GoComics.com". GoComics. Retrieved 7 April 2024.
- ^ "R 4.0.0 is released". hypatia.math.ethz.ch. Retrieved 7 April 2024.
- ^ Schulz, Charles (29 February 2000). "Peanuts by Charles Schulz for February 29, 2000 | GoComics.com". GoComics. Retrieved 7 April 2024.
- ^ "R 3.6.3 is released". hypatia.math.ethz.ch. Retrieved 7 April 2024.
- ^ Schulz, Charles (12 July 1965). "Peanuts by Charles Schulz for July 12, 1965 | GoComics.com". GoComics. Retrieved 7 April 2024.
- ^ "R 3.6.2 is released". hypatia.math.ethz.ch. Retrieved 7 April 2024.
- ^ a b Schulz, Charles (22 March 1971). "Peanuts by Charles Schulz for March 22, 1971 | GoComics.com". GoComics. Retrieved 7 April 2024.
- ^ "R 3.6.1 is released". hypatia.math.ethz.ch. Retrieved 7 April 2024.
- ^ Schulz, Charles (3 March 1963). "Peanuts by Charles Schulz for March 03, 1963 | GoComics.com". GoComics. Retrieved 7 April 2024.
- ^ "R 3.6.0 is released". hypatia.math.ethz.ch. Retrieved 7 April 2024.
- ^ Schulz, Charles (11 March 1959). "Peanuts by Charles Schulz for March 11, 1959 | GoComics.com". GoComics. Retrieved 7 April 2024.
- ^ "R 3.5.3 is released". stat.ethz.ch. Retrieved 7 April 2024.
- ^ Schulz, Charles (25 January 1960). "Peanuts by Charles Schulz for January 25, 1960 | GoComics.com". GoComics. Retrieved 7 April 2024.
- ^ "R 3.5.2 is released". stat.ethz.ch. Retrieved 7 April 2024.
- ^ Schulz, Charles (9 March 1972). "Peanuts by Charles Schulz for March 09, 1972 | GoComics.com". GoComics. Retrieved 7 April 2024.
- ^ "R 3.5.1 is released". stat.ethz.ch. Retrieved 7 April 2024.
- ^ Schulz, Charles (27 January 1973). "Peanuts by Charles Schulz for January 27, 1973 | GoComics.com". GoComics. Retrieved 7 April 2024.
- ^ "R 3.5.0 is released". hypatia.math.ethz.ch. Retrieved 7 April 2024.
- ^ "It's nice to have a friend you can lean on". Archived from the original on 7 April 2024.
- ^ "Peanuts Snoopy Charlie Brown A Friend is Someone you can lean on metal tin sign". Retrieved 17 April 2025.
- ^ "Peanuts Snoopy & Charlie Brown Friend Is Someone You Can Lean On Fire-King Mug". Retrieved 17 April 2025.
- ^ "R 3.4.4 is released". hypatia.math.ethz.ch. Retrieved 7 April 2024.
- ^ Schulz, Charles (19 February 1967). "Peanuts by Charles Schulz for February 19, 1967 | GoComics.com". GoComics. Retrieved 7 April 2024.
- ^ "R 3.4.3 is released". hypatia.math.ethz.ch. Retrieved 7 April 2024.
- ^ "R 3.4.2 is released". hypatia.math.ethz.ch. Retrieved 7 April 2024.
- ^ a b Schulz, Charles (9 September 1965). "Peanuts by Charles Schulz for September 09, 1965 | GoComics.com". GoComics. Retrieved 7 April 2024.
- ^ "R 3.4.1 is released". hypatia.math.ethz.ch. Retrieved 7 April 2024.
- ^ "R 3.4.0 is released". stat.ethz.ch. Retrieved 7 April 2024.
- ^ Schulz, Charles (29 June 1966). "Peanuts by Charles Schulz for June 29, 1966 | GoComics.com". GoComics. Retrieved 7 April 2024.
- ^ "[R] R 3.3.3 is released". stat.ethz.ch. Retrieved 7 April 2024.
- ^ Schulz, Charles (30 October 1968). "Peanuts by Charles Schulz for October 30, 1968 | GoComics.com". GoComics. Retrieved 7 April 2024.
- ^ "[R] R 3.3.2 is released". stat.ethz.ch. Retrieved 7 April 2024.
- ^ Schulz, Charles (15 June 1967). "Peanuts by Charles Schulz for June 15, 1967 | GoComics.com". GoComics. Retrieved 7 April 2024.
- ^ "[R] R 3.3.1 is released". stat.ethz.ch. Retrieved 7 April 2024.
- ^ Schulz, Charles (7 May 1971). "Peanuts by Charles Schulz for May 07, 1971 | GoComics.com". GoComics. Retrieved 7 April 2024.
- ^ "[R] R 3.3.0 is released". stat.ethz.ch. Retrieved 7 April 2024.
- ^ a b Schulz, Charles (20 February 1964). "Peanuts by Charles Schulz for February 20, 1964 | GoComics.com". GoComics. Retrieved 7 April 2024.
- ^ "VERSION-NICK". Retrieved 7 April 2024.
- ^ "R 3.2.5 is released". stat.ethz.ch. Retrieved 7 April 2024.
- ^ "R 3.2.4-revised is released". stat.ethz.ch. Retrieved 7 April 2024.
- ^ "R 3.2.4 is released". stat.ethz.ch. Retrieved 7 April 2024.
- ^ Schulz, Charles (18 December 1980). "Peanuts by Charles Schulz for December 18, 1980 | GoComics.com". GoComics. Retrieved 9 April 2024.
- ^ "R 3.2.3 is released". stat.ethz.ch. Retrieved 7 April 2024.
- ^ MarketScreener (7 October 2008). "METLIFE : Brush Up on Fire Safety Basics -October 07, 2008 at 04:03 pm EDT | MarketScreener". www.marketscreener.com. Retrieved 7 April 2024.
- ^ "MetLife Advises People to Brush Up on Fire Safety Basics to Stay Safe". Claims Journal. 12 October 2005. Retrieved 7 April 2024.
- ^ "R 3.2.2 is released". stat.ethz.ch. Retrieved 7 April 2024.
- ^ Schulz, Charles (10 March 1969). "Peanuts by Charles Schulz for March 10, 1969 | GoComics.com". GoComics. Retrieved 7 April 2024.
- ^ "[R] R 3.2.1 liftoff". stat.ethz.ch. Retrieved 7 April 2024.
- ^ Schulz, Charles (7 April 1966). "Peanuts by Charles Schulz for April 07, 1966 | GoComics.com". GoComics. Retrieved 7 April 2024.
- ^ "[R] R 3.2.0 is released". stat.ethz.ch. Retrieved 7 April 2024.
- ^ Schulz, Charles M. (2019). Happiness is a warm puppy. New York: Penguin Workshop. ISBN 978-1-5247-8995-4.
- ^ "R 3.1.3 is released". stat.ethz.ch. Retrieved 7 April 2024.
- ^ "[R] R 3.1.2 is released". stat.ethz.ch. Retrieved 7 April 2024.
- ^ "Sock it to me". Archived from the original on 9 April 2024.
- ^ "Sock it to me". Archived from the original on 9 April 2024.
- ^ "Sock it to me puzzle". Archived from the original on 9 April 2024.
- ^ "Peanuts Springbok Puzzles".
- ^ "[R] R 3.1.1 is released". stat.ethz.ch. Retrieved 7 April 2024.
- ^ "[R] R 3.1.0 is released". stat.ethz.ch. Retrieved 7 April 2024.
- ^ Schulz, Charles (11 January 1965). "Peanuts by Charles Schulz for January 11, 1965 | GoComics.com". GoComics. Retrieved 7 April 2024.
- ^ "R 3.0.3 is released". stat.ethz.ch. Retrieved 7 April 2024.
- ^ Schulz, Charles (3 September 1971). "Peanuts by Charles Schulz for September 03, 1971 | GoComics.com". GoComics. Retrieved 7 April 2024.
- ^ "R 3.0.2 is released". stat.ethz.ch. Retrieved 7 April 2024.
- ^ Schulz, Charles (22 November 1953). "Peanuts by Charles Schulz for November 22, 1953 | GoComics.com". GoComics. Retrieved 7 April 2024.
- ^ "R 3.0.1 is released". stat.ethz.ch. Retrieved 7 April 2024.
- ^ Schulz, Charles (23 June 1981). "Peanuts by Charles Schulz for June 23, 1981 | GoComics.com". GoComics. Retrieved 7 April 2024.
- ^ "R 3.0.0 is released". stat.ethz.ch. Retrieved 7 April 2024.
- ^ Schulz, Charles (23 October 1965). "Peanuts by Charles Schulz for October 23, 1965 | GoComics.com". GoComics. Retrieved 7 April 2024.
- ^ "R 2.15.3 is released". stat.ethz.ch. Retrieved 7 April 2024.
- ^ Schulz, Charles (31 October 1969). "Peanuts by Charles Schulz for October 31, 1969 | GoComics.com". GoComics. Retrieved 7 April 2024.
- ^ "R 2.15.2 is released". stat.ethz.ch. Retrieved 7 April 2024.
- ^ Schulz, Charles (6 June 1987). "Peanuts by Charles Schulz for June 06, 1987 | GoComics.com". GoComics. Retrieved 7 April 2024.
- ^ "R 2.15.1 is released". stat.ethz.ch. Retrieved 7 April 2024.
- ^ Schulz, Charles (11 April 1971). "Peanuts by Charles Schulz for April 11, 1971 | GoComics.com". GoComics. Retrieved 7 April 2024.
- ^ "R 2.15.0 is released". stat.ethz.ch. Retrieved 7 April 2024.
- ^ It's the Easter Beagle, Charlie Brown! (TV Short 1974) - Quotes - IMDb. Retrieved 8 April 2024 – via www.imdb.com.
- ^ "R 2.14.2 is released + R anniversary". stat.ethz.ch. Retrieved 7 April 2024.
- ^ McGough, Nellah Bailey (20 January 2023). "Our Favorite Quotes and Sayings from "A Charlie Brown Christmas"". Southern Living. Retrieved 8 April 2024.
- ^ "R 2.14.1 is released". stat.ethz.ch. Retrieved 7 April 2024.
- ^ Schulz, Charles (29 October 1973). "Peanuts by Charles Schulz for October 29, 1973 | GoComics.com". GoComics. Retrieved 7 April 2024.
- ^ "R 2.14.0 is released". stat.ethz.ch. Retrieved 7 April 2024.
- ^ Schulz, Charles (17 August 1967). "Peanuts by Charles Schulz for August 17, 1967 | GoComics.com". GoComics. Retrieved 7 April 2024.
- ^ "R for macOS". cran.r-project.org. Retrieved 5 September 2024.
- ^ "IDE from Posit PBC, the creators of RStudio | Positron - Home". Positron. Retrieved 24 September 2025.
- ^ "IDE/Editor para Linguagem R | Tinn-R - Home". Tinn-R (in Brazilian Portuguese). Retrieved 5 September 2024.
- ^ Talbot, Justin; DeVito, Zachary; Hanrahan, Pat (1 January 2012). "Riposte: A trace-driven compiler and parallel VM for vector code in R". Proceedings of the 21st international conference on Parallel architectures and compilation techniques. ACM. pp. 43–52. doi:10.1145/2370816.2370825. ISBN 9781450311823. S2CID 1989369.
- ^ Jackson, Joab (16 May 2013). TIBCO offers free R to the enterprise. PC World. Retrieved 20 July 2015.
- ^ "Looking to the future for R in Azure SQL and SQL Server". 30 June 2021. Retrieved 7 November 2021.
Further reading
[edit]- Wickham, Hadley; Çetinkaya-Rundel, Mine; Grolemund, Garrett (2023). R for data science: import, tidy, transform, visualize, and model data (2nd ed.). Beijing Boston Farnham Sebastopol Tokyo: O'Reilly. ISBN 978-1-4920-9740-2.
- Gagolewski, Marek (2024). Deep R Programming. doi:10.5281/ZENODO.7490464. ISBN 978-0-6455719-2-9.
External links
[edit]- R documentation
- R Technical Papers
- Big Book of R, curated list of R-related programming books
- Books Related to R - R Project, partially annotated curated list of books relating to R or S.
| Features | ||
|---|---|---|
| Implementations |
| |
| Packages | ||
| Interfaces | ||
| People | ||
| Organisations |
| |
| Publications | ||
| International | |
|---|---|
| National | |
| Other | |
R (programming language)
View on GrokipediaHistory
Origins and Development
R was created in 1993 by statisticians Ross Ihaka and Robert Gentleman at the University of Auckland in New Zealand, as an open-source implementation of the S programming language developed at Bell Laboratories.[4] The project began as a response to the limitations of proprietary statistical software like S-PLUS, which restricted accessibility and extensibility for academic and research use. Ihaka and Gentleman aimed to provide a free alternative focused on statistical analysis, graphical capabilities, and data manipulation, enabling broader adoption in teaching and research environments.[8] Their initial prototype was announced publicly in August 1993 via the S-news mailing list, with early versions distributed through StatLib archives.[9] The language's design drew heavily from S for its syntax and statistical primitives but incorporated influences from functional programming languages like Lisp and Scheme to enhance evaluation semantics, memory management, and extensibility.[4] This blend allowed R to support interactive data exploration and custom function creation more efficiently than its predecessor. In 1995, R adopted the GNU General Public License, formalizing its status as free software and facilitating contributions from the global community; this transition was supported by efforts from Martin Mächler to align it with GNU project standards.[10] By mid-1997, the R Core Team was formed, comprising Ihaka, Gentleman, and other key contributors including Douglas Bates, John Chambers, and Kurt Hornik, who took collective responsibility for maintaining the source code via a CVS repository.[10] The establishment of the R Foundation for Statistical Computing in April 2003 marked a pivotal step in institutionalizing support for the project, providing a nonprofit structure to manage donations, conferences, and ongoing development without commercial dependencies.[11] This organization, founded by members of the R Core Team, ensured the language's sustainability as an open-source tool for statistical computing, reflecting its evolution from an academic experiment to a foundational resource in data science.[12]Version History
R's version history begins with its first public release on February 29, 2000, marking the transition from alpha and beta versions to a stable software environment for statistical computing.[13] Subsequent major releases have followed a structured cycle, with significant updates occurring roughly every few years to introduce new features, improve performance, and incorporate community contributions.[13] Prior to version 3.0.0, major releases (x.y.0) were scheduled biannually around April 1 and October 1, shifting to an annual April release pattern thereafter to align with development timelines.[13] Key milestones include R 1.0.0, the inaugural stable version that established core functionality for data analysis and graphics.[14] R 2.0.0, released on October 4, 2004, introduced namespaces to enhance package organization and reduce naming conflicts, a foundational change for the growing ecosystem of user-contributed extensions.[13] The release of R 3.0.0 on April 3, 2013, brought support for long vectors, enabling handling of datasets exceeding 2^31 - 1 elements without integer overflow issues.[13] R 4.0.0, launched on April 24, 2020, emphasized performance optimizations and required reinstallation of binary packages due to changes in serialization formats, signaling a commitment to evolving the language while maintaining core stability.[15] More recent developments continued this progression with R 4.1.0 on May 18, 2021, which added the native pipe operator|> to streamline data processing workflows natively, reducing reliance on external packages like magrittr.[13] The 4.5.x series, comprising R 4.5.0 (April 11, 2025), R 4.5.1 (June 13, 2025), and R 4.5.2 (October 31, 2025), focused on refinements such as parallel downloads in install.packages() and download.packages() using libcurl for faster package acquisition, alongside enhanced string handling in functions like substr() to preserve names during subassignment and improved iconv() for encoding conversions.[16][17] Deprecations in this series included warnings for matrix() when input length mismatches dimensions (introduced earlier but enforced progressively) and removal of legacy S-compatibility macros to modernize the C API.[16]
R versions employ a semantic numbering scheme (major.minor.patch), where major releases (e.g., 2.0.0, 3.0.0) introduce substantial features, minor releases add enhancements, and patch releases address bugs.[13] Each release carries a playful codename, such as "Arbor Day" for 4.0.0, "Camp Pontanezen" for 4.1.0, and "[Not] Part in a Rumble" for 4.5.2, adding a lighthearted element to the development process without formal documentation on selection criteria.[18][14]
R's development adheres to a backward compatibility policy that prioritizes stability for existing code, though major version increments may necessitate package recompilation or updates due to internal changes like serialization or API shifts.[16] This approach ensures broad usability across versions, with older branches occasionally reopened for critical fixes based on user needs.[13] Releases actively incorporate community feedback through mechanisms like the R Bug Tracking System and the r-devel mailing list, where developers review submissions to prioritize enhancements and resolve issues before finalizing stable versions.[13]
Language Overview
Philosophy and Design Goals
R was developed as an open-source implementation of the S programming language, primarily aimed at facilitating statistical analysis, with built-in extensions for graphics production and efficient data handling to support researchers in exploratory data analysis.[19] This design choice stemmed from the need to provide a freely available alternative to the proprietary S, enabling widespread adoption in academic and research environments while preserving S's core capabilities for statistical computing.[20] The language's philosophy emphasizes interactive use, allowing users to experiment with data and models in a dynamic environment that promotes discovery and iteration.[19] A central design principle of R is the promotion of vectorized operations, which apply functions across entire arrays or vectors simultaneously, thereby enhancing efficiency in numerical computations and discouraging the use of explicit loops that could hinder performance in statistical tasks.[21] This approach aligns with the language's focus on handling large datasets typical in statistical research, where operations like aggregation and transformation need to be both expressive and performant without low-level programming overhead. R's open-source ethos, governed by the GNU General Public License, further underscores its commitment to reproducibility and collaborative development, as users can freely inspect, modify, and extend the codebase, fostering a vast ecosystem of contributed packages that advance statistical methodologies.[20] While R prioritizes statistical expressiveness—such as integrated support for hypothesis testing, regression modeling, and data visualization—over the raw speed of general-purpose languages, this trade-off enables domain-specific optimizations that make complex analyses more accessible to non-programmers in research fields.[19] The influences from statistical needs are evident in features like built-in functions for common inferential procedures, reflecting the language's origins in addressing the practical demands of data scientists and statisticians at institutions like Bell Labs. Overall, these goals ensure R remains a tool tailored for rigorous, reproducible scientific inquiry rather than broad software engineering.[20]Basic Syntax
R employs a concise syntax for variable assignment, primarily using the<- operator, though = is also permitted in certain contexts such as top-level assignments. For instance, the expression x <- 5 assigns the numeric value 5 to the variable x, creating or overwriting the object in the current environment.[21] This operator is directional, allowing reverse assignment with ->, and variables in R are dynamically typed, meaning no explicit declaration of type is required upon assignment—data types such as numeric, character, or logical are inferred automatically.[21]
Comments in R are denoted by the # symbol, which ignores all text from that point to the end of the line, facilitating code documentation without affecting execution.[21] Expressions in R are evaluated immediately upon entry in interactive mode, such as the R console, where entering 2 + 3 directly outputs 5 without needing assignment.[21] This immediate evaluation supports rapid prototyping, with results printed unless suppressed using functions like invisible().
A key feature of R's syntax is vector recycling during operations on vectors of unequal lengths, where the shorter vector is implicitly repeated to match the longer one. For example, c(1, 2) + 3 recycles the scalar 3 to produce c(4, 5), enabling element-wise arithmetic without explicit looping.[21] A warning is issued if the lengths are not multiples, promoting awareness of potential mismatches.[21]
Workspace management in R involves functions to inspect and modify the environment's objects. The ls() function lists all objects in the current environment, returning a character vector of their names, such as ls() displaying "x" after the earlier assignment.[21] Conversely, rm() removes specified objects, for example rm(x) to delete x, or rm(list = ls()) to clear the entire workspace.[21]
Basic error handling in R utilizes the tryCatch() function to capture and manage exceptions, allowing code to continue execution despite errors by specifying handlers for conditions like errors or warnings.[21] The structure wraps an expression with arguments for error recovery, such as tryCatch(expr, error = function(e) e), providing a mechanism to gracefully handle runtime issues without halting the session.[21]
Programming Constructs
Data Types and Structures
R's fundamental data structures are built around vectors, which serve as the core building blocks for handling statistical data. Atomic vectors are homogeneous collections of elements of the same basic type, including numeric (double precision), integer, character, logical (boolean), and complex numbers.[22] They can be created using thec() function to concatenate values, such as x <- c(1.1, 2, 3.3), or seq() for sequences, like y <- seq(1, 10, by=2).[23] These vectors support 1-based indexing for access, e.g., x[2], and enable efficient vectorized operations central to R's design for statistical computing.[24]
Atomic vectors can carry attributes, which are metadata providing additional structure without altering the underlying data. Common attributes include names for labeling elements, set via names(x) <- c("first", "second"), and dim for transforming a vector into a multi-dimensional array or matrix, such as dim(z) <- c(2, 3) to create a 2x3 matrix.[25] Attributes are stored as a named list and can be inspected with attributes() or retrieved individually using attr().[26]
Lists provide a flexible, heterogeneous counterpart to atomic vectors, allowing elements of different types within a single ordered collection. Created with list(), as in lst <- list(a=1:3, b="hello", c=TRUE), lists are accessed using double brackets [[ ]] for single elements, e.g., lst[[1]], or the dollar sign $ for named components, like lst$b.[27] This structure supports recursive nesting, making lists suitable for complex, tree-like data representations in statistical applications.[28]
Factors are specialized atomic vectors designed for categorical data, storing unique levels as an attribute to represent discrete variables efficiently. They are created using factor(), for example f <- factor(c("low", "high", "low")), which internally uses integers to index levels like c("low", "high").[29] Levels can be accessed via levels(f), and factors support ordering for ordinal data through ordered() or the ordered argument in factor().[30] This design optimizes storage and enables specialized statistical modeling for categories.[28]
Data frames extend lists into tabular formats, combining vectors or factors of equal length as columns to mimic spreadsheet-like structures for multivariate data. Created with data.frame(), such as df <- data.frame(id=1:3, score=c(85, 90, 78), group=factor(c("A", "B", "A"))), they allow row and column access via df[1, 2] or df$score.[31] Functions like nrow(df) and ncol(df) provide dimensions, while attributes such as row.names and names manage identifiers.[32] Data frames are essential for handling datasets in statistical analysis, supporting heterogeneous column types.[28]
Missing values in R are represented by NA for general absence of data, which coerces to the appropriate type (e.g., NA_real_ for numeric), and NaN specifically for undefined numeric results like 0/0.[33] These can be included in vectors or other structures, as in v <- c(1, NA, 3), and detected using is.na() for both or is.nan() exclusively for NaN.[34] Proper handling of NA and NaN is crucial in statistical computations to avoid propagation errors.[28]
Functions
Functions in R are defined using thefunction() constructor, which takes a list of formal arguments and a body consisting of one or more R expressions. The syntax is name <- function(arglist) body, where arglist specifies the parameters and body contains the executable code.[35] Upon execution, a function implicitly returns the value of its last evaluated expression, though explicit returns can be used with the return() function.[36] For example, the function square <- function(x) x * x computes the square of its input and returns the result.[36]
Arguments to R functions can be passed positionally, by name, or using partial matching for names. Formal arguments may include default values, specified as arg = default_value, allowing callers to omit them.[37] The ellipsis ... enables variadic functions to accept a variable number of arguments, which are then accessible within the function body.[38] For instance, in add <- function(a, b, ...) a + b + sum(...), additional arguments passed via ... are summed and added to the result.[36] Argument evaluation employs lazy evaluation through promises, delaying computation until the argument is accessed in the body.[38]
R employs lexical scoping, where free variables in a function are resolved by searching the environment in which the function was defined, proceeding outward through enclosing environments until the global environment or search path.[39] Environments in R are collections of named objects (frames) with a pointer to an enclosing environment, forming a hierarchy that supports this scoping mechanism.[40] Functions are closures, meaning they capture and retain their defining environment, allowing access to non-local variables even after the original environment changes.[41] An example is make.power <- function(n) { pow <- function(x) x^n; pow }, where the returned pow function closes over n from its creation context.[42]
Control flow in R is managed through conditional and iterative constructs. The if statement evaluates a condition and executes one of two expressions: if (cond) true_expr else false_expr, returning the value of the executed branch.[43] Loops include for (var in vector) body for iterating over sequences, while (cond) body for condition-based repetition, and repeat body for indefinite loops (typically exited with break).[44] The switch statement selects an expression based on the value of an input, using either numeric indices or character strings to match cases: switch(expr, case1 = value1, case2 = value2).[43] Additionally, the ifelse() function provides vectorized conditional selection.[44]
To promote functional programming and avoid explicit loops, R includes the apply family of functions for implicit iteration over data structures. lapply() applies a function to each element of a list or vector, returning a list of results.[45] sapply() behaves similarly but simplifies the output to a vector or matrix when possible.[45] apply() operates on arrays or matrices along specified margins (e.g., rows or columns).[45] For example, lapply(1:3, function(x) x^2) yields list(1, 4, 9).[45]
Anonymous functions in R are defined inline without assignment to a name, using the same function() syntax, and are commonly employed in higher-order functions like those in the apply family.[35] For instance, sapply(1:5, function(x) x * 2) doubles each element without defining a named function.[45] This lambda-like usage enhances conciseness in functional compositions.[36]
Object-Oriented Features
R implements object-oriented programming primarily through three systems: S3, S4, and Reference Classes (also known as R5). These systems enable method dispatch based on object classes, facilitating extensible and modular code, particularly in statistical computing.[46] The S3 system, R's original and simplest object-oriented approach, relies on informal conventions for class assignment and method dispatch. Objects are basic R types augmented with aclass attribute, a character vector specifying one or more classes. Generic functions, such as print() or summary(), invoke methods via the UseMethod() function, which dispatches based on the class of the first argument. For instance, calling print(x) where class(x) is "foo" seeks a method named print.foo; if absent, it falls back to the default print.default or uses NextMethod() for inheritance in multi-class scenarios. This functional style of OOP, where methods are independent functions, originated in the S language and emphasizes simplicity for base R operations.[46][47]
In contrast, the S4 system provides a more formal and rigorous framework, suitable for complex packages requiring strict validation and multiple dispatch. Classes are defined using setClass(), specifying slots (data members) with their types and optional validity checks via validObject(). Methods are registered with generic functions using setMethod(), allowing dispatch on multiple arguments' classes. For example, a class "MyClass" might include slots like value of type "numeric", ensuring type safety at creation. S4 supports inheritance, coercion (as()), and combination classes, making it ideal for domain-specific modeling. This system, implemented in the methods package, is widely used in Bioconductor for genomic data structures due to its enforceability and extensibility.[48][49]
Reference Classes (R5) extend OOP to support mutable objects, addressing limitations in S3 and S4 where objects are immutable by default. Defined via setRefClass(), they encapsulate fields and methods in an environment, allowing direct state modification without copying—changes to one reference affect all aliases. Access occurs through $ for fields and methods (e.g., obj$field <- 5) and @ for direct slot manipulation, though the latter is discouraged outside internals. These classes support copy-on-modify semantics via copy() and are useful for stateful simulations or iterative algorithms.[50]
S3 prioritizes simplicity and is prevalent in base R for quick extensions, while S4 offers formality for robust, validated hierarchies in specialized packages like Bioconductor; Reference Classes fill the gap for mutability in both. In statistical contexts, generics like lm() and glm() exemplify S3 dispatch: lm() fits linear models and returns an "lm" object, triggering class-specific methods such as summary.lm() for tailored output. Similarly, glm() handles generalized linear models with dispatch to "glm" methods, enabling seamless integration of custom behaviors.[46][49][51]
Specialized Features
Pipe Operator
The native pipe operator|> was introduced in R version 4.1.0, released in May 2021, providing a built-in mechanism to chain operations by passing the value from the left-hand side (LHS) of the operator as the first argument to the expression on the right-hand side (RHS). This syntax simplifies code readability, particularly for sequential data transformations, by avoiding nested function calls or intermediate variable assignments; for instance, mean(1:10) can be rewritten as 1:10 |> mean(). Unlike earlier approaches that relied on external packages, the native pipe is part of base R, eliminating the need for additional dependencies and offering slight performance advantages due to its implementation as syntax rather than a function call.[52]
In contrast to the popular %>% operator from the magrittr package, which popularized piping in R since 2014, the native |> operator is more restrictive in some aspects but integrates seamlessly with base R features. For example, while magrittr's placeholder . can be used flexibly in multiple positions or with operators without explicit naming, the native pipe defaults to the first argument and requires the _ placeholder (introduced in R 4.2.0) for non-first positions via named arguments, such as mtcars |> lm(mpg ~ wt, data = _); alternatively, anonymous functions can be used for custom placement, like x |> (function(y) f(a, y)).[52] This design avoids the overhead of magrittr's more versatile but computationally costlier implementation, making |> preferable for performance-critical code.[53]
The pipe excels in chaining data manipulations, such as filtering, mutating, and summarizing datasets, promoting a linear, readable flow that aligns with R's statistical workflow; the tidyverse style guide recommends using |> to emphasize sequences of actions over the initial object.[54] Best practices include limiting chains to 4-6 steps per line to maintain clarity, wrapping long pipes in curly braces {} for multiline readability, and avoiding overuse in loops or conditional branches where traditional control structures may be more appropriate.[55] For side-effect operations like printing or plotting without altering the pipeline's output, the pipe can feed into functions that produce no return value, though the RHS result becomes the overall output—use invisible() if needed to suppress it.
The native pipe requires R 4.1.0 or later for use; in older versions, compatibility is achieved by substituting with magrittr's %>%, which offers similar functionality but requires loading the package.[52] No direct backport package exists for |>, but transitional tools like the magrittr equivalents ensure code portability across R installations.[56]
Statistical and Mathematical Functions
R provides a comprehensive suite of built-in functions for mathematical computations and statistical analysis, which are vectorized to operate efficiently on arrays and data structures such as vectors and matrices. These functions form the core of R's utility for numerical and probabilistic tasks, enabling users to perform calculations without external dependencies.[57] Mathematical functions in R include elementary operations like trigonometric, logarithmic, and exponential computations. Thesin(), cos(), and tan() functions compute sine, cosine, and tangent of angles in radians, respectively, and apply element-wise to vectors; for example, sin(pi/2) returns 1. The log() function calculates the natural logarithm (base e) by default, with an optional base parameter for other bases, such as log(10, base=10) returning 1. Similarly, exp() computes the exponential function , as in exp(1) yielding approximately 2.718. For linear algebra, the solve() function solves systems of linear equations for , where is a square matrix and a vector or matrix; if is omitted, it returns the inverse of , using LAPACK routines for numerical stability. An example is solve(matrix(c(1,2,3,4), nrow=2)), which inverts a 2x2 matrix. These operations support complex numbers and preserve row/column names.[58][59]
Statistical summary functions offer quick computations of central tendency and variability. The mean() function calculates the arithmetic mean of a numeric vector, equivalent to , as in mean(c(1,2,3)) returning 2. The sd() function computes the sample standard deviation, , while var() provides the variance; for instance, sd(c(1,2,3)) yields approximately 1. The cor() function measures the Pearson correlation coefficient between two vectors, ranging from -1 to 1, such as cor(c(1,2), c(2,4)) returning 1. These functions include an na.rm parameter to exclude missing values.[60]
R's probability distribution functions follow a consistent naming convention: d for density, p for cumulative distribution function (CDF), q for quantile, and r for random generation. For the normal distribution, dnorm(x, mean=0, sd=1) computes the probability density function ; pnorm(q, mean=0, sd=1, lower.tail=TRUE) gives the CDF , defaulting to the lower tail; qnorm(p, mean=0, sd=1) inverts the CDF to find quantiles; and rnorm(n, mean=0, sd=1) generates random deviates. Parameters include log and log.p for logarithmic scales. Similar families exist for other distributions like binomial and Poisson.[61][62]
Hypothesis testing is supported through functions that compute test statistics and p-values. The t.test() function performs one- or two-sample Student's t-tests to compare means, with options for paired tests, equal variances (var.equal=TRUE), and alternative hypotheses ("two.sided", "less", "greater"); usage includes t.test(x, y, mu=0, conf.level=0.95), returning a list with t-statistic, degrees of freedom, p-value, and estimates. For categorical data, chisq.test(x, y, correct=TRUE) conducts Pearson's chi-squared test for goodness-of-fit or independence in contingency tables, applying a continuity correction for 2x2 tables and supporting Monte Carlo simulation (simulate.p.value=TRUE) for sparse data; it outputs the chi-squared statistic, p-value, and residuals.[63][64]
Confidence intervals are computed as part of hypothesis testing outputs, particularly via t.test(), which by default provides a 95% interval for the mean or mean difference using the t-distribution; the conf.level parameter adjusts this, e.g., t.test(x, conf.level=0.99). Other functions like prop.test() for proportions also include intervals, but built-in support emphasizes integration with basic tests.[63]
Random number generation ensures reproducibility with set.seed(n), which initializes the Mersenne-Twister generator using an integer seed , as in set.seed(123) before calling rnorm(5) to produce consistent random normals. This applies across all r functions, supporting uniform (runif()) and other distributions for simulations.[65]
The formula syntax, using the tilde ~, specifies relationships in statistical models, such as y ~ x denoting as the response and as the predictor in linear models. Terms can include additions (+), interactions (: or *), nesting (%in%), offsets (offset()), and no-intercept (-1); arithmetic requires I() wrapping, e.g., y ~ x + I(x^2). This interface is used by functions like lm() and glm() for model fitting.[66]
Graphics System
R's graphics system provides a comprehensive framework for data visualization, emphasizing both simplicity for basic plots and flexibility for complex displays. At its core is the base graphics subsystem, which enables users to create a variety of standard plots directly from R data structures without requiring additional packages. This system operates through a series of high-level plotting functions that generate output on a graphics device, with parameters adjustable to suit analytical needs.[67] Key functions in base graphics includeplot(), which serves as a generic tool for producing scatterplots, line plots, or other types based on input data; hist(), for creating histograms of numeric vectors with customizable binning; and boxplot(), for summarizing distributions across categories via box-and-whisker diagrams.[68] These functions initiate a new plot or add to an existing one, drawing from R's statistical functions for data preparation where needed. Customization occurs primarily through the par() function, which sets global parameters such as plot margins (mar), colors (col), line types (lty), and text sizes (cex), allowing persistent changes across multiple plots.[69] Further refinements, like adding main titles and subtitles via title(), customizing axis labels and ticks with axis(), or incorporating legends, enhance readability and interpretability without altering the underlying plot structure.[70]
For more sophisticated visualizations, particularly those involving multivariate data, R incorporates the lattice and grid systems as foundational extensions. The lattice package implements Trellis graphics, a high-level interface inspired by S-Plus capabilities, that facilitates trellis-style conditioning plots for exploring relationships across multiple variables in a single display.[71] It emphasizes elegant handling of complex datasets through functions like xyplot() and bwplot(), producing conditioned panels that reveal patterns not easily seen in univariate views. Underpinning lattice is the grid package, a low-level graphics engine that reimagines plot layout with support for arbitrary rectangular regions known as viewports. Viewports enable precise control over spatial arrangement, clipping, and layering of graphical elements, making grid suitable for building custom compositions that coexist with or replace base graphics calls.
Output from these systems is directed to various graphics devices, supporting both interactive and static formats. Interactive rendering occurs via platform-specific drivers such as X11() on Unix-like systems for window-based viewing or quartz() on macOS for native display integration.[72] For hardcopy or file export, functions like pdf() generate vector-based PDF files ideal for publication, while png() produces raster PNG images for web use, with options to specify resolution and dimensions.[72] The evolution of R's graphics reflects a progression from the imperative style of base graphics, rooted in the original S language heritage, toward modular systems like grid that power advanced packages such as ggplot2, which adopts a declarative grammar-of-graphics approach for layered visualizations.
Examples
Hello World and Basics
R provides a straightforward way to begin programming through its interactive console, where users can execute commands directly and observe immediate results. The simplest example, often called "Hello World," demonstrates basic output functionality. In the R console, enteringprint("Hello, World!") produces the output [1] "Hello, World!", confirming that R can handle string printing and basic execution.[57]
Basic arithmetic operations function similarly to a calculator within the console. For instance, 2 + 3 yields 5, showcasing R's support for standard mathematical computations without additional setup.[57] Vector creation introduces R's core data handling, using the c() function to combine elements; c(1:5) generates the vector [1] 1 2 3 4 5, which represents a sequence of integers.[57] For summary statistics, the summary() function applied to a vector like c(1:10) returns a concise overview, including minimum, maximum, mean, and quartiles, such as Min. 1st Qu. Median Mean 3rd Qu. Max. 1.000 2.750 5.500 5.500 8.250 10.000.[57]
R operates primarily in an interactive session via its console, allowing users to enter commands line-by-line and maintain a persistent workspace of objects and variables. To preserve the session state for later use, the save.image() function stores all workspace contents to a file named .RData in the current directory by default.[73] For non-interactive execution, R scripts—plain text files with a .R extension containing commands—can be run using source("file.R") from the console, which evaluates the script sequentially and returns control to the user.[57] In batch mode, suitable for automated processing, the command R CMD BATCH file.R executes the script without user interaction, producing an output file file.Rout with results and any errors.[57]
A common beginner pitfall is attempting to use functions from external packages without first loading them via library(package_name), which results in an error like "could not find function"; always verify package installation and loading before proceeding.[57]
Function Definition
In R, functions are defined using thefunction() constructor, which specifies a list of formal arguments followed by the body of the function enclosed in curly braces. The resulting function object can be assigned to a name and invoked by supplying arguments that match the formal parameters. This mechanism allows users to encapsulate reusable code blocks, with the function returning the value of the last evaluated expression in its body unless an explicit return() statement is used.[21]
A simple function can add two numeric inputs and return their sum, demonstrating basic definition and invocation:
my_sum <- function(a, b) {
  a + b
}
result <- my_sum(3, 5)  # Returns 8
my_sum <- function(a, b) {
  a + b
}
result <- my_sum(3, 5)  # Returns 8
my_sum takes two arguments a and b, computes their sum using the vectorized + operator, and implicitly returns the result. Functions like this operate element-wise on vectors if arguments are provided as such, for example, my_sum(c(1, 2), c(3, 4)) yields c(4, 6).[21]
Functions can include default argument values to make them more flexible, and the special ... argument allows passing a variable number of additional arguments to other functions. For instance, a wrapper around the base mean() function might specify a default for handling missing values:
calc_mean <- function(x, na.rm = FALSE) {
  mean(x, na.rm = na.rm)
}
result <- calc_mean(c(1, 2, NA, 4))  # Returns NA with default
result <- calc_mean(c(1, 2, NA, 4), na.rm = TRUE)  # Returns 2.333333
calc_mean <- function(x, na.rm = FALSE) {
  mean(x, na.rm = na.rm)
}
result <- calc_mean(c(1, 2, NA, 4))  # Returns NA with default
result <- calc_mean(c(1, 2, NA, 4), na.rm = TRUE)  # Returns 2.333333
na.rm defaults to FALSE, but can be overridden; the ... could be added as calc_mean <- function(x, ..., na.rm = FALSE) { mean(x, ..., na.rm = na.rm) } to forward extra options like trim to mean(). Default expressions are evaluated in the function's environment only when the argument is unspecified.[21][57]
Control flow constructs such as if-else statements enable conditional logic within functions, including recursion where a function calls itself. A classic example is computing the factorial of a non-negative integer using recursion:
factorial <- function(n) {
  if (n <= 1) {
    1
  } else {
    n * factorial(n - 1)
  }
}
factorial(5)  # Returns 120
factorial <- function(n) {
  if (n <= 1) {
    1
  } else {
    n * factorial(n - 1)
  }
}
factorial(5)  # Returns 120
n <= 1) and recursively multiplies n by the factorial of n - 1 otherwise, with R managing the call stack to prevent infinite recursion for valid inputs. Loops like for or while can alternatively implement factorial iteratively, but recursion illustrates self-reference clearly.[21][57]
To inspect the environment and variables during function execution, R provides debugging tools such as debug() and browser(). Applying debug(my_sum) before calling my_sum(3, 5) enters an interactive mode, stepping through the code line by line and allowing examination of local variables like a and b via commands such as ls(). Alternatively, inserting browser() inside the function body pauses execution at that point for similar inspection without pre-setting debug mode. These tools reveal the function's evaluation frame, argument bindings, and intermediate results.[21][57]
R encourages writing vectorized functions that leverage built-in operators and functions to operate on entire vectors or arrays without explicit loops, improving efficiency and readability. For example, instead of looping over elements to add two vectors, the simple my_sum above already vectorizes naturally due to R's recycling rules. More complex cases might use functions like sapply() or vapply() for applying operations across data structures, avoiding for loops that iterate manually. This approach aligns with R's design for statistical computing, where data is typically vectorized.[21][57]
Data Modeling and Plotting
R provides robust capabilities for statistical data modeling, allowing users to fit models to datasets and visualize results directly within the same workflow. Central to this is the integration of modeling functions with basic plotting methods, enabling quick assessment of model fit and assumptions. For instance, linear regression models can be constructed using thelm() function, which employs ordinary least squares to estimate coefficients for a response variable against one or more predictors. This function supports formula-based specification, where the model is defined as y ~ x, facilitating regression analysis on data frames.
A common example involves the built-in mtcars dataset, which contains measurements on automobile fuel consumption and performance for 32 models from the 1974 Motor Trend US magazine. To perform linear regression on this data, one first attaches the dataset to the search path using attach(mtcars), making its variables directly accessible without qualification. Alternatively, the with() function evaluates expressions within the data frame environment, such as with(mtcars, lm(mpg ~ wt)), avoiding global attachments that can lead to namespace conflicts. Subsetting can then refine the data, as in subset(mtcars, cyl == 6), to focus on specific groups like six-cylinder cars.
Once fitted, the model summary is obtained via summary(model), which outputs coefficients, standard errors, t-values, p-values, and overall fit statistics like R-squared. Visualization follows with plot(model), generating diagnostic plots including residuals versus fitted values, a Q-Q plot for normality, scale-location, and residuals versus leverage to identify influential points. For residual analysis specifically, residuals(model) extracts the residuals, which can be plotted against fitted values using plot(fitted(model), residuals(model)) to check for patterns indicating model inadequacy, such as heteroscedasticity.
For categorical predictors, analysis of variance (ANOVA) employs the aov() function, which fits models analogous to lm() but optimized for balanced designs and factorial structures. Using the mtcars data, one might model miles per gallon by cylinders: model_aov <- aov(mpg ~ factor(cyl), data = mtcars), followed by summary(model_aov) to display the ANOVA table with degrees of freedom, sum of squares, mean squares, F-statistics, and p-values testing group differences. Accompanying visualization uses boxplot(mpg ~ cyl, data = mtcars) to illustrate distributions across cylinder levels, highlighting medians, quartiles, and outliers for intuitive comparison.
Results from these analyses can be exported for further use or reporting. Model predictions or augmented data frames are saved as CSV files with write.csv(results, "output.csv"), preserving structure for import into other tools. Similarly, plots are directed to files by initiating a graphics device, such as png("model_plot.png") before plotting and dev.off() afterward, producing image files for documentation. This seamless export process supports reproducible research by archiving both data and visuals.
Advanced Example: Mandelbrot Set
The Mandelbrot set is a fractal consisting of all complex numbers for which the sequence , remains bounded under iteration. In computational approximations, a point is deemed inside the set if the magnitude stays at or below 2 after a fixed maximum number of iterations (typically 50 to 1000), as values exceeding this threshold generally diverge to infinity. This escape criterion enables efficient estimation of set membership across a grid of complex values. R's support for complex numbers allows vectorized computation of the Mandelbrot set without external libraries, leveraging matrix operations for efficiency. The following code generates a 800x800 grid over the region , computes iteration counts until escape or maximum iterations (256), and maps them to colors for visualization:n <- 800
max_iter <- 256
x <- seq(-2.5, 1, length.out = n)
y <- seq(-1.5, 1.5, length.out = n)
c_vals <- outer(x, 1i * y, "+") # Complex grid for c
z <- matrix(0, nrow = n, ncol = n)
iter_count <- matrix(max_iter, nrow = n, ncol = n)
for (k in 1:max_iter) {
z <- z^2 + c_vals
escape <- Mod(z) > 2
iter_count[escape] <- k - 1
z[escape] <- Inf # Halt iteration for escaped points
}
# Plot using base graphics
image(x, y, iter_count, col = rainbow(max_iter), xlab = "Re(c)", ylab = "Im(c)",
main = "Mandelbrot Set Approximation")
n <- 800
max_iter <- 256
x <- seq(-2.5, 1, length.out = n)
y <- seq(-1.5, 1.5, length.out = n)
c_vals <- outer(x, 1i * y, "+")  # Complex grid for c
z <- matrix(0, nrow = n, ncol = n)
iter_count <- matrix(max_iter, nrow = n, ncol = n)

for (k in 1:max_iter) {
  z <- z^2 + c_vals
  escape <- Mod(z) > 2
  iter_count[escape] <- k - 1
  z[escape] <- Inf  # Halt iteration for escaped points
}

# Plot using base graphics
image(x, y, iter_count, col = rainbow(max_iter), xlab = "Re(c)", ylab = "Im(c)",
      main = "Mandelbrot Set Approximation")
image() function then renders the result as a raster plot, with iteration counts determining pixel colors—lower values (inside the set) in one hue range and higher (exterior, escaped early) in another. For 3D visualization, persp() can surface-plot the iteration matrix instead.
Optimization in R exploits complex arithmetic directly, avoiding separate real and imaginary extractions via Re() and Im() unless needed for custom operations; here, full complex vectors suffice for speed. Performance scales quadratically with grid size and linearly with maximum iterations, making it suitable for desktop computation: for the above example (, max_iter = 256), execution typically takes under 5 seconds on modern hardware. Timing can be measured with system.time() around the loop:
system.time({
  # Insertion point for the iteration code
})
system.time({
  # Insertion point for the iteration code
})
parallel for further scaling. Extensions include animating zooms into boundary details using the animation package, which records frame-by-frame refinements of the grid and iterations.
Ecosystem and Community
Packages and CRAN
R packages are distributed as structured archives containing source code, documentation, and metadata, enabling modular extension of the language's capabilities. The core structure includes aDESCRIPTION file that specifies essential metadata such as the package name, version, author, license, and dependencies; a NAMESPACE file that controls imports, exports, and visibility of functions; and an R/ directory holding the R scripts with functions, data, and documentation. Additional directories like man/ for help files and data/ for datasets may be present, but the R/ directory is mandatory for executable code. To build a package from this structure into a distributable tarball, developers use the command R CMD build, which compiles vignettes, checks dependencies, and generates the final archive.[74]
Installation of packages from repositories like CRAN is handled via the install.packages("package_name") function, which downloads the package binary or source, resolves dependencies, and places it in the user's library path. Once installed, packages are loaded into the current session using library(package_name) or require(package_name), making their functions and data available for use; library() returns a logical indicating successful loading, while require() is similar but suppresses startup messages in some contexts.[75]
The Comprehensive R Archive Network (CRAN), founded in 1997 by Kurt Hornik and Friedrich Leisch, serves as the primary repository for R packages and serves as a worldwide network of mirrors to facilitate efficient distribution. As of November 2025, CRAN hosts over 23,000 packages, covering diverse domains from statistics to graphics and data manipulation. The submission process requires developers to submit the package via the CRAN web form by uploading the built package tarball, after which automated checks for code validity, documentation, and compliance with policies are performed; successful submissions are reviewed manually before publication, typically within days to weeks. CRAN maintains 93 mirrors globally, synchronized via rsync to ensure low-latency access and redundancy.[76][77][78]
CRAN Task Views provide curated overviews of relevant packages for specific application areas, helping users discover tools without exhaustive searching. For instance, the Econometrics Task View lists packages for time series analysis, panel data modeling, and instrumental variables estimation, while the Machine Learning & Statistical Learning Task View covers algorithms like random forests, support vector machines, and neural networks, along with evaluation metrics. These views are maintained collaboratively and updated regularly to reflect evolving needs in those domains.[79]
Package dependencies are declared in the DESCRIPTION file under fields like Imports, Depends, and Suggests, ensuring required libraries are installed automatically during package installation. For bioinformatics and genomics packages hosted on Bioconductor—a sister repository to CRAN—users install and manage them via the BiocManager package, which aligns versions with the user's R installation and handles cross-repository dependencies. To detect and manage function name conflicts arising from multiple loaded packages, R provides the conflicts() function, which scans the search path and reports overlapping names, allowing users to qualify calls with explicit package prefixes like package::function().[80]
R Community and Contributions
The R Foundation is a not-for-profit organization established to support the development of the R project, foster innovations in statistical computing, ensure the language's ongoing evolution, and promote education and training in the field.[12] It administers copyrights for R software and documentation, aligns with the Free Software Foundation's GNU project, and attracts funding through membership fees from individuals and organizations, donations, and grants, including a $450,000 investment from the Sovereign Tech Fund in 2025 to enhance R's sustainability and security.[12][81] Complementing the Foundation, the R Consortium operates as a Linux Foundation project to advance the R ecosystem by providing infrastructure support, facilitating collaboration among developers, users, and organizations, and funding community initiatives.[82] Its Infrastructure Steering Committee awards grants for code development, workshops, and tools, with over $1 million distributed since inception to sustain open-source efforts and user groups worldwide.[83][84] The R community convenes through prominent events that facilitate knowledge sharing and networking. The annual useR! conference, held since 2004 and organized by volunteers with R Foundation endorsement, gathers developers, users, and enthusiasts for tutorials, presentations, and discussions on R advancements; the 2025 edition in Durham, North Carolina, emphasized cutting-edge applications and ecosystem developments.[85][86] Regional gatherings, such as the satRday series of one-day conferences, extend this reach globally, hosting events in locations like Berlin, Gdansk, and Belo Horizonte to promote local collaboration and accessibility.[87] Online forums serve as vital hubs for discussion and support within the R community. The R-help mailing list, maintained since R's early days, remains a primary venue for troubleshooting and sharing solutions on R usage, with thousands of active participants exchanging expertise daily.[88] On Stack Overflow, the tag has amassed over 500,000 questions as of November 2025, reflecting robust engagement for code-specific queries and best practices.[89] Similarly, the Reddit subreddit r/rstats, dedicated to R programming, news, and packages, fosters informal exchanges among tens of thousands of members, amplifying community-driven learning.[90] Contributions to R occur through structured channels that encourage participation from all skill levels. Bug reports are submitted via the official Bugzilla instance at bugs.r-project.org, enabling the core team to address issues systematically and incorporate user-submitted patches.[91] Package development follows guidelines outlined in the R Development Guide, which detail standards for code quality, documentation, and submission to repositories, ensuring maintainable extensions to the language. Diversity initiatives, notably R-Ladies—a global organization founded in 2012—promote gender equity by organizing meetups, workshops, and networking events to empower underrepresented genders in the R community.[92] The R community has expanded considerably, with estimates placing active users above 2 million by 2025, driven by its integration into data science workflows beyond traditional statistics.[93] This growth reflects a broader shift toward inclusive practices in data science, where R's strengths in visualization and analysis attract diverse professionals from academia, industry, and government, supported by initiatives enhancing accessibility and representation.[94][95]Implementations and Extensions
Core Implementation
The reference implementation of the R programming language, known as GNU R, serves as the standard distribution maintained by the R Core Team. It is primarily written in C for core functionality and system interactions, with Fortran used for numerical computations such as linear algebra routines, and R itself for high-level language features and extensions.[96][1] This multi-language architecture enables efficient handling of both interpretive execution and performance-critical operations, while allowing seamless integration of compiled code for speed. R operates as an interpreted language, parsing source code into an abstract syntax tree (AST) represented by S-expressions (SEXPs), which form the fundamental building blocks of all R objects as nodes in a SEXPREC or VECTOR_SEXPREC structure.[96] Memory management relies on a generational garbage collector that automatically reclaims unused objects, dividing allocations into classes such as non-vectors, small/large vectors, and custom allocators to optimize for common use cases like numeric arrays.[96] On 64-bit platforms, SEXPs support long vectors exceeding 2^31-1 elements, enhancing scalability for large datasets, with garbage collection triggered based on heap usage thresholds (e.g., minor collections at 10% growth, major at higher levels).[96] Since version 2.13.0, R includes a bytecode compiler that translates ASTs into platform-independent bytecode for execution on a virtual machine, reducing interpretation overhead for loops and function calls by up to 50% in benchmarks on simple expressions.[97] Recent versions, starting from 3.4.0 with just-in-time (JIT) compilation enabled by default and further enhancements in 4.0.0 such as improved reference counting for strings, compile frequently executed code to native machine instructions via the compiler package, yielding performance gains of 1.5-5x for numerical loops depending on optimization level. For parallelization, GNU R provides built-in support through the parallel package, which includes multicore processing via forking on Unix-like systems (using mclapply for parallel lapply) and cluster-based computation across distributed nodes using socket or MPI communication (via makeCluster and parLapply). This enables scalable execution on multi-core machines or high-performance computing clusters without external dependencies, though it requires careful management of random number generation for reproducibility. GNU R is designed for portability across platforms, compiling and running on Windows, macOS, Linux, and other Unix variants with minimal source changes, thanks to abstractions for file systems, encodings (e.g., UTF-8 on Unix, UTF-16 on Windows), and libraries like BLAS/LAPACK.[1] Platform-specific tweaks, such as Windows-specific DLL loading or Unix signal handling, ensure consistent behavior while leveraging native optimizations like multi-threaded linear algebra on supported hardware.Alternative Implementations
Alternative implementations of R provide specialized environments tailored for performance enhancements, integration with other platforms, or optimized numerical computations, often at the cost of full compatibility with the standard CRAN ecosystem. These variants diverge from the reference GNU R implementation by leveraging different underlying architectures or libraries, enabling use in niche scenarios such as big data processing or parallel computing. Renjin is a JVM-based interpreter for R that facilitates seamless integration between R code and Java libraries, allowing direct access to JVM data structures without costly data serialization. Developed from 2010 to 2021, it supports embedding R within Java applications and has been noted for improved performance in big data workflows due to the JVM's scalability and garbage collection optimizations. However, Renjin is no longer actively maintained, limiting its long-term viability for new projects.[98][99] pqR, or "pretty quick R," is a performance-focused fork of R that incorporates optimizations like deferred evaluation and enhanced garbage collection to accelerate code execution, particularly for scalar operations and loops. It supports parallelism across multiple processor cores, achieving speedups of up to 10 times on certain benchmarks compared to standard R, while maintaining high compatibility with R version 2.15.0 and later extensions. pqR's design emphasizes detailed code improvements for efficiency without altering the core language semantics.[100][101] Riposte is an experimental LLVM-based just-in-time (JIT) compiler and virtual machine for R, specializing in vectorized code through trace-driven optimization and length specialization. By dynamically extracting and compiling sequences of vector operations, it delivers significant speedups—often 5-20 times faster than vanilla R on numerical workloads—via LLVM's backend for machine code generation. Primarily a research-oriented implementation, Riposte targets high-performance computing but remains in early development stages with limited package support.[102][103] Microsoft R Open (MRO) was an enhanced distribution of R that integrated Intel's Math Kernel Library (MKL) for accelerated linear algebra and statistical routines, providing up to 2-5 times faster performance on multi-threaded numerical tasks compared to the standard CRAN binaries. Released from 2014 to 2021, it included reproducible package snapshots via the MRAN repository but was discontinued after version 4.0.2, with Microsoft recommending a transition to the official CRAN distribution for ongoing support.[104][105] These alternative implementations generally support only a subset of CRAN packages, with compatibility varying by the extent of reliance on native C/Fortran code or system calls; for instance, Renjin and pqR achieve around 80-90% coverage for common tasks but falter on graphics-intensive or platform-specific libraries. They find applications in specialized domains, such as Java-embedded systems for Renjin in enterprise analytics or high-performance servers for pqR and Riposte in scientific simulations.[106][107]User Interfaces
Command-Line and Scripts
R can be invoked from the command line using theR executable, which starts an interactive session by default, allowing users to enter commands directly. The basic syntax is R [options] [<infile] [>outfile], where options control the startup behavior, <infile redirects input from a file, and >outfile redirects output to a file. For a clean start without loading user or site-specific initialization files or saved data, the --vanilla option is used, as in R --vanilla. Similarly, the --save option (enabled by default in interactive mode) ensures the workspace is saved to the .RData file upon exit, while --no-save prevents this.[57]
For non-interactive batch processing, R provides Rscript, a front-end executable designed specifically for running R scripts from the command line without starting an interactive session. The syntax is Rscript [options] [-e expr] file [args], where file is the path to an R script containing expressions to evaluate, expr is an optional R expression to run before the script, and args are additional arguments accessible within the script via commandArgs(trailingOnly = TRUE). This tool supports shebang lines for executable scripts on Unix-like systems, such as #!/usr/bin/env Rscript at the top of the file, enabling direct execution like ./script.R after making it executable with chmod +x. Options like --vanilla can be passed to Rscript for consistent, minimal environments.[108][57]
Input and output in command-line and script modes are handled through standard redirection and R functions for flexibility in automation. Command-line redirection allows feeding input via stdin (e.g., R < commands.R) or capturing output to stdout (e.g., R > output.txt), while within scripts, the source() function executes another file's contents (e.g., source("data.R")), and sink() diverts output to a file (e.g., sink("results.txt"); print(summary(data)); sink()). For literate programming, which integrates code, results, and documentation, Sweave processes .Rnw files combining LaTeX and R code into reports, invoked via R CMD Sweave file.Rnw, producing a .tex file for compilation. These mechanisms enable scripted workflows for reproducible analysis without graphical interaction.[57][109]
Environment variables customize R's behavior in command-line and script executions, particularly for package management and paths. The R_LIBS variable specifies additional directories for searching and installing packages, with paths separated by colons on Unix-like systems or semicolons on Windows (e.g., export R_LIBS=/path/to/libs), overriding defaults like the user's personal library. Other variables, such as R_HOME (location of R installation) and R_PROFILE_USER (path to user initialization file), influence startup but can be bypassed with options like --no-init-file. Setting these via shell commands before invoking R or Rscript ensures portable, environment-specific configurations.[57][110]
Debugging in scripts run from the command line relies on built-in R functions rather than invocation options, allowing developers to inspect errors and state non-interactively. The browser() function pauses execution at a point in the script, dropping into an interactive debugger prompt for commands like n (next step), c (continue), or Q (quit), with output visible in the terminal or redirected file. For functions, debug(fun) enables step-through debugging each time fun is called, while traceback() prints the call stack after an error, aiding diagnosis when running Rscript file.R. These tools facilitate error handling in automated scripts without requiring graphical tools.[21]
Graphical Interfaces
R provides several built-in graphical user interfaces (GUIs) tailored for interactive use on different platforms, enabling users to execute commands through menus and visual elements rather than solely relying on the command line. These interfaces facilitate basic data analysis, plotting, and scripting in a more accessible manner for beginners or those preferring point-and-click interactions.[110] On macOS, R.app serves as the native GUI, a Cocoa-based application that embeds R and offers a menu-driven environment for running commands, managing workspaces, and viewing graphics. Developed by Simon Urbanek and Stefano Iacus with community contributions, R.app supports both Intel and Apple Silicon architectures, requiring macOS 11 or later, and includes optional integrations like Tcl/Tk for extended functionality. It provides features such as script execution via menus, history recall, and integrated help access, making it suitable for standalone interactive sessions.[111] For Windows users, Rgui.exe acts as the default graphical frontend, delivering a menu-driven interface for command execution, package installation, and data loading. This console-like window supports interactive input with visual menus for common tasks like loading libraries or saving workspaces, and it leverages the Windows console subsystem for enhanced usability. Rgui is bundled in the standard R installation for Windows and requires the Universal C Runtime (UCRT) on supported systems.[112] Console enhancements within these GUIs improve interactivity through functions likereadline(), which prompts for and reads user input as a character string from the terminal, aiding in dynamic script development. On platforms using the GNU Readline library (such as Unix-like systems), this enables command history navigation via arrow keys, editing of previous lines, and tab completion, enhancing efficiency in repeated tasks. Windows and macOS variants provide similar history mechanisms through their respective console implementations.
The tcltk package, included as a base component in R distributions since version 1.1.0, allows users to build custom graphical user interfaces using the Tcl scripting language and Tk toolkit. It provides wrappers for creating windows, buttons, menus, and other widgets, enabling the development of tailored front-ends for R applications, such as dialog boxes for parameter input or interactive data explorers. For example, functions like tktoplevel() initialize a new window, while tkbutton() adds clickable elements bound to R commands, supporting cross-platform GUI prototyping without external dependencies beyond Tcl/Tk libraries.[113]
Web-based access is available through RStudio Server, a lightweight server application that delivers a browser-accessible interface to R running on a remote Linux machine, allowing multiple users to interact with R sessions via menus and consoles without local installation. This setup supports remote execution of scripts and graphics rendering in the browser, ideal for shared environments.[114]
Despite these options, R's built-in graphical interfaces remain relatively basic, lacking advanced features like integrated debugging, version control, or project management found in full integrated development environments, which can limit their appeal for complex workflows.[110]